- QlikView - Home
- QlikView - Overview
- QlikView - Desktop Installation
- QlikView - Architecture
- QlikView - Navigation
- QlikView - Excel file
- QlikView - Delimited file
- QlikView - XML file
- QlikView - Web file
- QlikView - Database
- QlikView - Inline Data
- QlikView - Resident Load
- QlikView - Preceding Load
- QlikView - Incremental Load
- QlikView - Data - files(QVD)
- QlikView Report Interface
- QlikView - Sheet and Objects
- QlikView - Scripting
- Qlikview - Functions
- QlikView - IntervalMatch
- QlikView - Aggregate Functions
- QlikView - Match Function
- QlikView - Rank Function
- QlikView - Peek Function
- QlikView - RangeSum Function
- QlikView - Documents
- QlikView - List Box
- QlikView - Multi Box
- QlikView - Text Object
- QlikView - Bar Chart
- QlikView - Pie Chart
- QlikView - Dashboard
- QlikView Data Transformation
- QlikView - Transformation Wizard
- QlikView - Fill Function
- QlikView - Column Manipulation
- QlikView - Rotating Tables
- QlikView Data Model
- QlikView - Dimensions & measures
- QlikView - Star Schema
- QlikView - Synthetic Key
- QlikView - Generating Data
- QlikView Data Analysis
- QlikView - Cross Tables
- QlikView - Straight Tables
- QlikView - Pivot Tables
- QlikView - Set Analysis
- QlikView - Joins
- QlikView - Keeps
- QlikView - Concatenation
- QlikView - Master Calendar
- QlikView - Mapping Tables
- QlikView - Circular Reference
- Qlikview Useful Resources
- Qlikview - Questions/Answers
- Qlikview - Quick Guide
- Qlikview - Useful Resources
- Qlikview - Discussion
QlikView - Aggregate Functions
QlikView Aggregate functions are used to produce aggregate data from the rows of the table. The functions are applied to the columns when creating the load script. Given below is a sample list of Aggregate functions. We also need to apply the Group by clause appropriately when applying the aggregate functions.
- SUM gives the sum of the numeric values of the column.
- AVG gives the average of the numeric values of the column.
- MAX gives the maximum of the numeric values of the column.
- MIN gives the minimum of the numeric values of the column.
Example
Consider the following data stored as product_sales.csv in the local system. It represents the sales figures for different product lines and product category in a store.
Product_Line,Product_category,Quantity,Value
Sporting Goods,Outdoor Recreation,12,5642
Food, Beverages & Tobacco,38,2514
Apparel & Accessories,Clothing,54,2365
Apparel & Accessories,Costumes & Accessories,29,4487
Sporting Goods,Athletics,11,812
Health & Beauty,Personal Care,21,6912
Arts & Entertainment,Hobbies & Creative Arts,58,5201
Arts & Entertainment,Paintings,73,8451
Arts & Entertainment,Musical Instruments,41,1245
Hardware,Tool Accessories,2,456
Home & Garden,Bathroom Accessories,36,241
Food,Drinks,54,1247
Home & Garden,Lawn & Garden,29,5462
Office Supplies,Presentation Supplies,22,577
Hardware,Blocks,53,548
Baby & Toddler,Diapering,19,1247
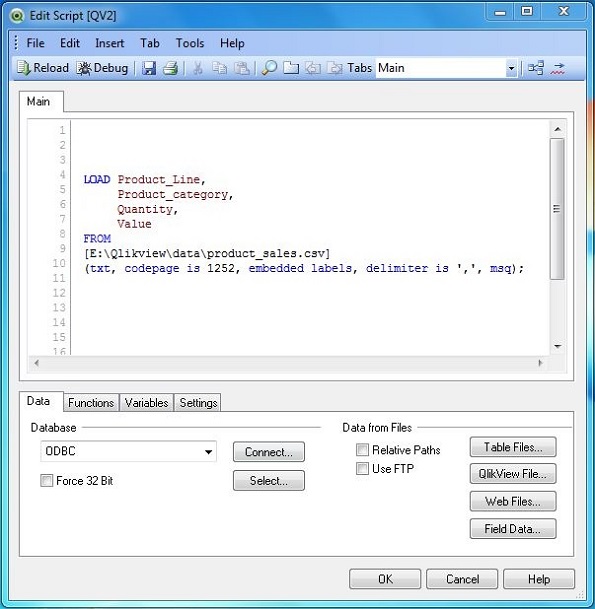
Creating the Load Script
We open the script editor in a new QlikView document using Control+E. The following code creates the required tables as inline data. After creating this script press control+R to reload the data into the QlikView document.
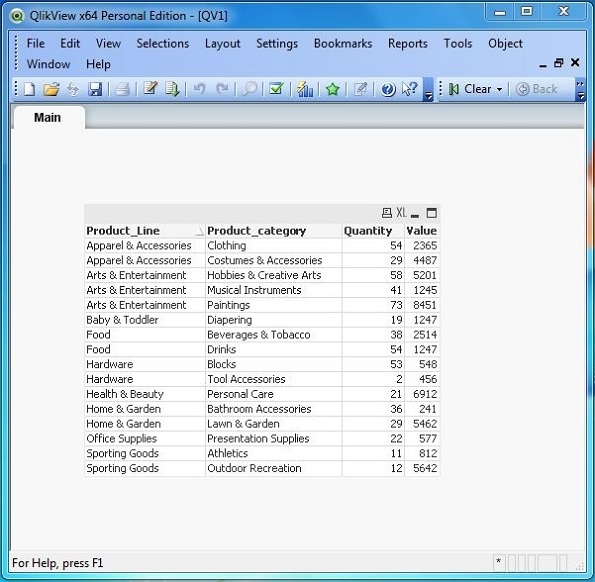
Creating Sheet Object
Let us create a Table Box sheet object to show the data generated by the Aggregate function. Go to the menu Layout → New Sheet Object → Table Box. The following window appears in which we mention the Title of the table and the select the required fields to be displayed. Clicking OK displays the data from the CSV file in the QlikView Table Box as shown below.
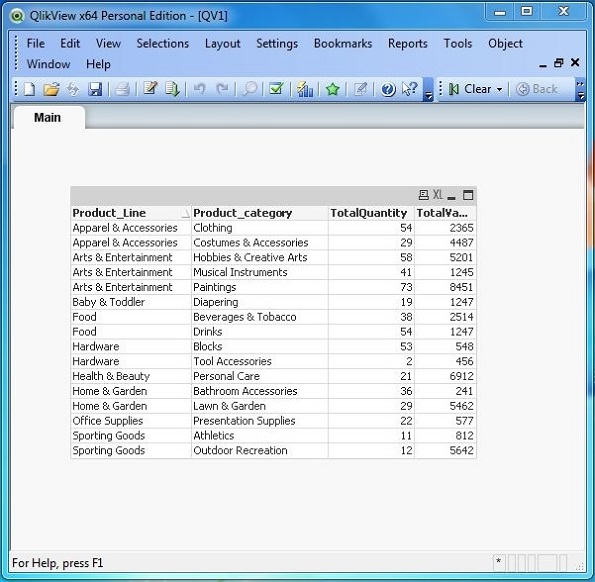
Applying SUM() function
Given below is the load script to find the sum of the sales quantity and sales value across the Product Lines and product categories.
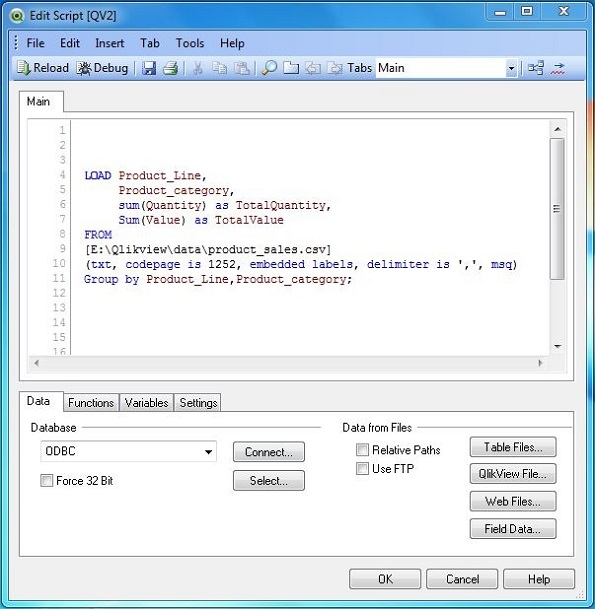
Click OK and press Control+R to reload the data into QlikView document. Now follow the same steps as given above in − Creating Sheet Objects to create a QlikView Table Box for displaying the result of the script as shown below.
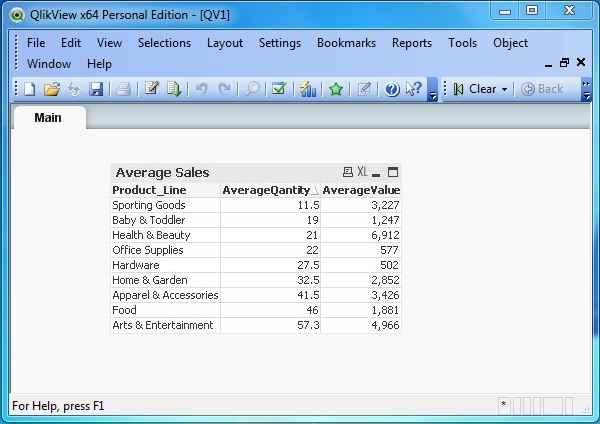
Applying AVG() function
Given below is the load script to create the average of the sales quantity and sales value across each Product Line.
# Average sales of Quantity and value in each Product Line.
LOAD Product_Line,
     avg(Quantity),
	 avg(Value)
FROM
[E:\Qlikview\data\product_sales.csv]
(txt, codepage is 1252, embedded labels, delimiter is ',', msq)
Group by Product_Line;
Click OK and press Control+R to reload the data into QlikView document. Now follow the same steps as given above in − Creating Sheet Objects to create a QlikView Table Box for displaying the result of the script as shown below.
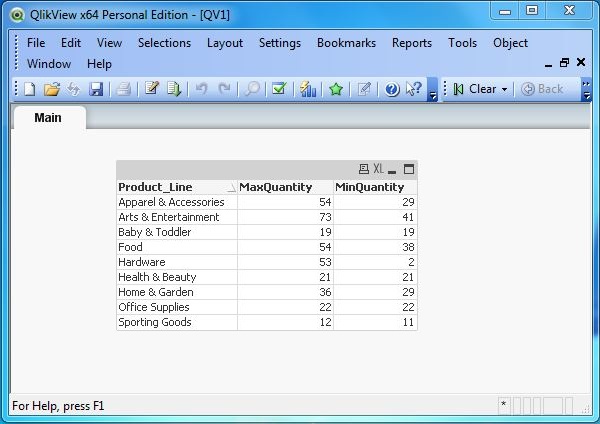
Applying MAX() & MIN() function
Given below is the load script to create the maximum and minimum of the sales quantity across each Product Line.
# Maximum and Minimum sales in each product Line.
LOAD Product_Line,
     max(Quantity) as MaxQuantity,
     min(Quantity) as MinQuantity
FROM
[E:\Qlikview\data\product_sales.csv]
(txt, codepage is 1252, embedded labels, delimiter is ',', msq)
Group by Product_Line;
Click OK and Control+R to reload the data into QlikView document. Now follow the same steps as above in − Creating Sheet Objects to create a QlikView Table Box for displaying the result of the script as shown below.