- QlikView - Home
- QlikView - Overview
- QlikView - Desktop Installation
- QlikView - Architecture
- QlikView - Navigation
- QlikView - Excel file
- QlikView - Delimited file
- QlikView - XML file
- QlikView - Web file
- QlikView - Database
- QlikView - Inline Data
- QlikView - Resident Load
- QlikView - Preceding Load
- QlikView - Incremental Load
- QlikView - Data - files(QVD)
- QlikView Report Interface
- QlikView - Sheet and Objects
- QlikView - Scripting
- Qlikview - Functions
- QlikView - IntervalMatch
- QlikView - Aggregate Functions
- QlikView - Match Function
- QlikView - Rank Function
- QlikView - Peek Function
- QlikView - RangeSum Function
- QlikView - Documents
- QlikView - List Box
- QlikView - Multi Box
- QlikView - Text Object
- QlikView - Bar Chart
- QlikView - Pie Chart
- QlikView - Dashboard
- QlikView Data Transformation
- QlikView - Transformation Wizard
- QlikView - Fill Function
- QlikView - Column Manipulation
- QlikView - Rotating Tables
- QlikView Data Model
- QlikView - Dimensions & measures
- QlikView - Star Schema
- QlikView - Synthetic Key
- QlikView - Generating Data
- QlikView Data Analysis
- QlikView - Cross Tables
- QlikView - Straight Tables
- QlikView - Pivot Tables
- QlikView - Set Analysis
- QlikView - Joins
- QlikView - Keeps
- QlikView - Concatenation
- QlikView - Master Calendar
- QlikView - Mapping Tables
- QlikView - Circular Reference
- Qlikview Useful Resources
- Qlikview - Questions/Answers
- Qlikview - Quick Guide
- Qlikview - Useful Resources
- Qlikview - Discussion
QlikView - Peek Function
The peek() function in QlikView is used to fetch the value of a field from a previous record and use it in calculations.
Input Data
Let us consider the monthly sales figure as shown below. Save the data with file name monthly_sales.csv.
Month,Sales Volume
March,2145
April,2458
May,1245
June,5124
July,7421
August,2584
September,5314
October,7846
November,6532
December,4625
January,8547
February,3265
Load Script
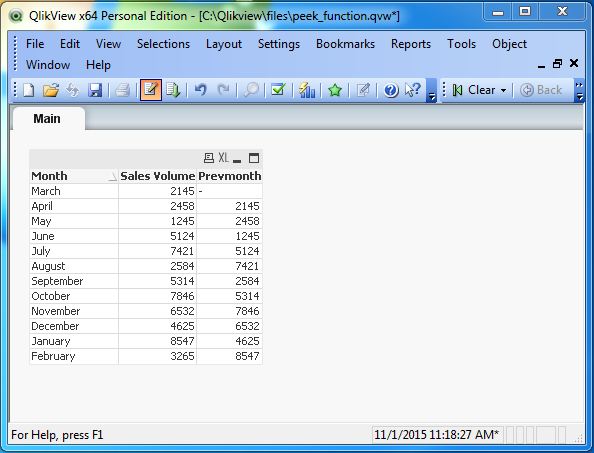
The above data is loaded to QlikView memory by using the script editor. Open the Script editor from the File menu or press Control+E. Choose the Table Files option from for the file containing the above data. Edit the load script to add the following code. Click OK and click Control+R to load the data into QlikView's memory.
LOAD Month,
     [Sales Volume],
     peek('Sales Volume') as Prevmonth
FROM
[C:\Qlikview\data\monthly_sales.csv]
(txt, codepage is 1252, embedded labels, delimiter is ',', msq);
Creating Sheet Object
Let us create a Table Box sheet object to show the data generated by the above script. Go to the menu item Layout → New Sheet Object → Table Box. The following window appears in which we mention the Title of the table and select the required fields to be displayed. Clicking OK displays the data from the csv file in the QlikView Table Box as shown below. Also set the sort order as shown below to get the result in the same order of the field Month as it is in the source.
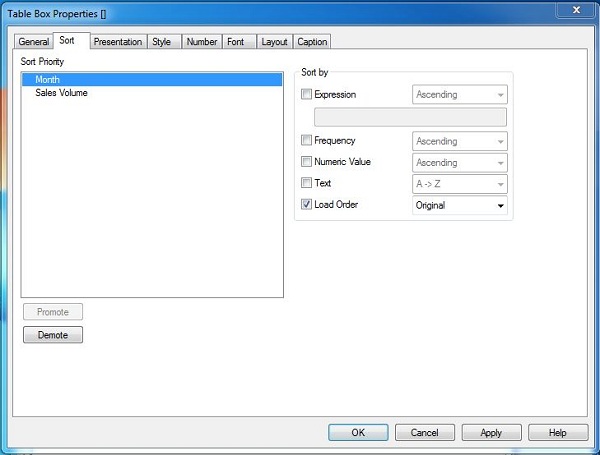
On completing the above steps and clicking Finish, we get the Table box showing the data as given below.
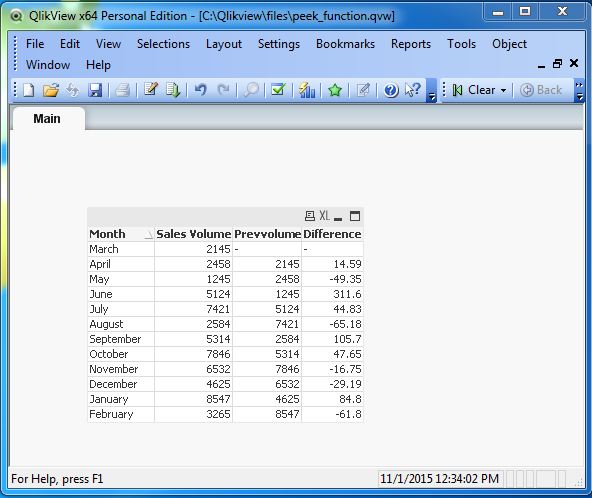
Using peek() Function in Calculations
The peek() can be used in calculations involving other columns. Let us display the percentage change for sales volume for each month. The following script achieves this result.
LOAD
Month, [Sales Volume],
peek('Sales Volume') as Prevvolume,
(([Sales Volume]-peek('Sales Volume')))/peek('Sales Volume')*100  as Difference
FROM
[C:\Qlikview\data\monthly_sales.csv]
(txt, codepage is 1252, embedded labels, delimiter is ',', msq);
Creating Sheet Object
Let us create a Table Box sheet object to show the data generated by the above script. Go to the menu item Layout → New Sheet Object → Table Box. The following window appears in which we mention the Title of the table and select the required fields to be displayed. Clicking OK displays the data from the CSV file in the QlikView Table Box as shown below.