- QlikView - Home
- QlikView - Overview
- QlikView - Desktop Installation
- QlikView - Architecture
- QlikView - Navigation
- QlikView - Excel file
- QlikView - Delimited file
- QlikView - XML file
- QlikView - Web file
- QlikView - Database
- QlikView - Inline Data
- QlikView - Resident Load
- QlikView - Preceding Load
- QlikView - Incremental Load
- QlikView - Data - files(QVD)
- QlikView Report Interface
- QlikView - Sheet and Objects
- QlikView - Scripting
- Qlikview - Functions
- QlikView - IntervalMatch
- QlikView - Aggregate Functions
- QlikView - Match Function
- QlikView - Rank Function
- QlikView - Peek Function
- QlikView - RangeSum Function
- QlikView - Documents
- QlikView - List Box
- QlikView - Multi Box
- QlikView - Text Object
- QlikView - Bar Chart
- QlikView - Pie Chart
- QlikView - Dashboard
- QlikView Data Transformation
- QlikView - Transformation Wizard
- QlikView - Fill Function
- QlikView - Column Manipulation
- QlikView - Rotating Tables
- QlikView Data Model
- QlikView - Dimensions & measures
- QlikView - Star Schema
- QlikView - Synthetic Key
- QlikView - Generating Data
- QlikView Data Analysis
- QlikView - Cross Tables
- QlikView - Straight Tables
- QlikView - Pivot Tables
- QlikView - Set Analysis
- QlikView - Joins
- QlikView - Keeps
- QlikView - Concatenation
- QlikView - Master Calendar
- QlikView - Mapping Tables
- QlikView - Circular Reference
- Qlikview Useful Resources
- Qlikview - Questions/Answers
- Qlikview - Quick Guide
- Qlikview - Useful Resources
- Qlikview - Discussion
QlikView - Quick Guide
QlikView - Overview
QlikView is a leading Business Discovery Platform. It is unique in many ways as compared to the traditional BI platforms. As a data analysis tool, it always maintains the relationship between the data and this relationship can be seen visually using colors. It also shows the data that are not related. It provides both direct and indirect searches by using individual searches in the list boxes.
QlikView's core and patented technology has the feature of in-memory data processing, which gives superfast result to the users. It calculates aggregations on the fly and compresses data to 10% of original size. Neither users nor developers of QlikView applications manage the relationship between data. It is managed automatically.
Features of QlikView
QlikView has patented technology, which enables it to have many features that are useful in creating advanced reports from multiple data sources quickly. Following is a list of features that makes QlikView very unique.
Data Association is maintained automatically − QlikView automatically recognizes the relationship between each piece of data that is present in a dataset. Users need not preconfigure the relationship between different data entities.
Data is held in memory for multiple users, for a super-fast user experience − The structure, data and calculations of a report are all held in the memory (RAM) of the server.
Aggregations are calculated on the fly as needed − As the data is held in memory, calculations are done on the fly. No need of storing pre-calculated aggregate values.
Data is compressed to 10% of its original size − QlikView heavily uses data dictionary. Only essential bits of data in memory is required for any analysis. Hence, it compresses the original data to a very small size.
Visual relationship using colors − The relationship between data is not shown by arrow or lines but by colors. Selecting a piece of data gives specific colors to the related data and another color to unrelated data.
Direct and Indirect searches − Instead of giving the direct value a user is looking for, they can input some related data and get the exact result because of the data association. Of course, they can also search for a value directly.
QlikView - Installation
Download QlikView
The Free Personal Edition of QlikView can be downloaded from QlikView Personal Edition. You need to register with your details to be able to download.
After downloading, the installation is a very straightforward process in which you need to accept the license agreement and provide the target folder for installation. The screen shots given below describe the entire setup process.
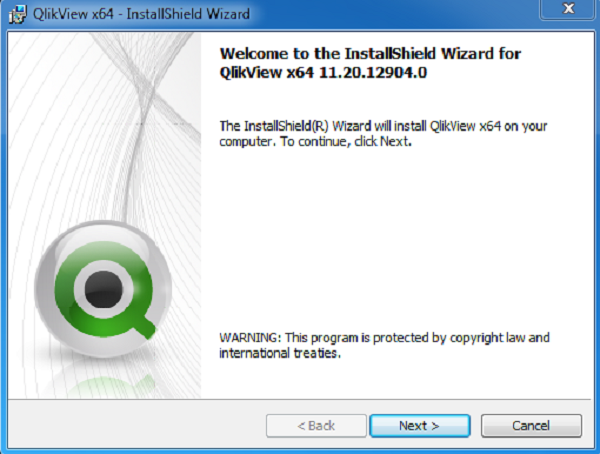
Start the installation wizard
Double clicking the QlikViewDesktop_x64Setup.exe will present a screen to select the language of your choice. On selecting English, the following screen is displayed. Then click Next.
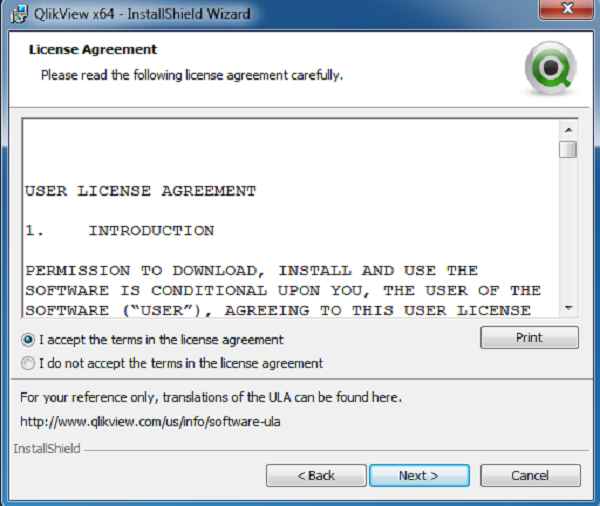
Accept the License Agreement
Read the license agreement and if you agree, choose the "I accept the terms in the license agreement" option. Then click "Next".
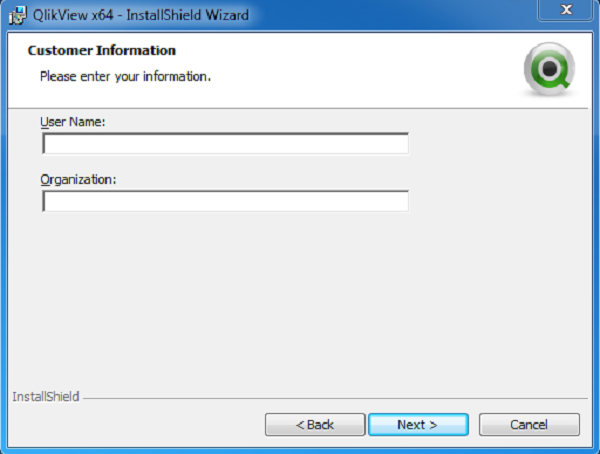
Provide your Details
Provide your name and organization details. Then Click "Next".
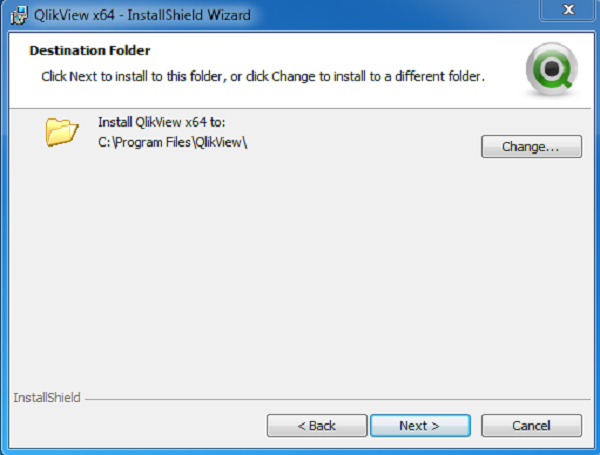
Choose the Destination Folder
You may accept the default destination for installation or alter it. Then click "Next".
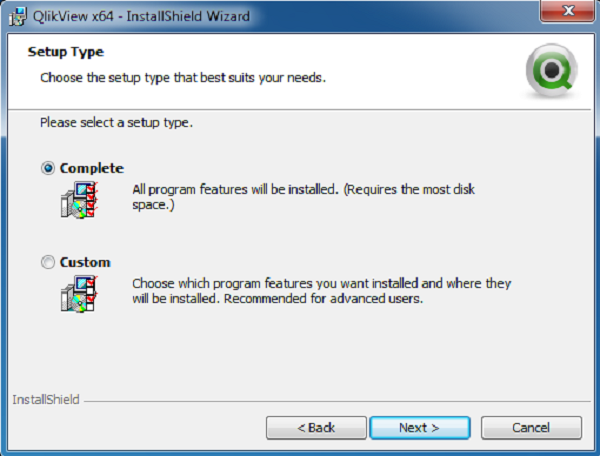
Choose the Setup Type
Choose the setup type as "Complete". Then click "Next".
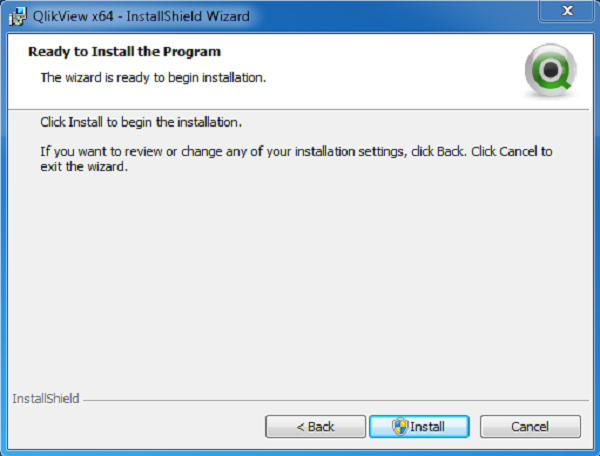
Begin Installation
In this screen, you finally decide to really start the installation. You can still go back and change some options if needed. Assuming you are fine with everything so far, click "Install".
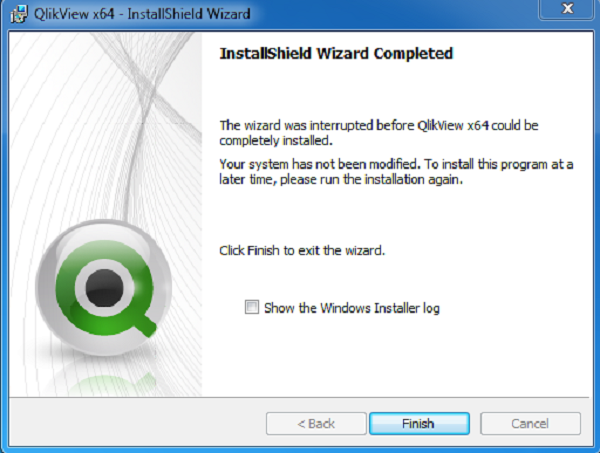
Installation Complete
The installation completion screen appears after successful installation. Click "Finish".
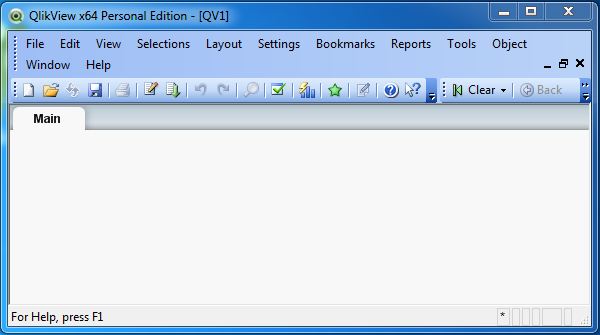
Verify the Installation
You can verify the installation by going to the Windows Start menu and clicking on the QlikView icon. The screen appears as shown below.
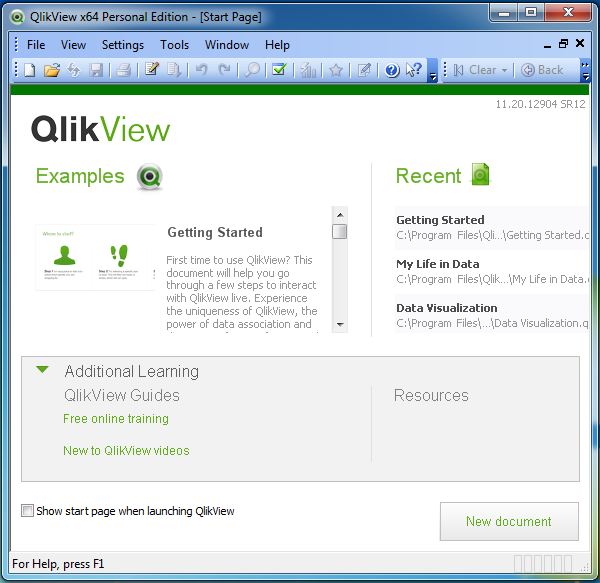
You are now ready to learn QlikView.
QlikView - Architecture
As a leading Business Discovery Platform, QlikView is built with a very different approach to data discovery than other traditional platforms. QlikView does not first build a query and then fetch the result based on the query. Rather, it forms associations between different data objects as soon as it is loaded and prompts the user to explore the data in any way. There is no predefined data drill down paths. The data drill down paths can happen in any direction as long as the data is available and associated.
Of course, a user can also play a role in creating the associations between data elements using data modeling approach available in QlikView.
Architectural Overview
QlikView's architecture consists of a front end to visualize the processed data and a back end to provide the security and publication mechanism for QlikView user documents. The diagram given below depicts the internal working of QlikView. The architecture is discussed in detail below the picture.
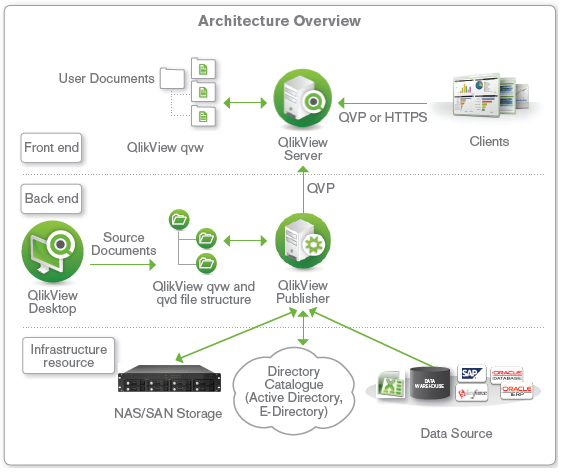
Front End
The Front end in QlikView is a browser-based access point for viewing the QlikView documents. It contains the QlikView Server, which is mainly used by the Business users to access the already created BI reports through an internet or intranet URL.
Business users explore and interact with data using this front end and derive conclusions about the data. They also collaborate with other users on a given set of reports by sharing insights and exploring data together, in real time or off-line. These user documents are in the format .qvw, which can also be stored in the windows OS as a standalone document
The QlikView server in the front end manages the client server communication between the user and QlikView backend system.
Back End
The QlikView backend consists of QlikView desktop and QlikView publisher.
The QlikView desktop is a wizard-driven Windows environment, which has the features to load and transform data from its source. Its drag and drop feature is used to create the GUI layout of the reports that becomes visible in the frontend. The file types, which are created by QlikView desktop are stored with an extension of .qvw. These are the files that are passed on to the QlikView server in the front end, which serves the users with these files. Also .qvw files can be modified to store the data-inly files, which are known as .qvd files. They are binary files, which contain only the data and not the GUI components.
The QlikView publisher is used as distribution service to distribute the .qvw documents among various QlikView servers and users. It handles the authorization and access privileges. It also does the direct loading of data from data sources by using the connection strings defined in the .qvw files.
QlikView - Navigation
In this chapter, we will get acquainted with the screens available to a user for doing various operations. We will learn the basic navigation and know the different functions performed by the icons available in QlikView.
Getting Started Screen
This screen is a gentle introduction to navigate around QlikView. This screen comes up when you start QlikView and keep the Show start page when launching QlikView option checked. If you scroll down the examples section in the left, you can click any of the examples like − Movies Database, Data Visualization etc. to invoke it and see how QlikView works. Feel free to click around! On moving to the right, you notice the Recent and Favourites link, which show all the recently visited QlikView documents and the documents you want to visit frequently.
Menu Commands
On closing the Getting Started window, we get the main interface with all the available Menu commands. They represent the entire set of features available in QlikView. Given below is an overview of each section of the Menu Commands.
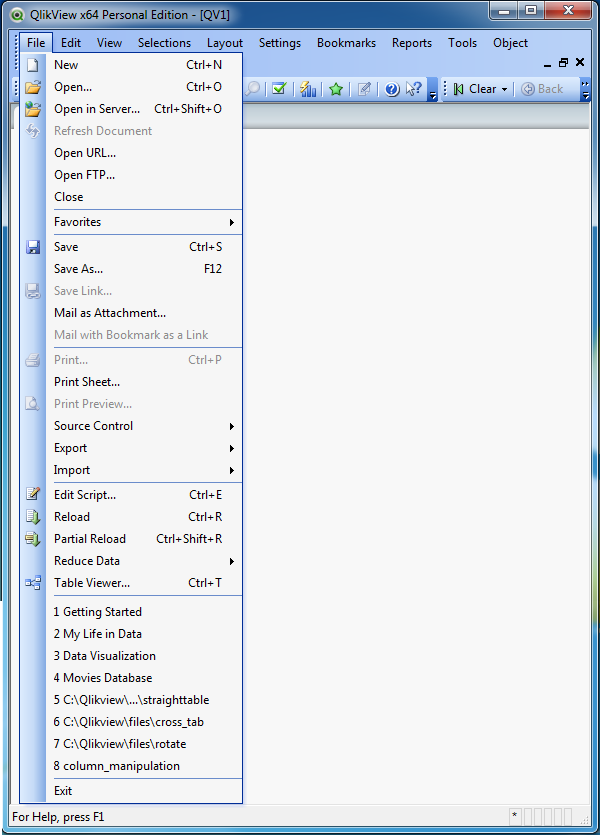
File Menu
This menu is used to create a new QlikView file and open the existing files from both local system and QlikView server. The important features in this menu are −
Mail as attachment to email the currently open document as an attachment.
Reduce Data to view only the report layout and database structure without any data.
Table viewer option is used to see the structure of the tables, fields and their association in a graphical view.
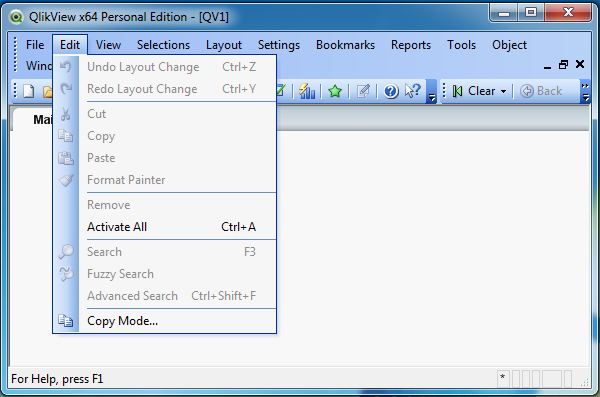
Edit Menu
This menu is used to carry out the editing options like copy, paste, cut and using format painter. The important features in this menu are −
Active All option activates all the sheet objects present in the opened sheet.
Removeto remove a sheet from the active window.
Advanced search option is used to do a search with advanced search expressions using multi box.
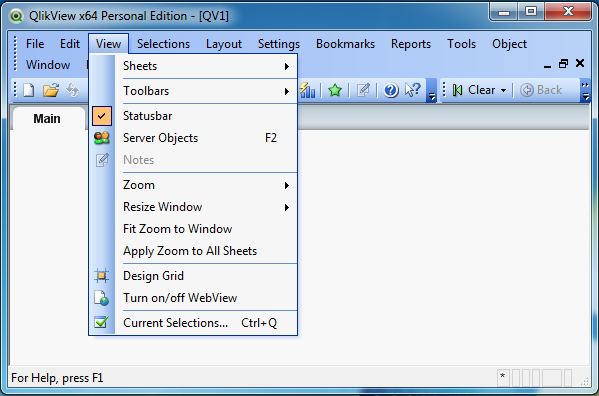
View Menu
This menu is used to view the standard toolbars and zoom in/ zoom out features. It also displays all the active sheets as a cascade menu. The important features in this menu are −
Turn on/off WebView mode toggles the WebView mode and local view mode.
Current Selections displays the field name and file values of the selected sheet objects.
Design Grid is used to toggle the sheet object placeholders for active object(s) and snap-to-grid for sizing and moving objects in the layout.
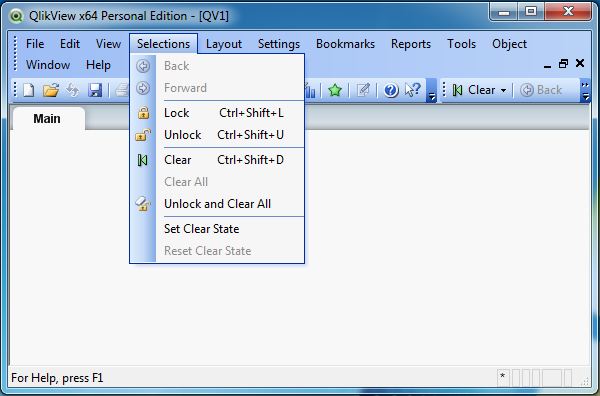
Selection Menu
This menu is used to select and clear the selection of values in the sheet objects. It also provides the feature of going back and forward into different logical statements of the sheet, you are working on. The important features in this menu are −
- Lock locks all the values in current selection.
- Unlock unlocks all the locked values in the current selection.
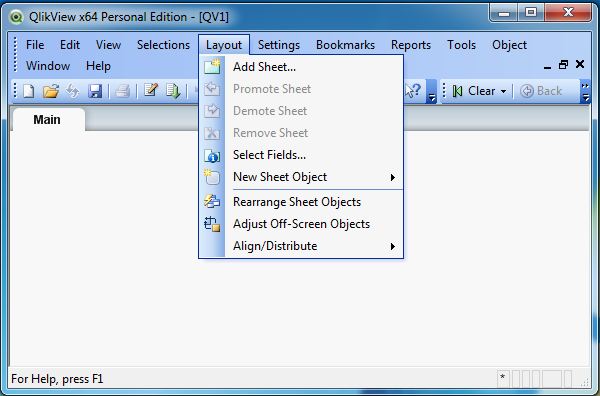
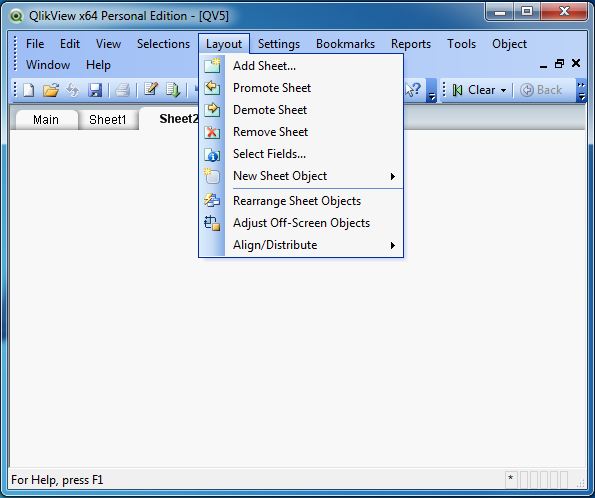
Layout Menu
Layout Menu is used to add tabbed sheets, select different sheets and rearrange sheet objects. The important features in this menu are −
- Promote sheet moves the current sheet or tab one step forward.
- Demote sheet moves the current sheet or tab one step backward.
- Delete sheet deletes the active sheet and everything in it.
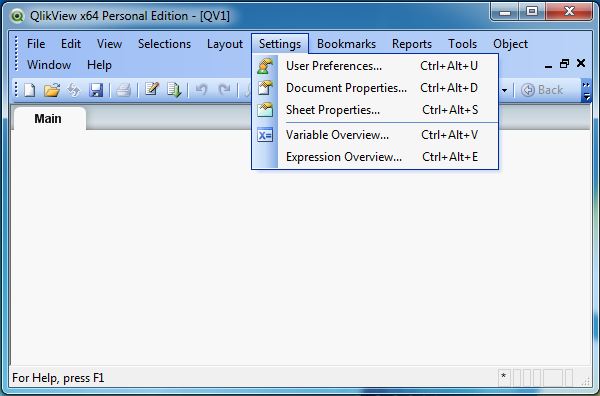
Settings Menu
Settings menu is used to set the user preferences, document properties, and sheet properties. The important features in this menu are −
- Variable overview all the non-hidden variables and their values in a single list.
- Expression Overview shows expressions from the document, sheet and sheet objects as a single list.
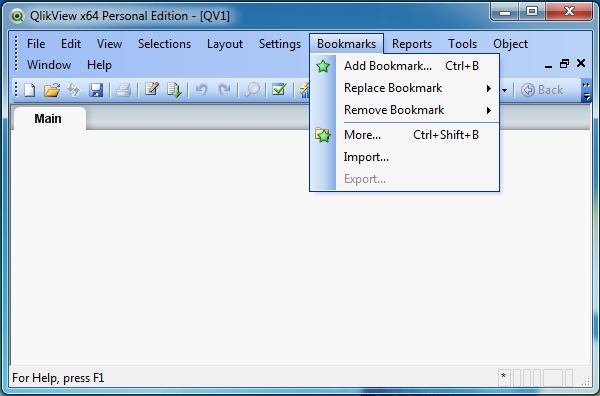
Bookmark Menu
This menu is used to create bookmarks to different documents for faster retrieval.
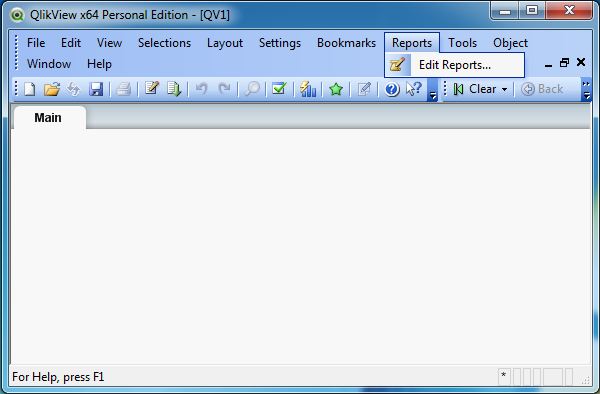
Reports Menu
Reports menu is used to create new reports and edit the existing reports. You can edit the layout, add pages to the report, and also delete reports.
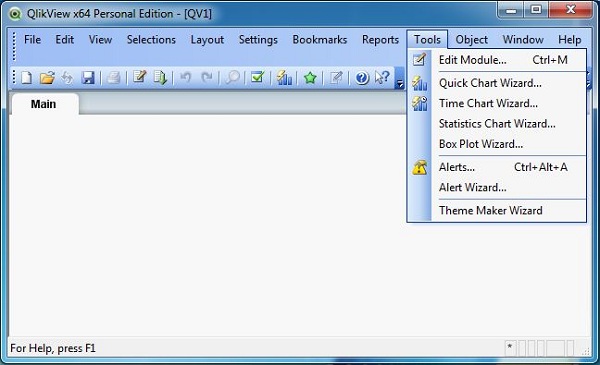
Tools Menu
Tools menu is a very prominent menu, frequently used for creating charts and opening the QlikView management console. The important features in this menu are −
Quick Chart Wizard creates simple charts without using the great number of different settings and options available.
Time Chart Wizard creates time series charts.
Statistics Chart Wizard is used to apply common statistical tests on data.
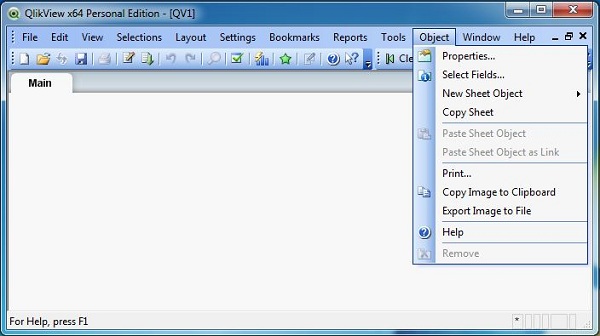
Object Menu
This menu is used to create new sheet objects and modify the existing ones. The sheet properties option opens the page to set the parameters defining the sheet. The important features in this menu are −
Copy Sheet − creates a copy of the sheet along with the all the sheet objects.
Copy Image to Clipboard − Copies a bitmap picture of the sheet area to Clipboard.
Remove − completely removes the sheet along with the sheet objects.
The Window and Help menus are used to organize the different windows of QlikView application and provide help documentation.
QlikView - Excel Files
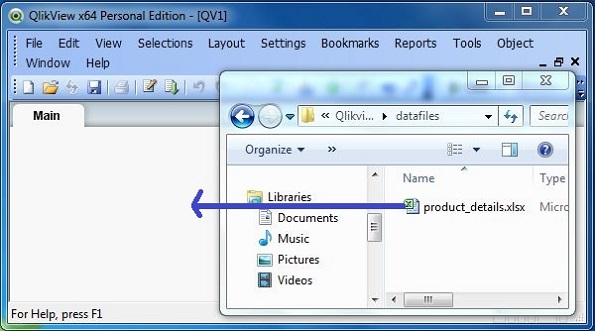
QlikView accepts Excel spreadsheet for data analysis by simple drag and drop action. You need to open the QlikView main window and drag and drop the excel file into the interface. It will automatically create the sheet showing the excel data.
Select the Excel file
Keep the main window of QlikView open and browse for the excel file you want to use.
Select a Data Source
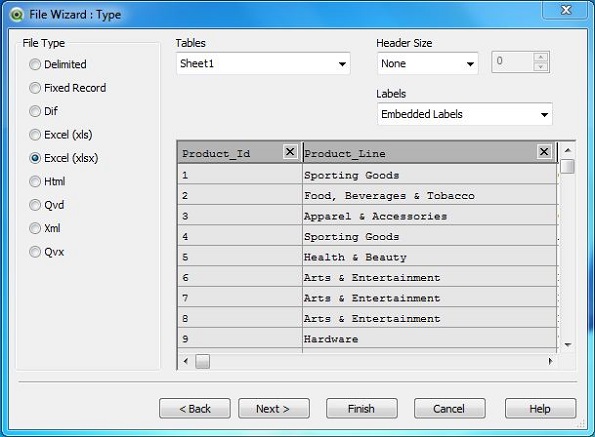
On dropping the excel file into the main window, the File wizard appears. The File Type is already chosen as Excel. Under Labels, choose Embedded Labels. Click "Next step" to proceed.
Load Script
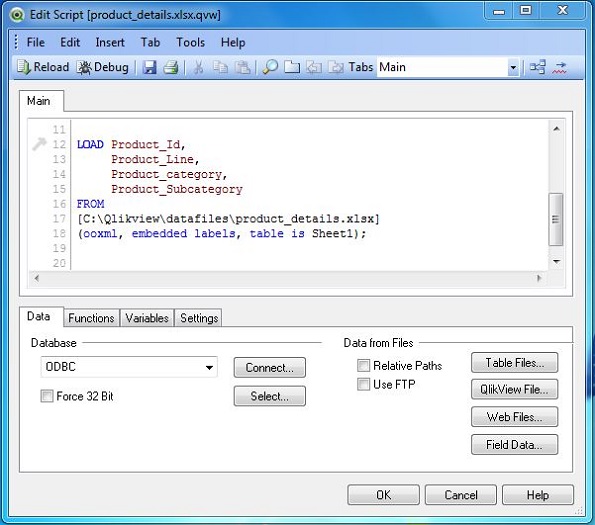
The Load script appears which shows the command that loads the data into the QlikView document. This command can be edited.
Now, the Excel wizard prompts to save the file in the form of *.qvw file extension. It asks to select a location where you need to save the file. Click "Next step" to proceed. Now it is time to see the data that is loaded from the Excel file. We use a Table Box sheet object to display this data.
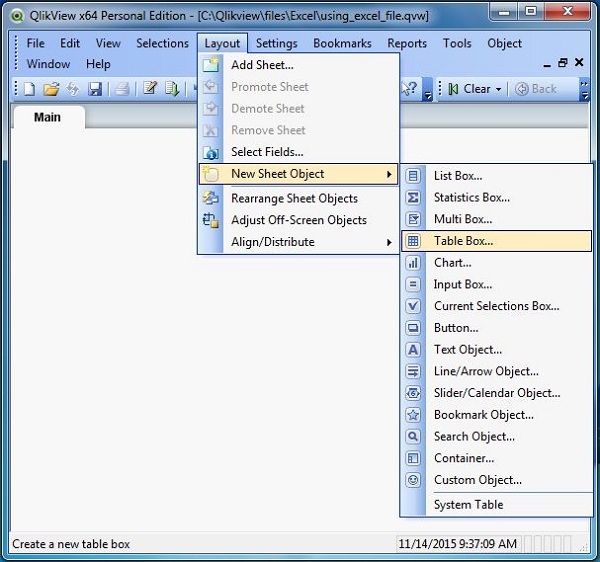
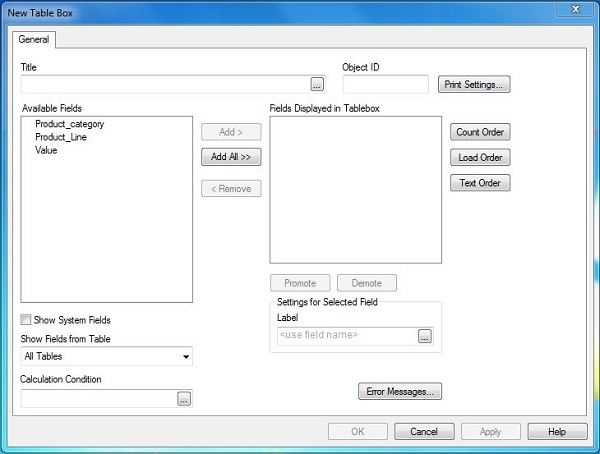
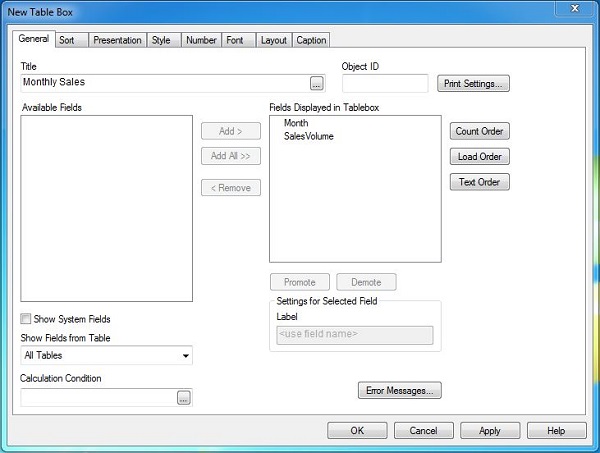
Create Table Box
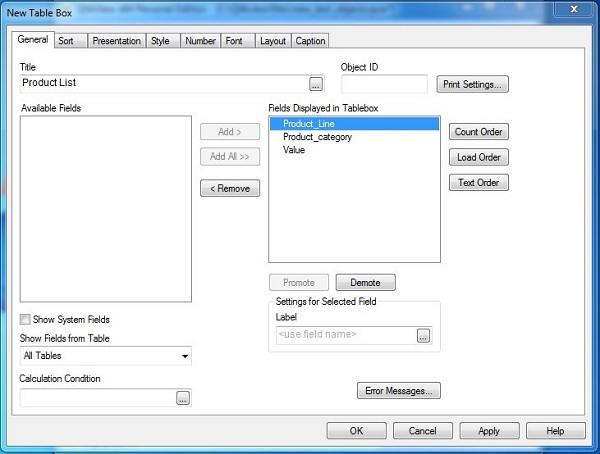
The Table Box is a sheet object to display the available data as a table. It is invoked from the menu Layout → New Sheet Object → Table Box.
On clicking Next, we get the option to choose the fields from the Table Box. You can use the Promote or Demote buttons to rearrange the fields.
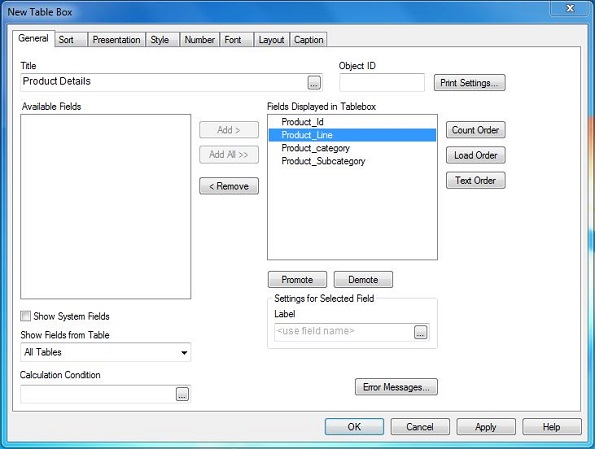
Table Box Data
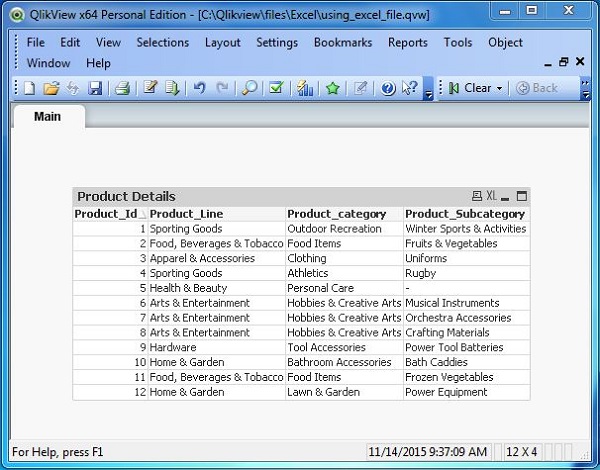
On completing the above step, the Table Box Sheet Object appears which shows the data that is read from the Excel file.
QlikView - Delimited File
QlikView can use the data in plane text file where the fields are separated by characters like comma, tab, semicolon etc. Here, we will take CSV as an example. A file in which each column of data is separated by a comma is known as a CSV file. It is a very widely used file format to store plane text-data organized as columns and rows.
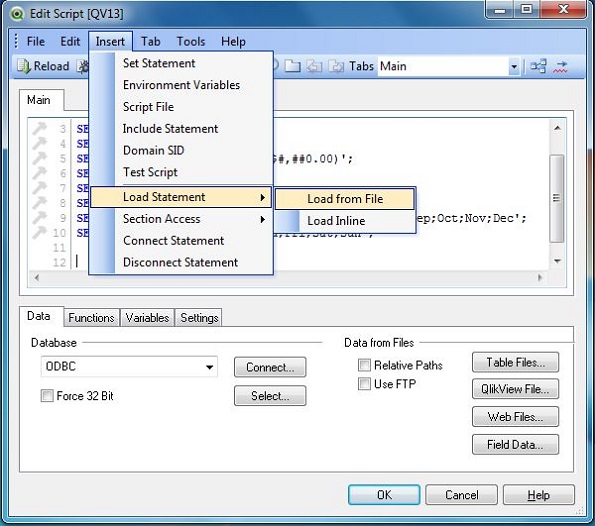
QlikView loads csv files using the Data from files options available in the script editor under the File Menu. Alternatively, you can also open a new QlikView document and press control+E to get the script editor window as shown below. Choose the file Product_details.csv from the appropriate path.
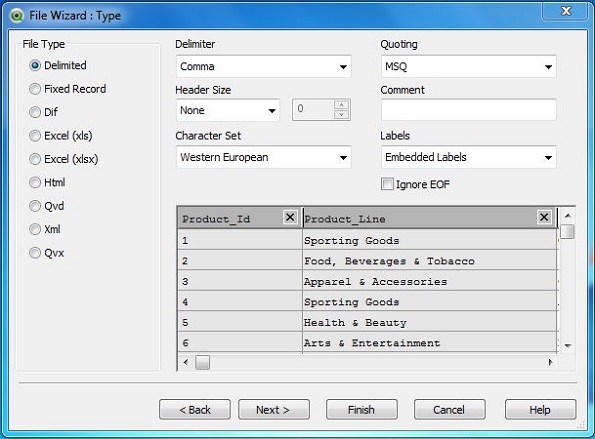
Select the File Headers
On opening the selected CSV file, a window as shown below comes up. Under Labels choose Embedded Labels, as our file has a header row as its first row. Click Finish.
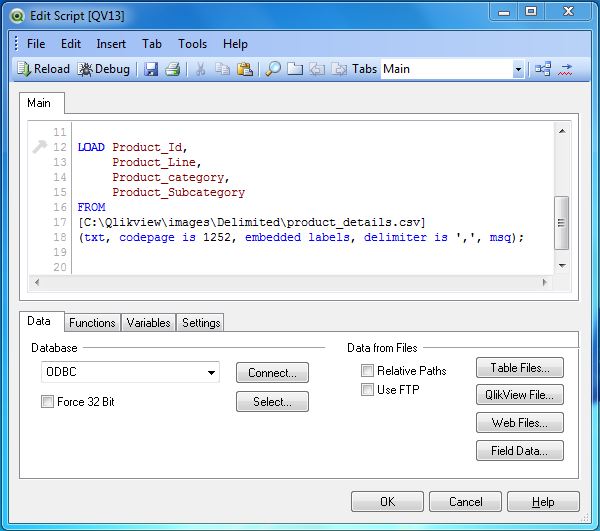
Load Script
The loading of the file into QlikView is done through the load script, which can be seen in the screen shot below. Hence, when we use any delimited file, we can tweak the below script as per the file format.
Now the script wizard prompts to save the file in the form of *.qvw file extension. It asks to select a location where you need to save the file. Click "Next step" to proceed. Now, it is time to see the data that is loaded from the delimited file. We use a Table Box sheet object to display this data.
Create Table Box
The Table Box is a sheet object to display the available data as a table. It is invoked from the menu Layout → New Sheet Object → Table Box.
On clicking Next, we get the option to choose the fields from the Table Box. You can use the Promote or Demote buttons to rearrange the fields.
Table Box Data
On completing the above step, the Table Box Sheet Object appears which shows the data that is read from the Excel file.
QlikView - XML File
XML is a file format, which shares both the file format and the data on the World Wide Web, intranets, and elsewhere using standard ASCII text. It stands for Extensible Markup Language (XML). Similar to HTML it contains markup tags. However, unlike HTML where the markup tag describes structure of the page, in XML the markup tags describe the meaning of the data contained into the file. QlikView can use the data from XML files.
The process to load the data from XML files is similar to the loading of delimited files we have seen earlier. Open the script editor. Click on the menu Insert → Load Statement → Load from File. Browse for the XML file you wish to load. In this example, we are choosing the employee_dat.xml file.

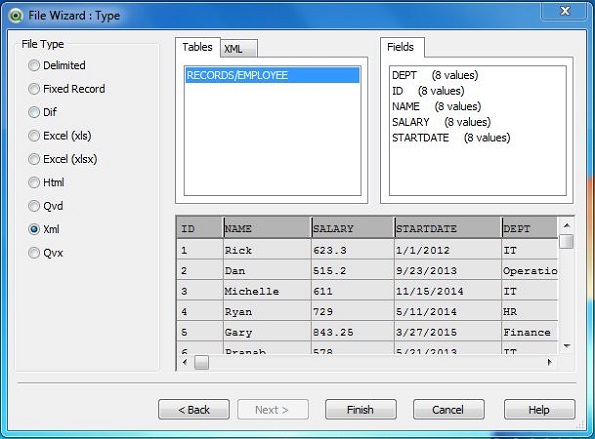
Select the XML File Structure
On opening the selected XML file, a window comes up as shown below. Under the File Type section in the left, choose XML. The content of the XML file now appears as a table along with the header column. Click Finish.
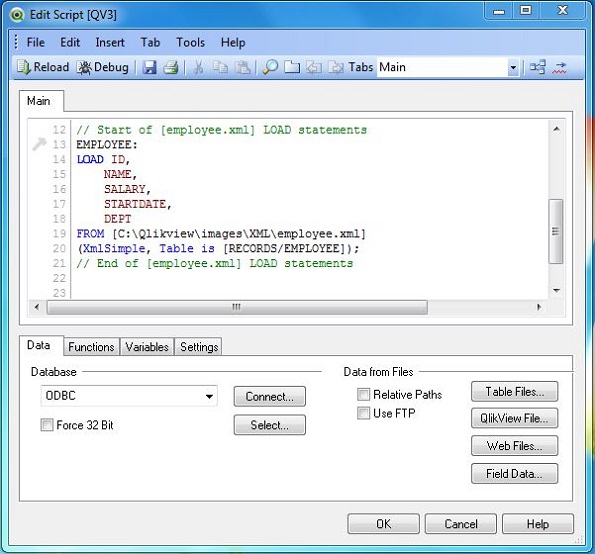
File Loader Script
The loading of the XML file into QlikView is done through the load script, which can be seen below. So when we use any XML file, we can tweak the below given script to rename the columns or change the file location etc.
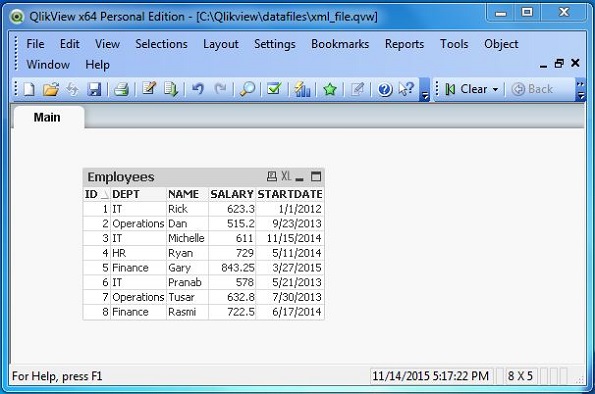
Now the script wizard prompts you to save the file in the form of *.qvw file extension. It asks to select a location where you need to save the file. Click "Next step" to proceed. Now it is time to see the data that is loaded from the XML file. We use a Table Box sheet object to display this data.
Create Table Box
The Table Box is a sheet object to display the available data as a table. It is invoked from the menu Layout → New Sheet Object → Table Box.

On clicking Next, we get the option to choose the fields from the Table Box. You can use the Promote or Demote buttons to rearrange the fields.
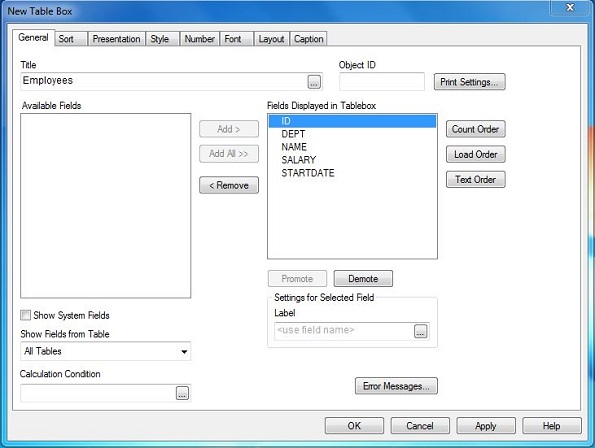
Table Box Data
On completing the above step, the Table Box Sheet Object appears which shows the data that is read from the Excel file.
QlikView - Web File
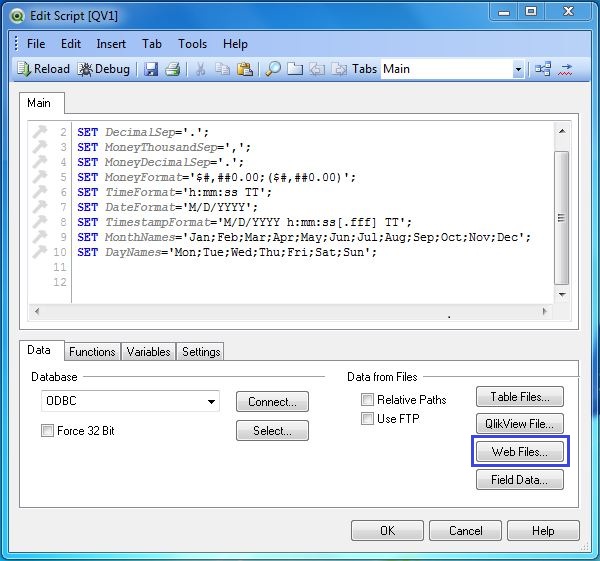
QlikView can process files from the web, which are in the HTML format. It can extract data from HTML tables. The URL of the web file to be processed is given as an input and QlikView fetches both, the structure and content of the file. Then it analyzes the structure of the page extracting the relevant data from the HTML tables present in the page. We choose the Web files option from the Data from files section under the Data tab of script Editor.
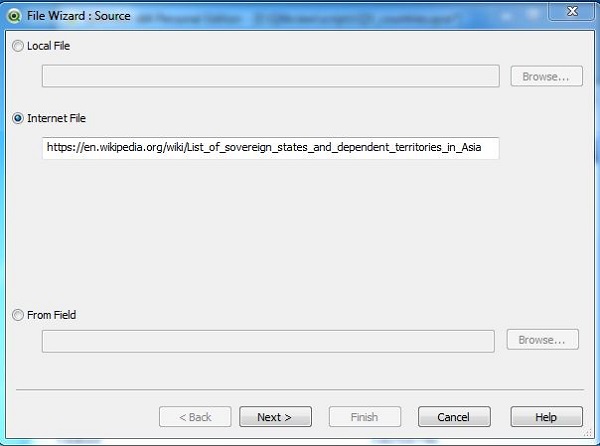
Give the URL as Input
On selecting the Web files option, we get a new window to give the URL as input. In this example, we are choosing the List of sovereign states and dependent territories in Asia as the input page from Wikipedia. Mention the URL and click Next.
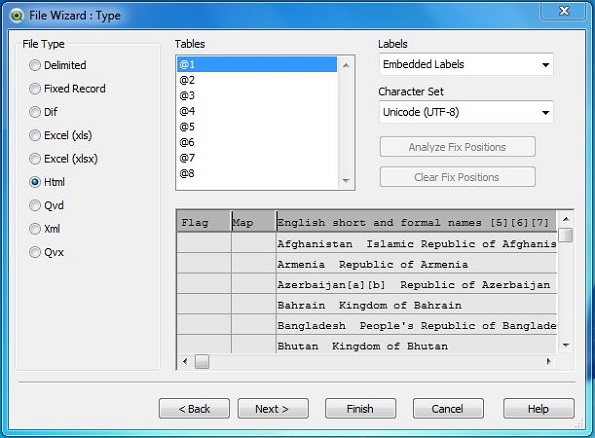
Select the Table from the Web File
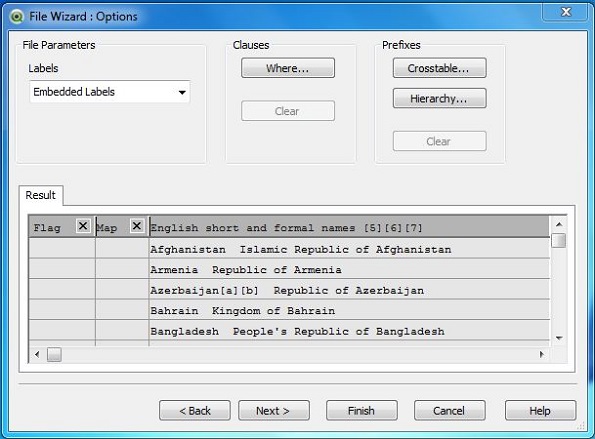
On opening the selected Web file, the window shown below comes up. Here we can see the various tables present in the webpage labeled as @1, @1, @3 and so on. Choose the first table and click Next twice.
Select the Columns of the Table
From the above table, we can choose only the columns we need by removing the unwanted columns using the cross sign.
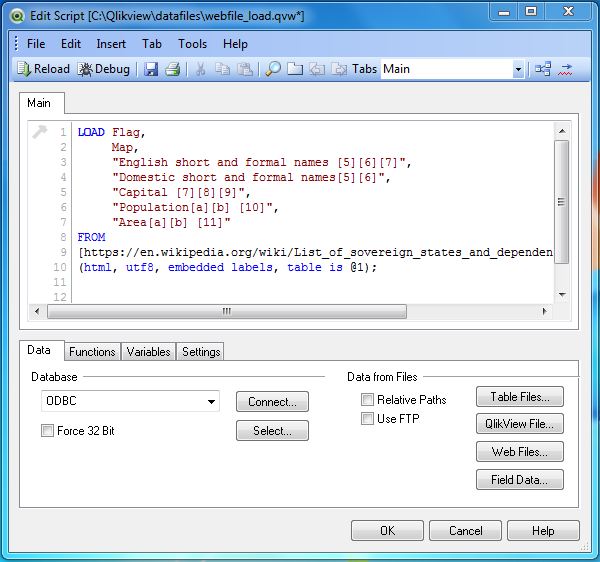
Load Script
The loading of the file into QlikView is done through the load script, which can be seen in the screen shot given below. Hence, when we use any delimited file, we can tweak the below given script as per the file format.
Now the script wizard prompts to save the file in the form of *.qvw file extension. It asks to select a location where you need to save the file. Click "Next step" to proceed. Now it is time to see the data that is loaded from the web file. We use a Table Box sheet object to display this data.
Create Table Box
The Table Box is a sheet object to display the available data as a table. It is invoked from
the menu Layout → New Sheet Object → Table Box.
On clicking Next, we get the option to choose the fields from the Table Box. You can use the Promote or Demote buttons to rearrange the fields.
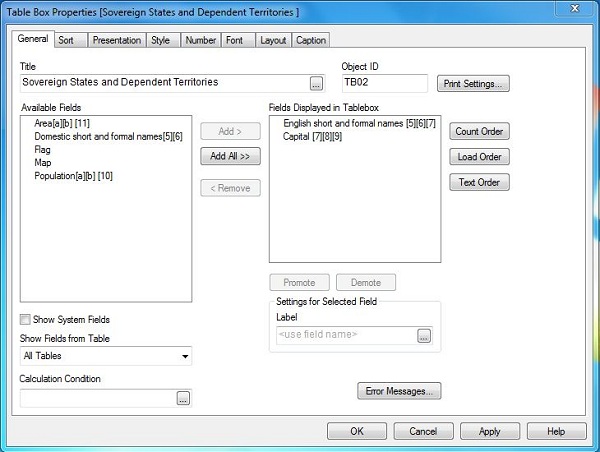
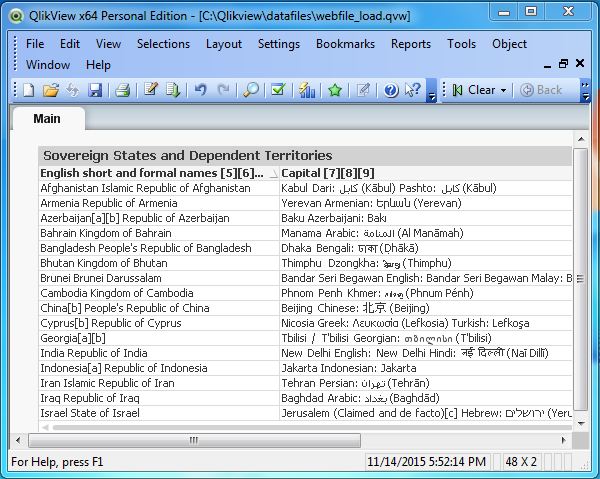
Table Box Data
On completing the above step, the Table Box Sheet Object appears, which shows the data that is read from the Web file. Mark the Non-English characters !!
QlikView - Database Connection
QlikView can connect to most of the popular databases like MySQL, SQL Server, Oracle, Postgress etc. It can fetch data and table structures into QlikView environment and store the results in its memory for further analysis. The steps to connect to any of these databases involves creating an ODBC connection using a DSN and then using this DSN to fetch the data.
For this tutorial, we will be connecting to MySQL database. This tutorial assumes you have a MySQL environment available. Create an ODBC DSN (Data Source Name) for MySQL, following these steps − to create DSN. Name the DSN as mysqluserdsn or you may prefer to use the existing one if you have already created a DSN for MySql.
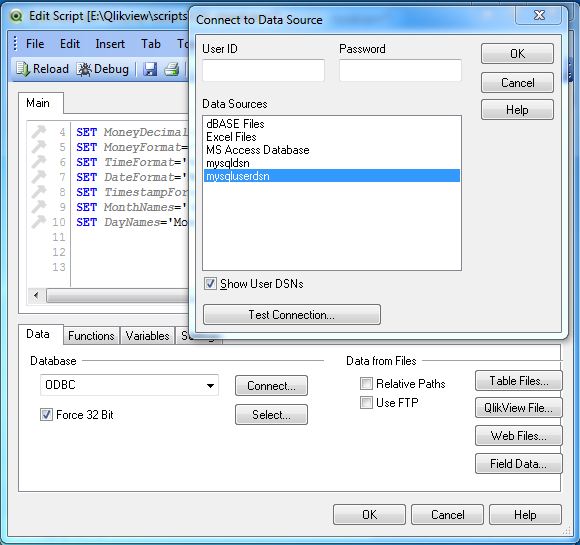
Connecting to the Database
For this chapter we will use the MySql inbuilt database named sakila. We create a new QlikView document and open the script editor (pressing Control+E). Under the tab Data, we locate the section named Database. Choose ODBC from the drop down list and click Connect. The following window opens. Choose the DSN named mysqluserdns and click Test Connection. The message Connection Test succeeded should appear.
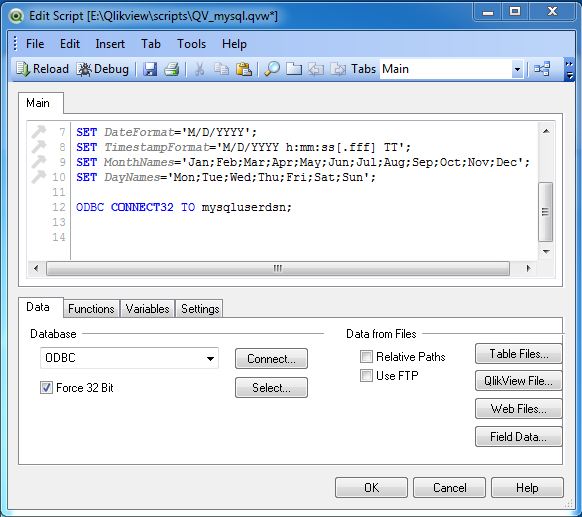
Verifying Connection to Database
On successful connection, the screen given below appears showing the connection to the DB in the main window of the script editor.
Select Database Table
Click Select iin the above window to get the list of tables and columns. Here as we have created the DSN with sakila as the default database we get the list of tables and columns from this database. We can choose another database from the database drop down list as shown in the screenshot given below. We will continue using the sakila database for this chapter.
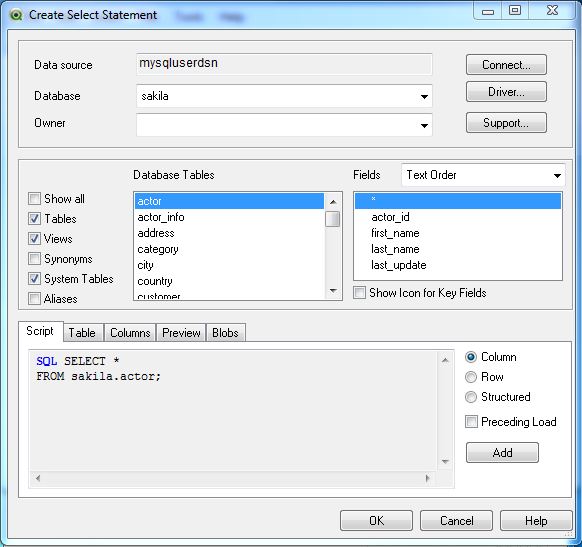
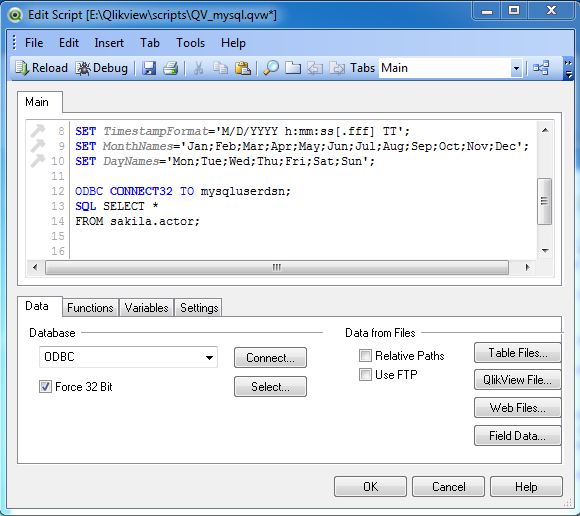
Table Loader Script
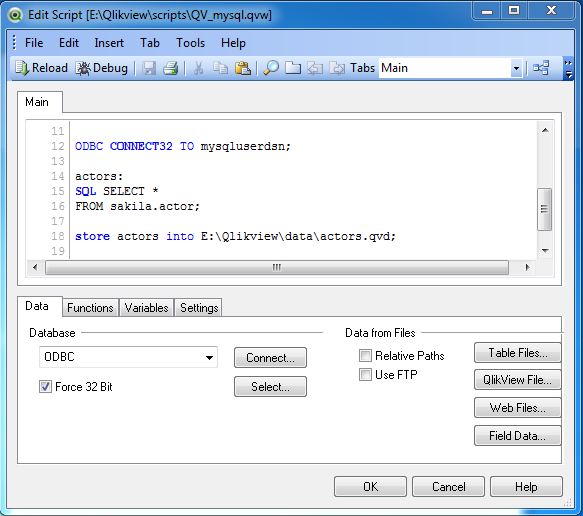
On Clicking OK in the above window, we get back to the main script editor showing the script for using the table named actor.
Showing the Result in qvd File
Now the data loaded into QlikView document needs to be stored permanently to be analyzed further. For this, we will edit the script to store the data in the form of a qvd file. Press Control+E to open the edit script window and write the following code.
In the code, we give appropriate names to the columns and mention the table name above the load statement. In addition, we give a path where the generated qvd file will be stored. Save this file as QV_mysql.qvw
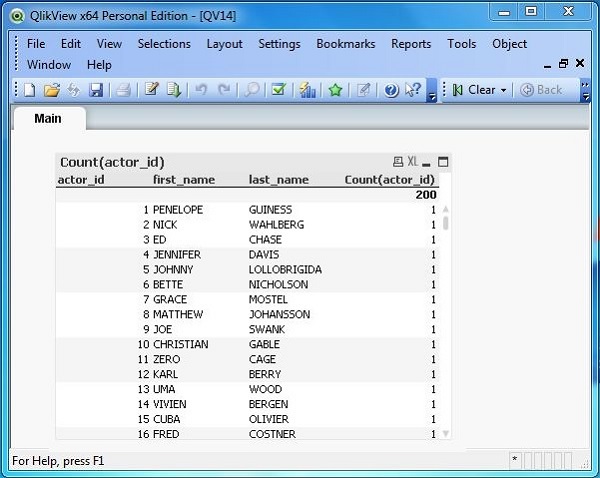
Using the qvd File
The qvd file can be loaded into the main document and used to create graphs and tables for further analysis. Press Control+R to reload the QV_mysql.qvw file and click Next in the chart wizard. Choose the straight table to be created with actor_id, first_name, last_name as the dimensions and count of actor_id as the expression. A chart appears as given below.
QlikView - Inline Data
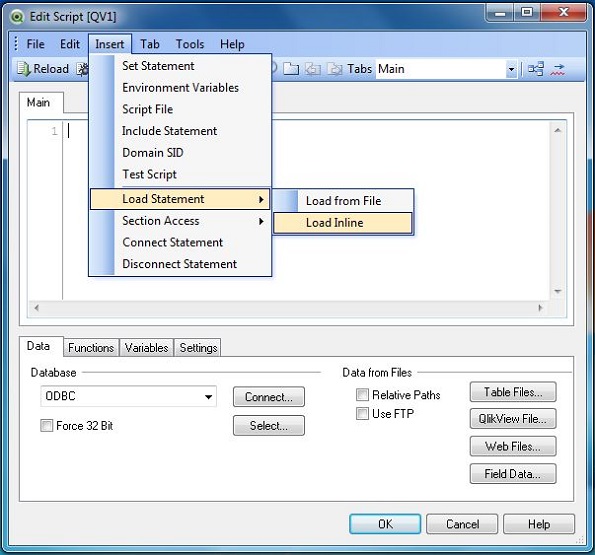
Data can be entered into a QlikView document by directly typing or pasting it. This feature is a quick method to get the data from the clipboard into the QlikView. The script editor provides this feature under the Insert tab.
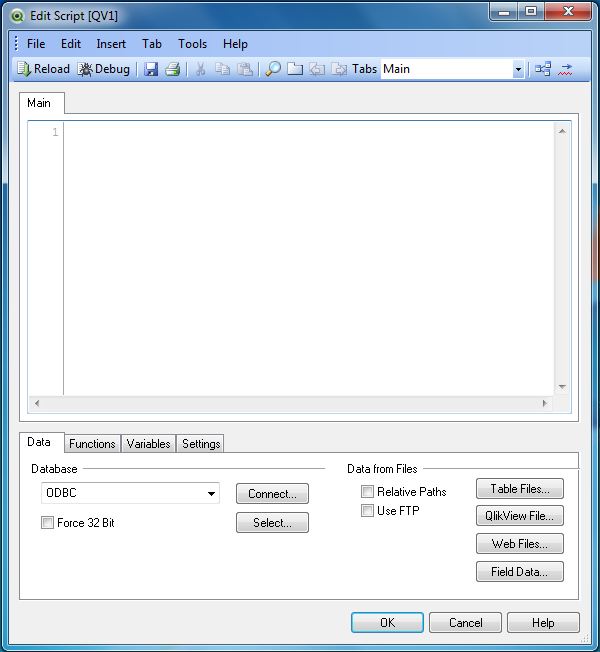
Script Editor
To open the Inline data load option, we open the script editor and go to Insert → Load Statement → Load Inline.
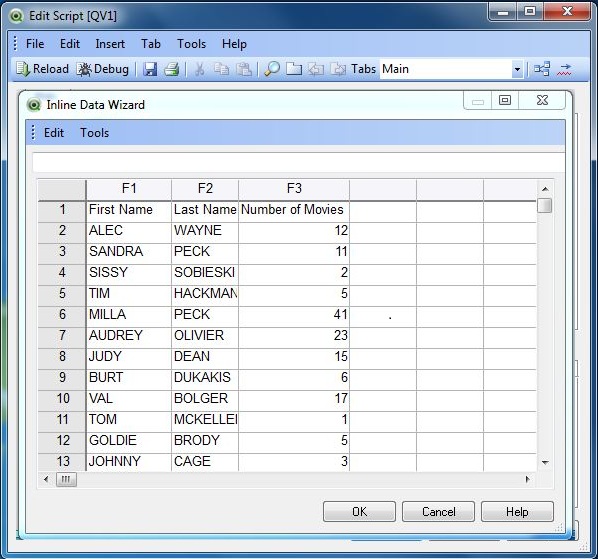
Inserting Data
On opening the above screen, we get a spreadsheet-like document where we can type the values. We can also paste the values already available in the clipboard. Please note the column headers are created automatically. Click Finish.
Load Script
The command, which loads the data, is created in the background which can be seen in the script editor.
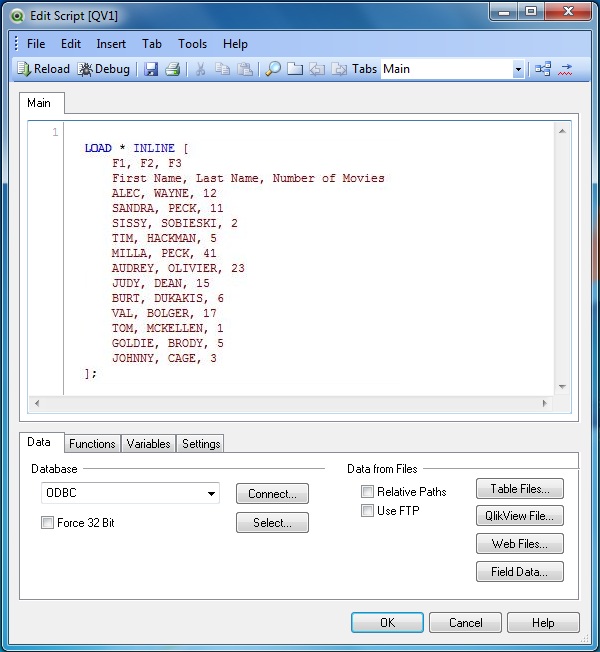
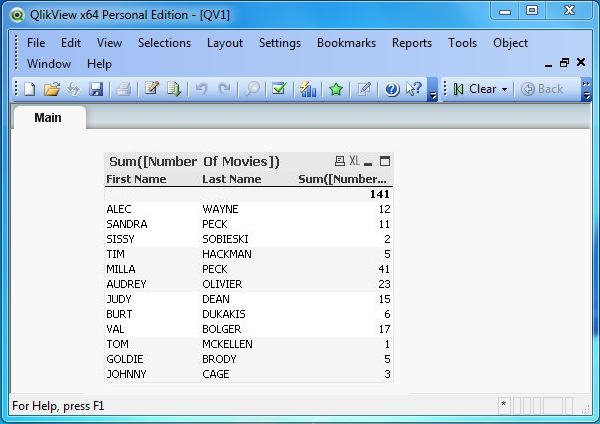
Table Box Data
On creating a Table Box Sheet Object, we see the data that is read from the Inline data load option.
QlikView - Resident Load
QlikView can load data from tables already existing in its RAM, which is already processed by a script. This requirement arises when you want to create a table deriving data from an already existing table in the same script. Please note that both the new table and the existing table should be in the same script.
Creating the Load Script
Open the script editor (or use Control+E) and mention the following script. Here we create an inline table named Regions with sales data for different regions. Then we create another table named Total to calculate the total sales by Region Names. Finally we drop the table Regions, as in this .qvw file we only need the table named Total for data analysis.
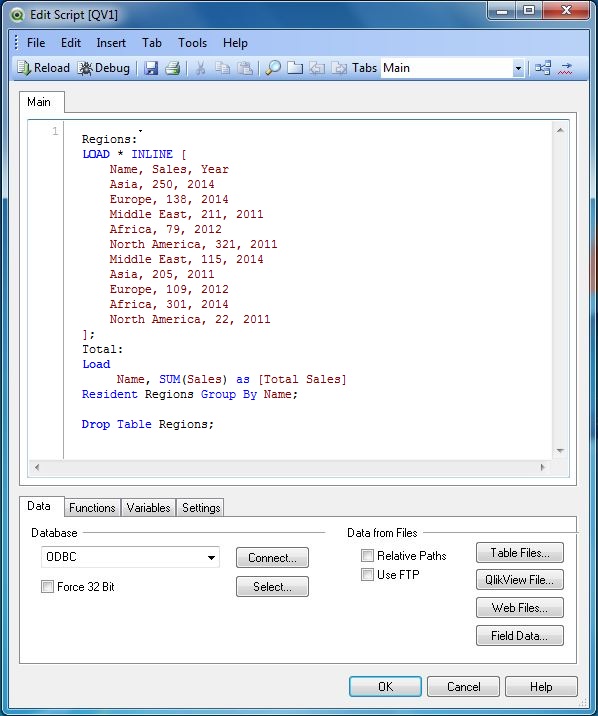
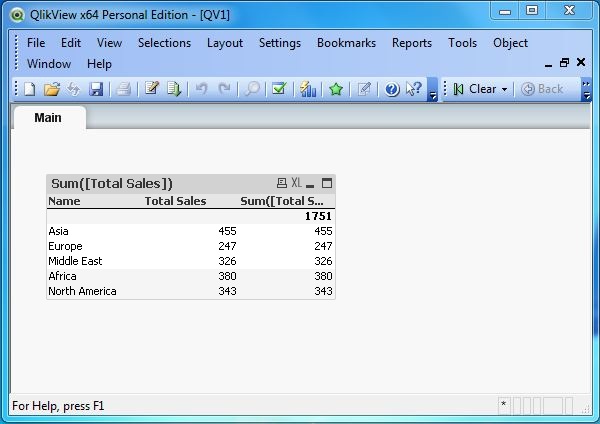
Table Box Data
On creating a Table Box Sheet Object, we see the data that is read from the resident data load option.
QlikView - Preceding Load
QlikView Preceding load is a load type in which we use a load statement, which takes the columns of another load statement present in the same script. The data read by the first Load statement, which is at the bottom of the script editor window and then used by the load statements above it.
Load Script
The below given screen shot shows the script for data, which is loaded as Inline data and then the max function is applied to one of the columns. The load statement at the bottom makes the data available in QlikView's memory, which is used by the second load statement above the first load statement. The second load statement applies the max function with group by clause.
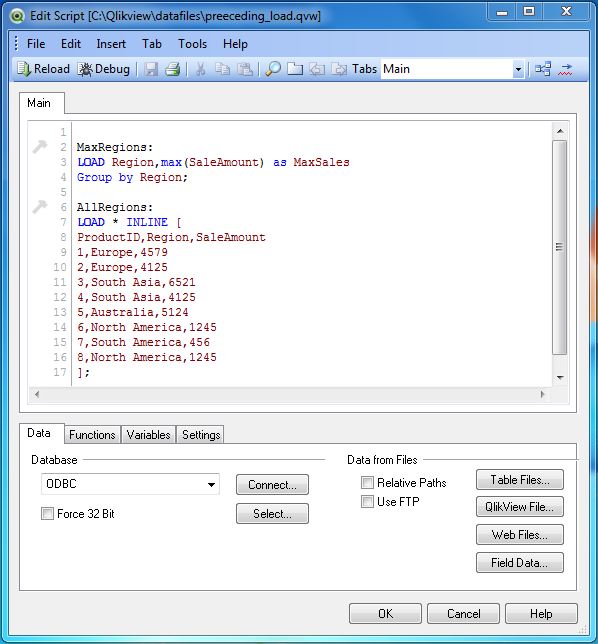
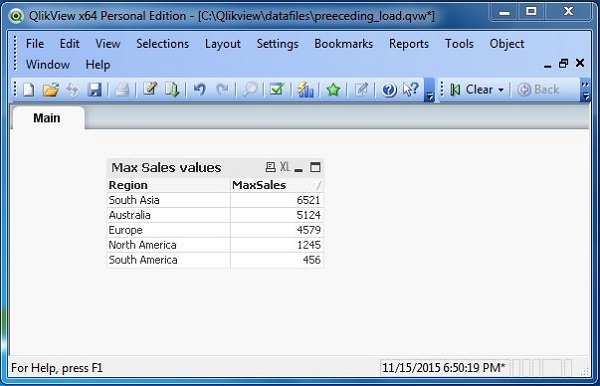
Table Box Data
On creating a Table Box Sheet Object, we see the data that is read from the Inline data load option.
QlikView - Incremental Load
As the volume of data in the data source of a QlikView document increases, the time taken to load the file also increases which slows down the process of analysis. One approach to minimize this time taken to load data is to load only the records that are new in the source or the updated ones. This concept of loading only the new or changed records from the source into the QlikView document is called Incremental Load.
To identify the new records from source, we use either a sequential unique key or a date time stamp for each row. These values of unique key or data time field has to flow from the source file to QlikView document.
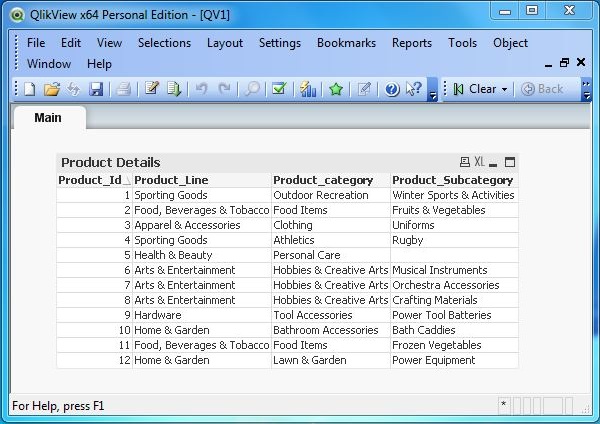
Let us consider the following source file containing product details in a retail store. Save this as a .csv file in the local system where it is accessible by QlikView. Over a period of time some more products are added and the description of some product changes.
Product_Id,Product_Line,Product_category,Product_Subcategory
1,Sporting Goods,Outdoor Recreation,Winter Sports & Activities
2,"Food, Beverages & Tobacco",Food Items,Fruits & Vegetables
3,Apparel & Accessories,Clothing,Uniforms
4,Sporting Goods,Athletics,Rugby
5,Health & Beauty,Personal Care
6,Arts & Entertainment,Hobbies & Creative Arts,Musical Instruments
7,Arts & Entertainment,Hobbies & Creative Arts,Orchestra Accessories
8,Arts & Entertainment,Hobbies & Creative Arts,Crafting Materials
9,Hardware,Tool Accessories,Power Tool Batteries
10,Home & Garden,Bathroom Accessories,Bath Caddies
11,"Food, Beverages & Tobacco",Food Items,Frozen Vegetables
12,Home & Garden,Lawn & Garden,Power Equipment
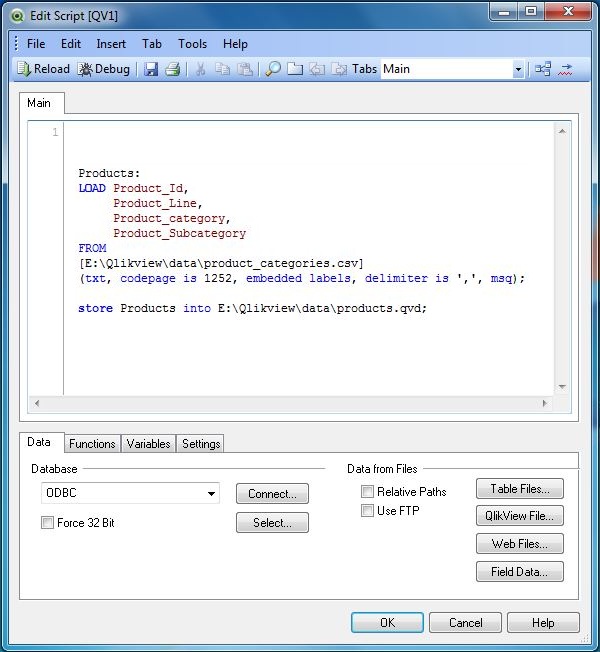
Loading the Data into QlikView
We will load the above CSV file using the script editor (Control+E) by choosing the Table Files option as shown below. Here we also save the data into a QVD file in the local system. Save the QlikView document as a .qvw file.
Verifying the Data Loaded.
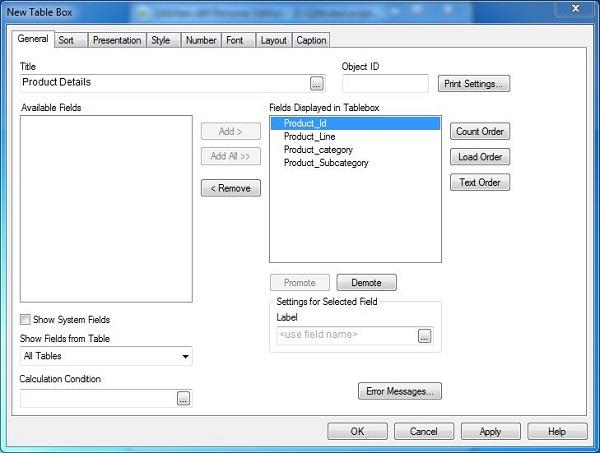
We can check the data loaded to QlikView document by creating a sheet object called Table Box. This is available in the Layout menu and New Sheet Objects sub-menu.
Creating the Table Layout
On selecting the Table Box sheet object, we get to the next screen, which is used to select the columns and their positions in the table to be created. We choose the following columns and their positions and click Finish.
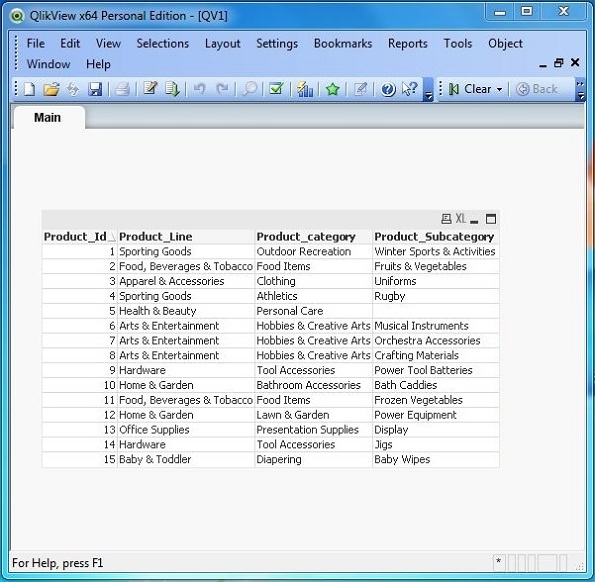
Viewing the Existing Data
The following chart showing the data as laid out in the previous step appears.
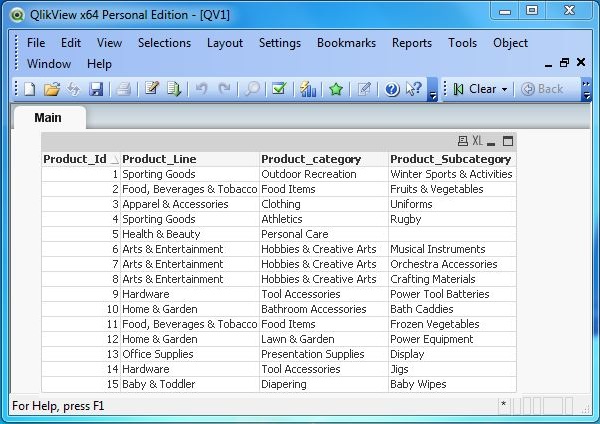
Updating the Source Data
Let us add the following three more records to the source data. Here, the Product IDs are the unique numbers, which represent new records.
13,Office Supplies,Presentation Supplies,Display
14,Hardware,Tool Accessories,Jigs
15,Baby & Toddler,Diapering,Baby Wipes
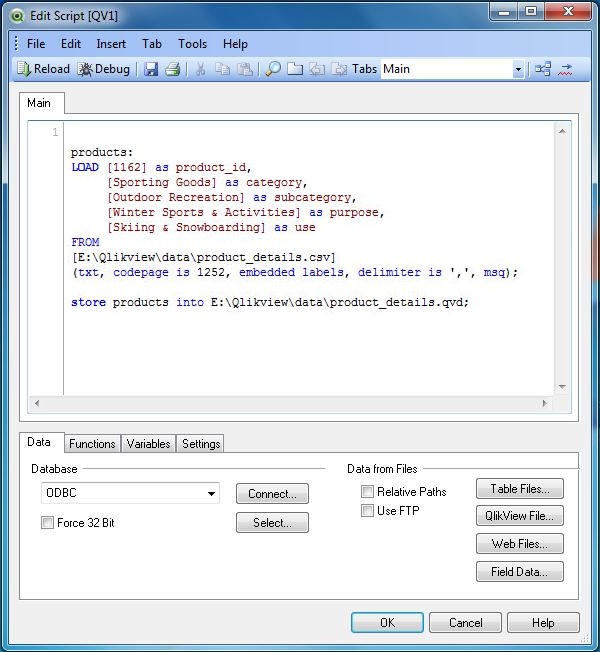
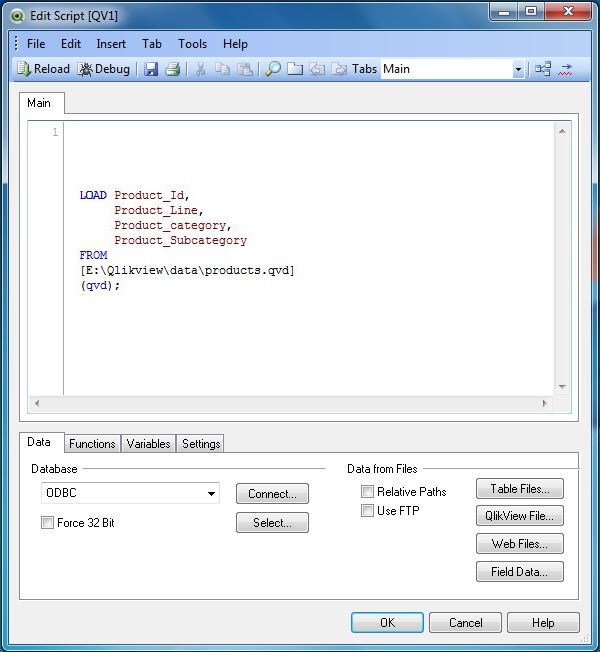
Incremental load script
Now, we write the script to pull only the new records form the source.
// Load the data from the stored qvd.
Stored_Products:
LOAD Product_Id,
     Product_Line,
     Product_category,
     Product_Subcategory
FROM
[E:\Qlikview\data\products.qvd]
(qvd);

//Select the maximum value of Product ID.
Max_Product_ID:
Load max(Product_Id) as MaxId
resident Stored_Products;

//Store the Maximum value of product Id in a variable.
Let MaxId = peek('MaxId',-1);

	 drop table Stored_Products;


//Pull the rows that are new.
NewProducts:
LOAD Product_Id,Product_Line, Product_category,Product_Subcategory
	 from [E:\Qlikview\data\product_categories.csv]
	 (txt, codepage is 1252, embedded labels, delimiter is ',', msq)
	 where Product_Id > $(MaxId);

//Concatenate the new values with existing qvd.
Concatenate
LOAD Product_Id,Product_Line, Product_category,
     Product_Subcategory
FROM [E:\Qlikview\data\products.qvd](qvd);

//Store the values in qvd.
store NewProducts into [E:\Qlikview\data\products.qvd](qvd);
The above script fetches only the new records, which are loaded and stored into the qvd file. As we see the records with the new Product IDs 13, 14 and 15.
QlikView - Data files (QVD)
One of the important features of QlikView, which makes it so distinguished is the ability to store very large amount of data in a very compressed size and store it along with the QlikView documents. Therefore, once the document is created we need not connect to the data source, as the data is already stored along with the layout of the document. This is achieved through QVD file, which is a flat file stored with the .qvd extension. A QVD file stores data for one QlikView document and it is created using the script editor available in the QlikView document.
Advantages of Using QVD Files
The advantages of using QVD files in QlikView are as follows −
- Faster Loading of Data
- Gracefully support scaling up as the data volume grows
- Used in incremental load
- Data from multiple sources can be clubbed to one data set
- Extract data in parallel
Creating QVD Files
QVD files are created using the STORE statement during the loading of QlikView files. This statement creates a single qvd file, which gets stored in the specified location as a file; separate than the QVW file through which it is created.
Given below is an example of storing the qvd file after the data is loaded into the QlikView document by reading a source file.
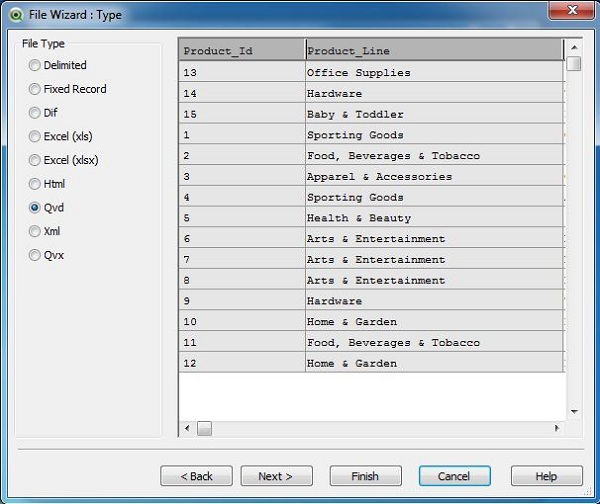
Using QVD Files
A QVD file is loaded to a QlikView document in a similar way as other files like CSV, Excel and delimited files are used. We use the the Open option available under the File menu and browse for the QVD file we created before. On opening it gives us a window to see the data, select the column headers and do any data transformation required
QVD File Loader Script
On clicking Finish, the edit script window appears which shows the code used to load the QVD file. We can edit this code further. For example, to get only the few of the columns to be displayed or apply any inbuilt function etc. Click finish to load the file into the current QlikView document. Save the QlikView document as use_qvd.qvw.
Displaying Data from QVD File
Reload the document by using Control+R and choose the menu option Layout → New Sheet Objects → Table Box. A window appears showing all the columns from the table present in the QVD file. Select "Add All" to add all the columns to the display table. Use the "Promote/Demote" option to change the order of the columns. Click "Finish". The following screen appears showing the content of the QVD file.
QlikView - Sheet and Objects
Every QlikView document is made of at least one worksheet called Main. We can add more sheets, which are like many pages of the same QlikView document. Sheets help us display multiple data formats like - multiple charts or multiple tables. Each sheet can contain various sheet objects. In addition, sheets can be rearranged using Promote Sheet/Demote Sheet option and can be removed from the QlikView document using Remove Sheet option.
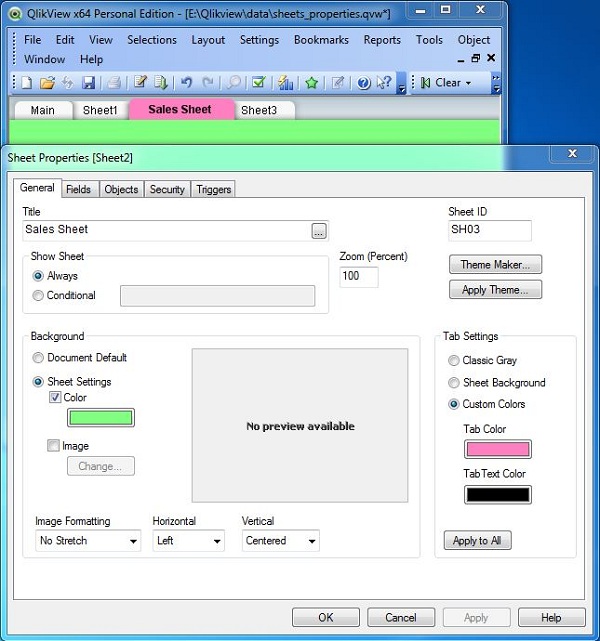
Sheet Properties
Sheets have various properties, which can be set to customize the sheets. For example, we can set the name of the sheets and its colors. Right click anywhere in the sheet and choose the Properties option. Then choose the following properties.
Sheet Settings → Color. − This will set the background colour of the Sheet.
Tab Settings → Custom Colors. − This will set the color for the Tab where the Sheet name appears.
Title. − This will set the name of the Sheet.
Creating Sheet Objects
Sheet Objects are the QlikView data elements that are embedded in the sheet. They display the data that is loaded into the QlikView's memory. Each sheet object is tied to a data source and one or more of its columns. Sheet Objects are created from the layout menu as shown below.
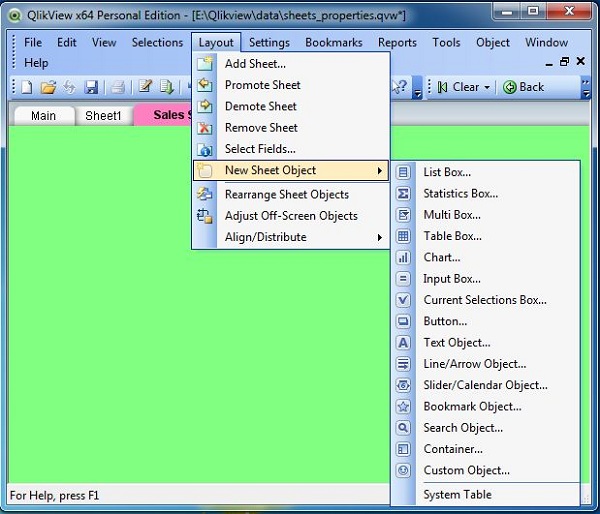
Using Sheet Objects
Sheet Objects display the data from a data source and all the objects in a sheet are associated with each other. Let's create a List Box and a Multi Box and see this association on action.
Creating List Box
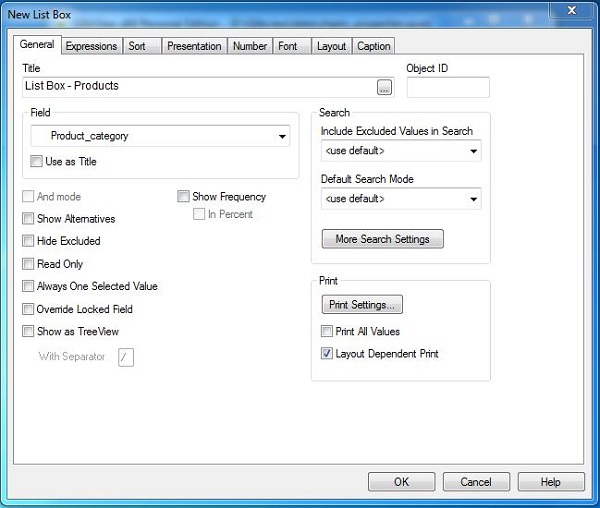
The List box displays data from a column of a table available in QlikView memory. Choose the option List Box from the Add Sheet Objects option and set the properties as given below.
Creating Multi Box
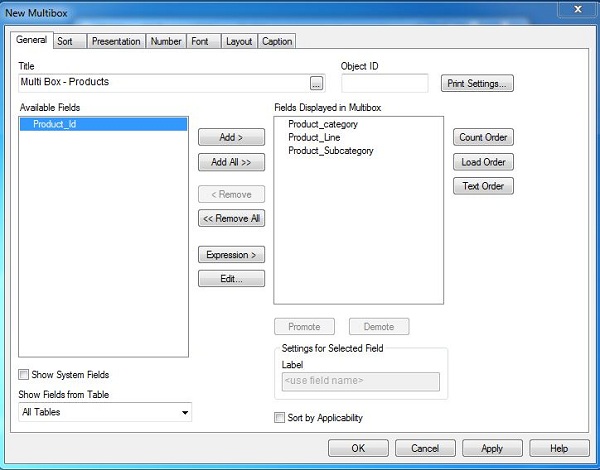
A Multi Box represents data from multiple columns from a table. Choose the option Multi Box from the Add Sheet Objects option and set the properties as shown below.
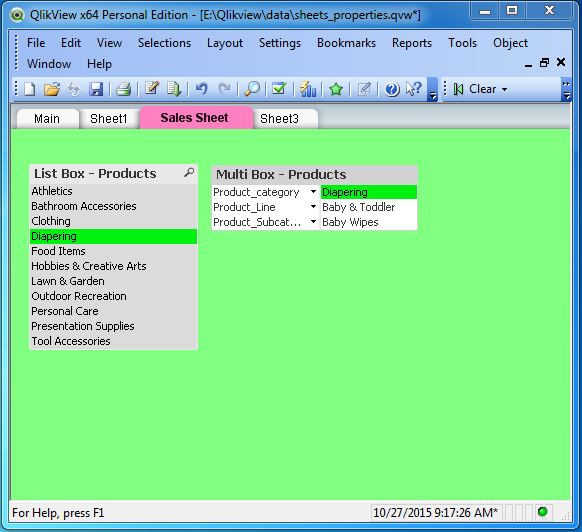
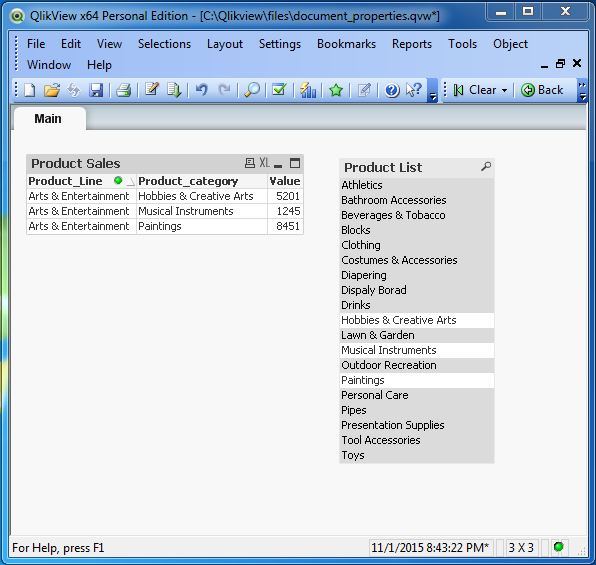
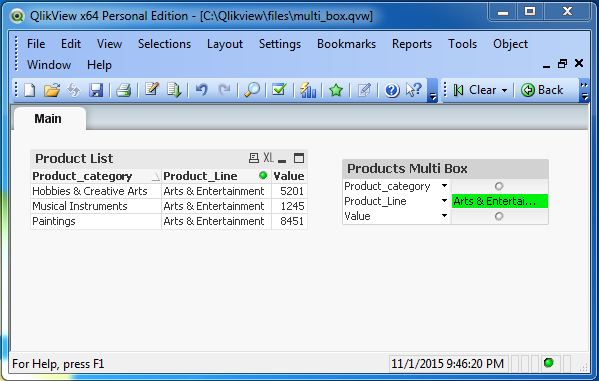
On completing the above given steps, the following window appears which shows both the objects.
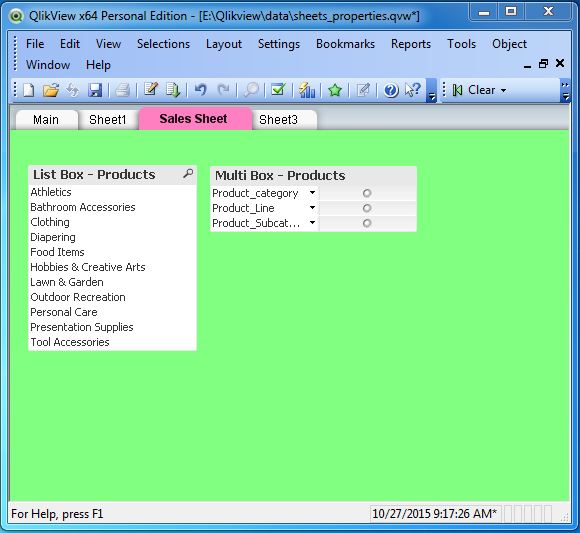
Association between Sheet Objects
We can see how the sheet objects are linked to each other by choosing the one option from the Multi Box, which highlights the associated row in the List Box. Let us choose "Diapering" under the Product Category drop down list in Multi Box. The window shown below appears.
QlikView - Scripting
Scripting is a very powerful feature in QlikView, which enables the control of the data load options and data transformations. It enables the use of many inbuilt functions available in QlikView and creates subroutines to be used across multiple scripts within a QlikViewdocument.
Scripting is done using the Script Editor. It is accessed from the File menu using Script Editor. We can also press Control +E to open the script editor window. It prepopulates some data formats that are set as default formats for the data to be processed. For example, the Thousand separator is a comma and date is in Month-day-year format. These can be changed to suit the incoming data as per the need.
Script Editor Features
Script editor has many features, which are accessed from the menu in the script editor window, which is a different menu from the main menu. Given below is a list of important features.
File Menu
Reload − Reloads the script and fetches the new data.
Upper/Lower Case − Converts the case of words as QlikView is case sensitive.
Comment − Used to comment blocks of code.
Edit Menu
Clear Entire Script − Clears the active script tab.
Open Script File − Opens the saved script files.
Table Viewer − Used to see the tabular view of the data being loaded.
Insert Menu
Environment Variables − Inserts a standard list of Environment variables.
Script Files − Allows to browse for script files and insert them.
Connect/Disconnect Statement − Used to connect or disconnect from external databases.
Tab Menu
Insert Tab − Inserts a Tab at the current cursor position.
Promote/Demote Tab − Allows to move the tabs from left to right and vice versa.
Merge with Previous − Used to merge the content of active tag with previous tab.
Tools Menu
ODBC Administrator 64 bit/ODBC Administrator 32 bit − Allows to set the correct DSN information for data sources.
Editor Preferences − Allows you to configure the text font and size, help features, shortcuts, default-scripting engine etc.
Syntax Check − Used to validate the syntax of the script code.
QlikView - Functions
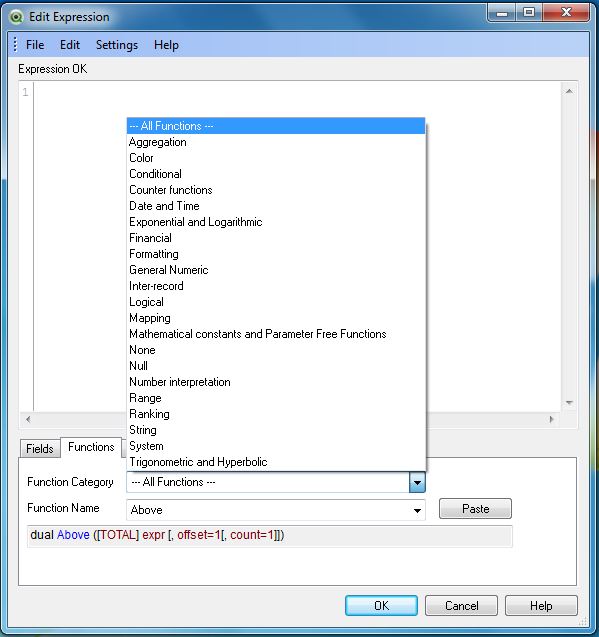
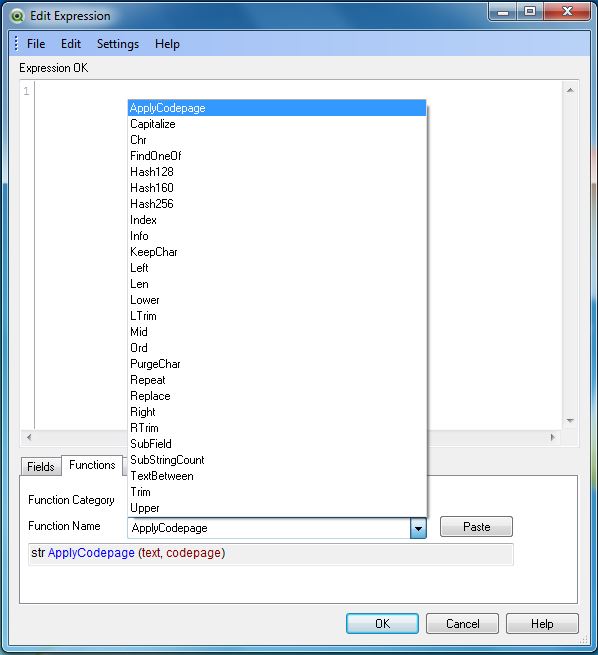
QlikView has many built-in functions, which are available to be applied to data that is already available in memory. These functions are organized into many categories and the syntax of the function appears as soon as it is selected. We can click on the Paste button to get the expression into the editor and supply the arguments.
Create Table Box
Create a Table Box by following the menu as shown in the screen shot given below.
On completing the above given step, we get a window to show the Calculation condition at the bottom left.
List of Functions
Click on the button next to calculation condition and go to the Function tab. It shows the list of functions available.
On choosing String from the functions category, we can see only few functions, which take a string as an argument.
In the next chapters, we will see the use of many important functions.
QlikView - IntervalMatch
QlikView IntervalMatch is a powerful function used to match distinct numeric values to numeric intervals. It is useful in analyzing how the events actually happened versus the planned events. The example of a scenario where it is used is in the assembly lines of the production houses where the belts are planned to run at certain times and for certain duration. However, the actual run can happen at different points in time because of breakdown etc.
Example
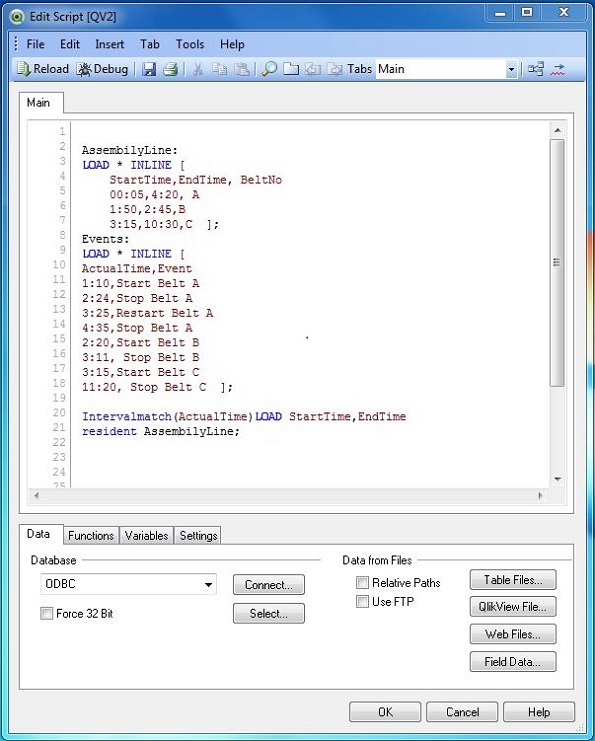
Consider an assembly line where there are three belts named A, B and C. They are planned to start & stop at specific times of a day. In a given day, we study the actual start and end time and analyze what all happened in that day. For this, we consider two sets of observations as shown below.
# Data Set for AssembilyLine.
StartTime,EndTime, BeltNo
00:05,4:20, A
1:50,2:45,B
3:15,10:30,C

# Data set for the events happened.
ActualTime,Product
1:10,Start Belt A
2:24,Stop Belt A
3:25,Restart Belt A
4:35,Stop Belt A
2:20,Start Belt B
3:11, Stop Belt B
3:15,Start Belt C
11:20, Stop Belt C
Creating the Script
We open the script editor in a new QlikView document using Control+E. The following code creates the required tables as inline data. After creating this script, press control+R to reload the data into the QlikView document.
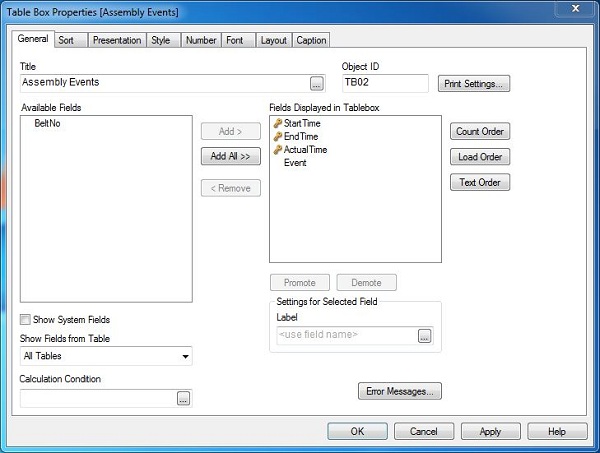
Creating Sheet Object
Let us create a Table Box sheet object to show the data generated by the IntervalMatch function. Go to the menu item Layout → New Sheet Object → Table Box. The following window appears in which we mention the Title of the table and select the required fields to be displayed.
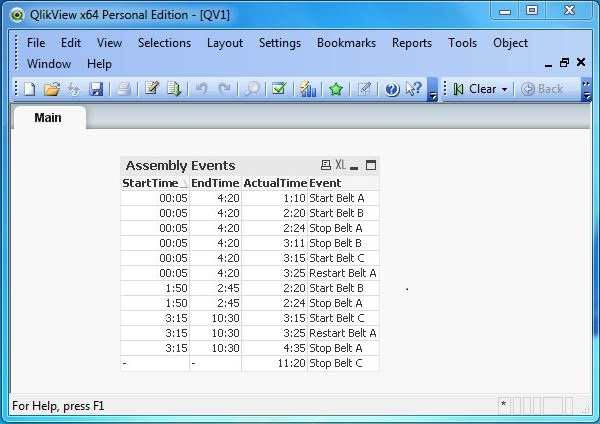
Showing the Table Box
On clicking OK in the above window, a table appears showing the field ActualTime matched to the intervals StartTime and EndTime.
QlikView - Aggregate Functions
QlikView Aggregate functions are used to produce aggregate data from the rows of the table. The functions are applied to the columns when creating the load script. Given below is a sample list of Aggregate functions. We also need to apply the Group by clause appropriately when applying the aggregate functions.
- SUM gives the sum of the numeric values of the column.
- AVG gives the average of the numeric values of the column.
- MAX gives the maximum of the numeric values of the column.
- MIN gives the minimum of the numeric values of the column.
Example
Consider the following data stored as product_sales.csv in the local system. It represents the sales figures for different product lines and product category in a store.
Product_Line,Product_category,Quantity,Value
Sporting Goods,Outdoor Recreation,12,5642
Food, Beverages & Tobacco,38,2514
Apparel & Accessories,Clothing,54,2365
Apparel & Accessories,Costumes & Accessories,29,4487
Sporting Goods,Athletics,11,812
Health & Beauty,Personal Care,21,6912
Arts & Entertainment,Hobbies & Creative Arts,58,5201
Arts & Entertainment,Paintings,73,8451
Arts & Entertainment,Musical Instruments,41,1245
Hardware,Tool Accessories,2,456
Home & Garden,Bathroom Accessories,36,241
Food,Drinks,54,1247
Home & Garden,Lawn & Garden,29,5462
Office Supplies,Presentation Supplies,22,577
Hardware,Blocks,53,548
Baby & Toddler,Diapering,19,1247
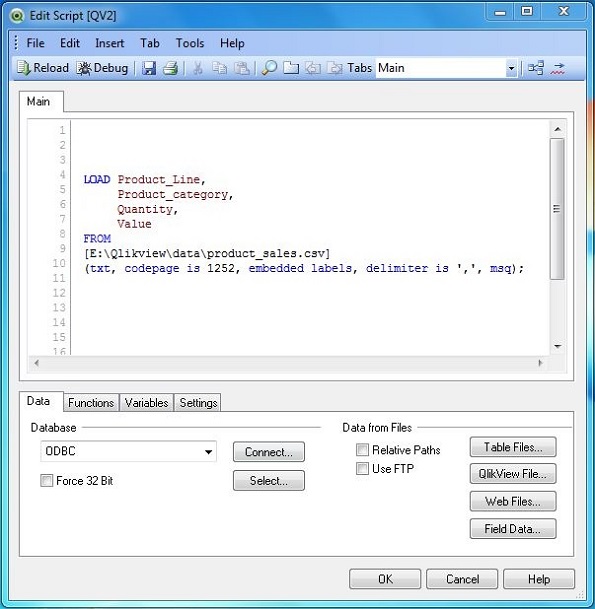
Creating the Load Script
We open the script editor in a new QlikView document using Control+E. The following code creates the required tables as inline data. After creating this script press control+R to reload the data into the QlikView document.
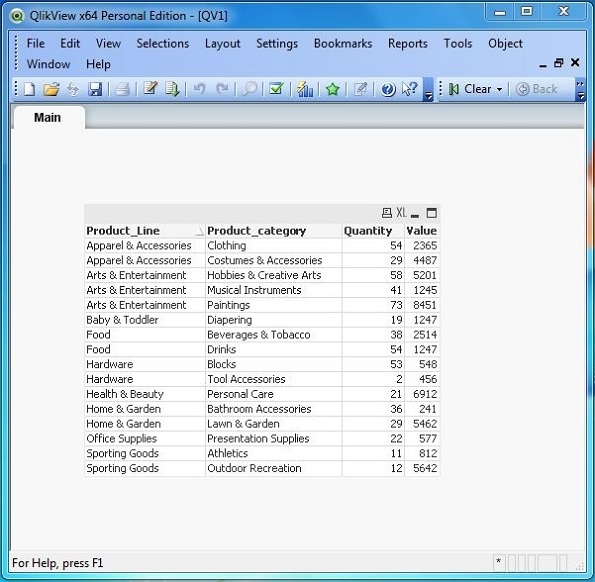
Creating Sheet Object
Let us create a Table Box sheet object to show the data generated by the Aggregate function. Go to the menu Layout → New Sheet Object → Table Box. The following window appears in which we mention the Title of the table and the select the required fields to be displayed. Clicking OK displays the data from the CSV file in the QlikView Table Box as shown below.
Applying SUM() function
Given below is the load script to find the sum of the sales quantity and sales value across the Product Lines and product categories.
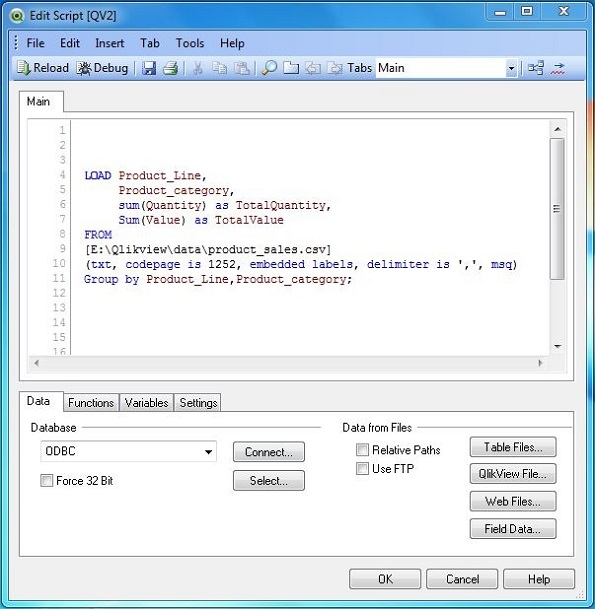
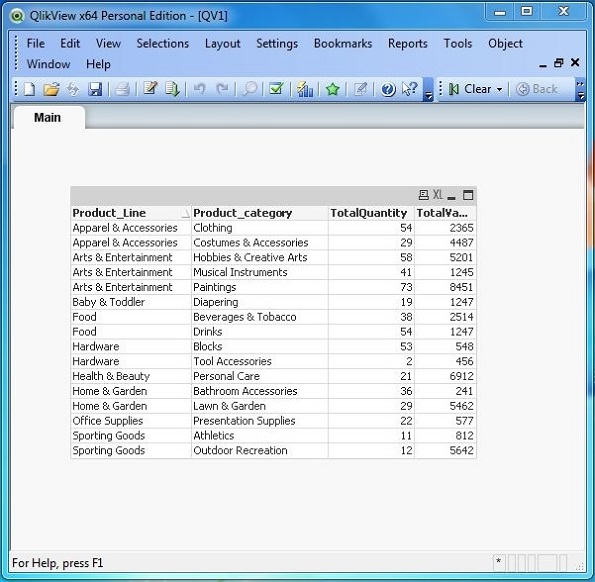
Click OK and press Control+R to reload the data into QlikView document. Now follow the same steps as given above in − Creating Sheet Objects to create a QlikView Table Box for displaying the result of the script as shown below.
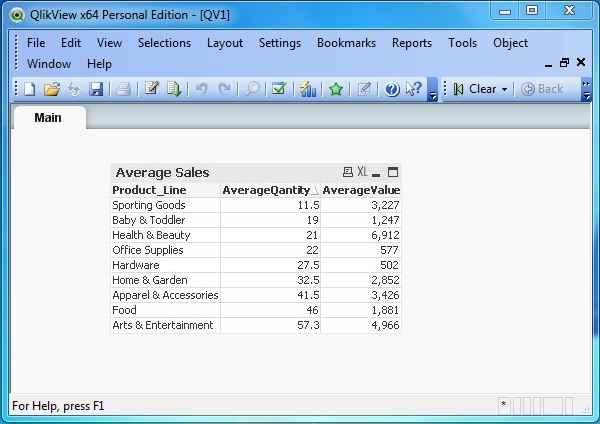
Applying AVG() function
Given below is the load script to create the average of the sales quantity and sales value across each Product Line.
# Average sales of Quantity and value in each Product Line.
LOAD Product_Line,
     avg(Quantity),
	 avg(Value)
FROM
[E:\Qlikview\data\product_sales.csv]
(txt, codepage is 1252, embedded labels, delimiter is ',', msq)
Group by Product_Line;
Click OK and press Control+R to reload the data into QlikView document. Now follow the same steps as given above in − Creating Sheet Objects to create a QlikView Table Box for displaying the result of the script as shown below.
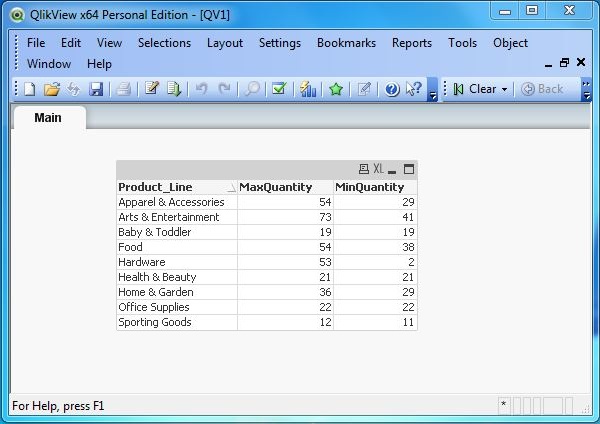
Applying MAX() & MIN() function
Given below is the load script to create the maximum and minimum of the sales quantity across each Product Line.
# Maximum and Minimum sales in each product Line.
LOAD Product_Line,
     max(Quantity) as MaxQuantity,
     min(Quantity) as MinQuantity
FROM
[E:\Qlikview\data\product_sales.csv]
(txt, codepage is 1252, embedded labels, delimiter is ',', msq)
Group by Product_Line;
Click OK and Control+R to reload the data into QlikView document. Now follow the same steps as above in − Creating Sheet Objects to create a QlikView Table Box for displaying the result of the script as shown below.
QlikView - Match Function
The Match() function in QlikView is used to match the value of a string on expression with data value present in a column. It is similar to the in function that we see in SQL language. It is useful to fetch rows containing specific strings and it also has an extension in form of wildmatch() function.
Let us consider the following data as input file for the examples illustrated below.
Product_Id,Product_Line,Product_category,Product_Subcategory
1,Sporting Goods,Outdoor Recreation,Winter Sports & Activities
2,Food, Beverages & Tobacco,Food Items,Fruits & Vegetables
3,Apparel & Accessories,Clothing,Uniforms
4,Sporting Goods,Athletics,Rugby
5,Health & Beauty,Personal Care
6,Arts & Entertainment,Hobbies & Creative Arts,Musical Instruments
7,Arts & Entertainment,Hobbies & Creative Arts,Orchestra Accessories
8,Arts & Entertainment,Hobbies & Creative Arts,Crafting Materials
9,Hardware,Tool Accessories,Power Tool Batteries
10,Home & Garden,Bathroom Accessories,Bath Caddies
11,Food, Beverages & Tobacco,Food Items,Frozen Vegetables
12,Home & Garden,Lawn & Garden,Power Equipment
13,Office Supplies,Presentation Supplies,Display
14,Hardware,Tool Accessories,Jigs
15,Baby & Toddler,Diapering,Baby Wipes
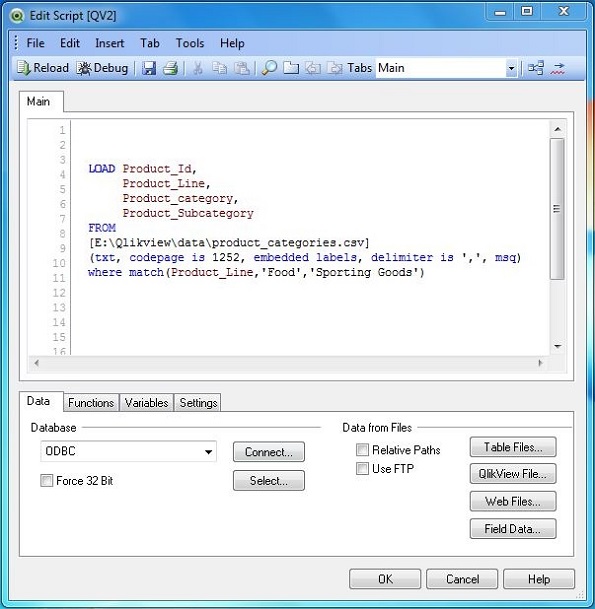
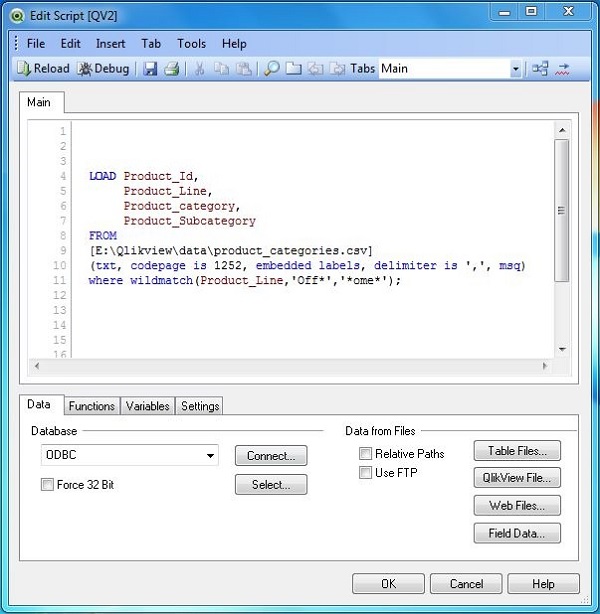
Load Script with Match() Function
The following script shows the Load script, which reads the file named product_categories.csv. We search the field Product_Line for values matching with strings 'Food' and 'Sporting Goods'.
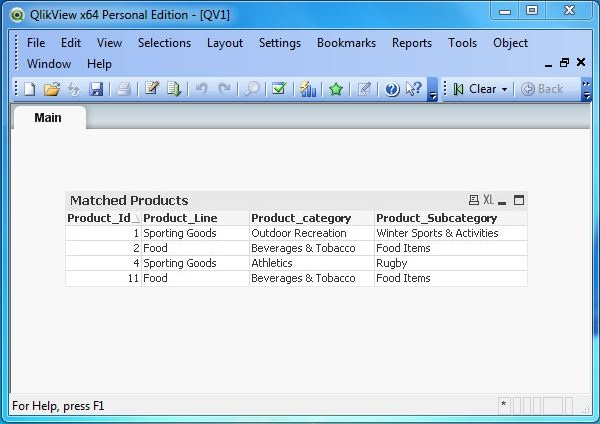
Creating Sheet Object
Let us create a Table Box sheet object to show the data generated by the match function. Go to the menu Layout → New Sheet Object → Table Box. The following window appears in which we mention the Title of the table and then select the required fields to be displayed. Clicking OK displays the data from the CSV file in the QlikView Table Box as shown below.
Load Script with Wildmatch() Function
The wildmatch() function is an extension of match() function in which we can use wildcards as part of the strings used to match the values with values in the fields being searched for. We search for the strings 'Off*','*ome*.
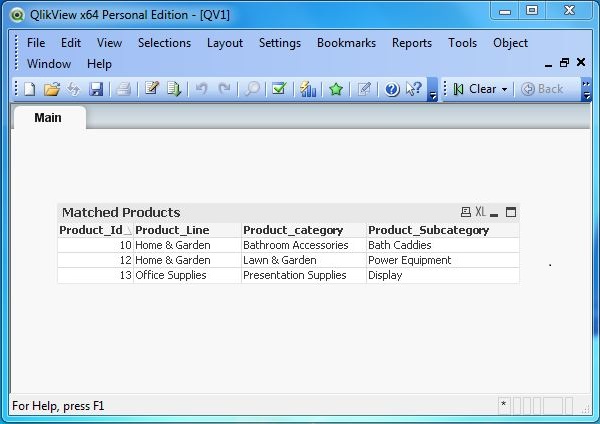
Creating Sheet Object
Let us create a Table Box sheet object to show the data generated by the wildmatch function. Go to the menu item Layout → New Sheet Object → Table Box. The following window appears in which we mention the Title of the table and then select the required fields to be displayed. Clicking OK displays the data from the CSV file in the QlikView Table Box as shown below.
QlikView - Rank Function
The Rank() function in QlikView is used to display the rank of the values in a field as well as return rows with specific rank value. So it is used in two scenarios. First scenario is in QlikView charts to display the ranks of the values in the field and second is in Aggregate function to display only the rows, which have a specific rank value.
Input Data
The data used in the examples describing Rank function is given below. You can save this as a .csv file in a path in your system where it is accessible by QlikView.
Product_Id,Product_Line,Product_category,Quantity,Value
1,Sporting Goods,Outdoor Recreation,12,5642
2,Food, Beverages & Tobacco,38,2514
3,Apparel & Accessories,Clothing,54,2365
4,Apparel & Accessories,Costumes & Accessories,29,4487
5,Sporting Goods,Athletics,11,812
6,Health & Beauty,Personal Care,21,6912
7,Arts & Entertainment,Hobbies & Creative Arts,58,5201
8,Arts & Entertainment,Paintings,73,8451
9,Arts & Entertainment,Musical Instruments,41,1245
10,Hardware,Tool Accessories,2,456
11,Home & Garden,Bathroom Accessories,36,241
12,Food,Drinks,54,1247
13,Home & Garden,Lawn & Garden,29,5462
14,Office Supplies,Presentation Supplies,22,577
15,Hardware,Blocks,53,548
16,Baby & Toddler,Diapering,19,1247
17,Baby & Toddler,Toys,9,257
18,Home & Garden,Pipes,81,1241
19,Office Supplies,Display Board,29,2177
Load Script
The above data is loaded to the QlikView memory by using the script editor. Open the Script editor from the File menu or press Control+E. Choose the Table Files option from the Data from Files tab and browse for the file containing the above data. Click OK and press Control+R to load the data into QlikView's memory.
Creating Chart with Rank() Function
Next, we follow the steps given below to create a chart, which shows the rank of the filed Value described with respect to the dimension Product_Line.
Select the Chart Type
Click on the Chart wizard and choose the option straight table as the chart type. Click Next.
Select the Chart Dimension
From the First Dimension drop down list, choose Product_Line as dimension. Click Next.
Define the Chart Expression
In the custom expression field, mention the rank expression as shown below. Here we are considering the numeric field named Value, which represents the Sales value for each category under each Product Line. Click Next.
Displaying the Chart
On clicking Finish in the above step, the following chart appears which shows the rank of the sales value of each Product Line.
Using Aggregate Function with Rank
The aggregate functions like − max, min etc. can take rank as an argument to return rows satisfying certain rank values. We consider the following expression to be out in the script editor, which will give the rows containing highest sales under each Product line.
# Load the records with highest sales value for each product line.
LOAD Product_Line,
     max(Value,1)
FROM
[E:\Qlikview\data\product_sales.csv]
(txt, codepage is 1252, embedded labels, delimiter is ',', msq)
group by Product_Line;
Creating Sheet Object
Let us create a Table Box sheet object to show the data generated by the above given script. Go to the menu Layout → New Sheet Object → Table Box. The following window appears in which we mention the Title of the table and select the required fields to be displayed. Clicking OK displays the data from the CSV file in the QlikView Table Box as shown below.
QlikView - Peek Function
The peek() function in QlikView is used to fetch the value of a field from a previous record and use it in calculations.
Input Data
Let us consider the monthly sales figure as shown below. Save the data with file name monthly_sales.csv.
Month,Sales Volume
March,2145
April,2458
May,1245
June,5124
July,7421
August,2584
September,5314
October,7846
November,6532
December,4625
January,8547
February,3265
Load Script
The above data is loaded to QlikView memory by using the script editor. Open the Script editor from the File menu or press Control+E. Choose the Table Files option from for the file containing the above data. Edit the load script to add the following code. Click OK and click Control+R to load the data into QlikView's memory.
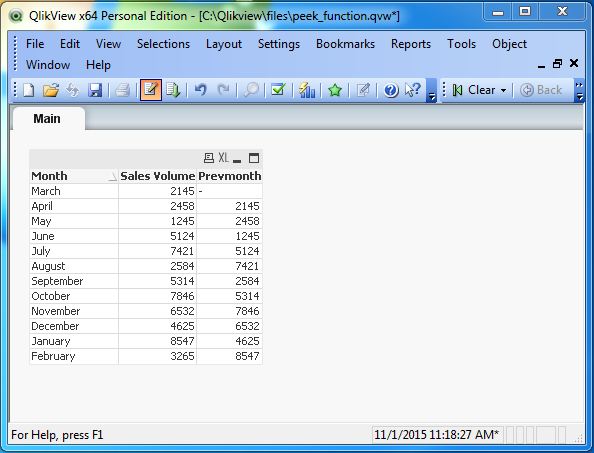
LOAD Month,
     [Sales Volume],
     peek('Sales Volume') as Prevmonth
FROM
[C:\Qlikview\data\monthly_sales.csv]
(txt, codepage is 1252, embedded labels, delimiter is ',', msq);
Creating Sheet Object
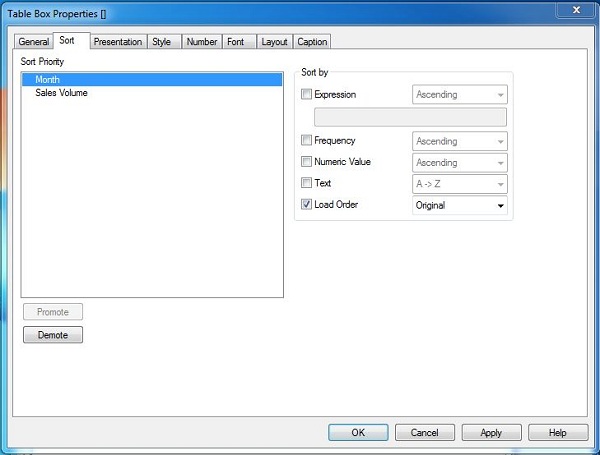
Let us create a Table Box sheet object to show the data generated by the above script. Go to the menu item Layout → New Sheet Object → Table Box. The following window appears in which we mention the Title of the table and select the required fields to be displayed. Clicking OK displays the data from the csv file in the QlikView Table Box as shown below. Also set the sort order as shown below to get the result in the same order of the field Month as it is in the source.
On completing the above steps and clicking Finish, we get the Table box showing the data as given below.
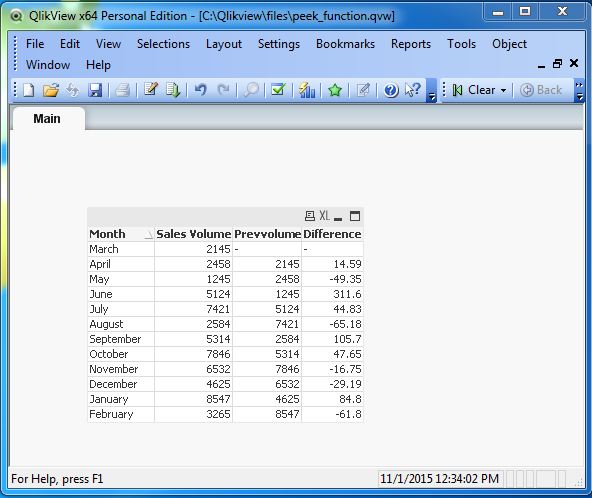
Using peek() Function in Calculations
The peek() can be used in calculations involving other columns. Let us display the percentage change for sales volume for each month. The following script achieves this result.
LOAD
Month, [Sales Volume],
peek('Sales Volume') as Prevvolume,
(([Sales Volume]-peek('Sales Volume')))/peek('Sales Volume')*100  as Difference
FROM
[C:\Qlikview\data\monthly_sales.csv]
(txt, codepage is 1252, embedded labels, delimiter is ',', msq);
Creating Sheet Object
Let us create a Table Box sheet object to show the data generated by the above script. Go to the menu item Layout → New Sheet Object → Table Box. The following window appears in which we mention the Title of the table and select the required fields to be displayed. Clicking OK displays the data from the CSV file in the QlikView Table Box as shown below.
QlikView - RangeSum Function
The RangeSum() function in QlikView is used to do a selective sum on chosen fields which is not easily achieved by the sum function. It can take expressions containing other functions as its arguments and return the sum of those expressions.
Input Data
Let us consider the monthly sales figure as shown below. Save the data with file name monthly_sales.csv.
Month,Sales Volume
March,2145
April,2458
May,1245
June,5124
July,7421
August,2584
September,5314
October,7846
November,6532
December,4625
January,8547
February,3265
Load Script
The above data is loaded to QlikView memory by using the script editor. Open the Script editor from the File menu or press Control+E. Choose the Table Files option from the Data from Files tab and browse for the file containing the above data. Edit the load script to add the following code. Click OK and click Control+R to load the data into QlikView's memory.
LOAD
Month, [Sales Volume]
FROM
[C:\Qlikview\data\monthly_sales.csv]
(txt, codepage is 1252, embedded labels, delimiter is ',', msq);
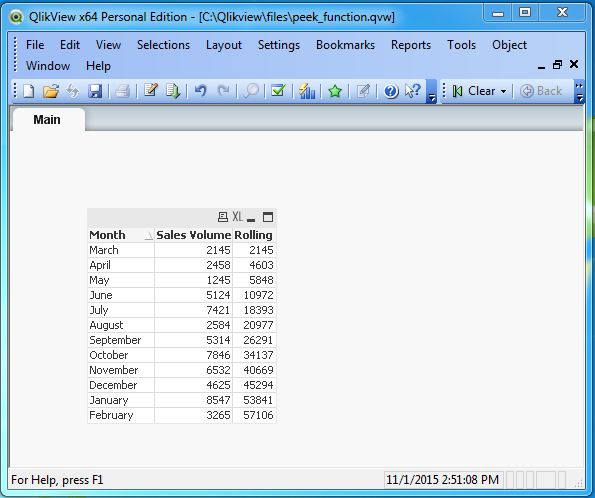
Applying RangeSum() Function
With the above data loaded into QlikView's memory, we edit the script to add a new column, which will give a rolling sum of the month wise sales volume. For this, we also take the help of the peek function discussed in the earlier chapter to hold the value of the previous record and add it to the sales volume of the current record. The following script achieves the result.
LOAD
Month, [Sales Volume],
rangesum([Sales Volume],peek('Rolling')) as Rolling
FROM
[C:\Qlikview\data\monthly_sales.csv]
(txt, codepage is 1252, embedded labels, delimiter is ',', msq);
Creating Sheet Object
Let us create a Table Box sheet object to show the data generated by the above given script. Go to the menu Layout → New Sheet Object → Table Box.
The following window appears in which we mention the Title of the table and select the required fields to be displayed. Clicking OK displays the data from the CSV file in the QlikView Table Box as shown below.
QlikView - Documents
QlikView documents are the files that contain all the objects used for the data presentation and analysis. It contains the sheets, variables, data model, source-data connection details, and even the data that is loaded after pulling it from the source.
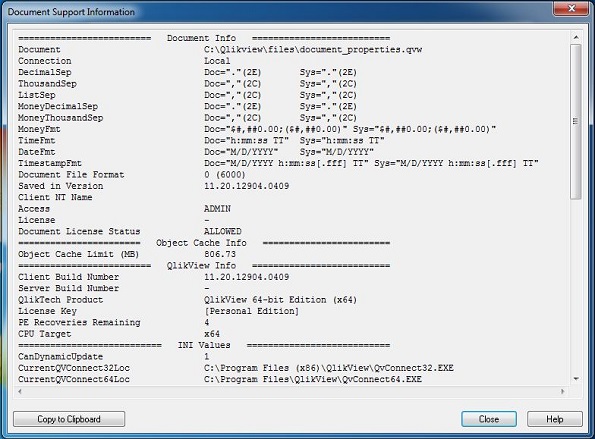
Document Properties
We can quickly find out the basic information of a QlikView document. Click on Help → document Support Info. Given below is a sample output.
Setting Document Background Image
We can set an image as the background image for a document using the check box Wallpaper Image check box under the General tab. We choose an image and align it at the left top position using the dropdown buttons.
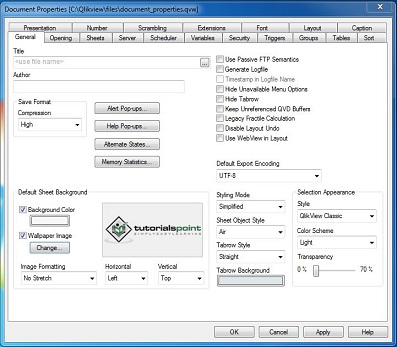
The following screen appears on selecting the above options.
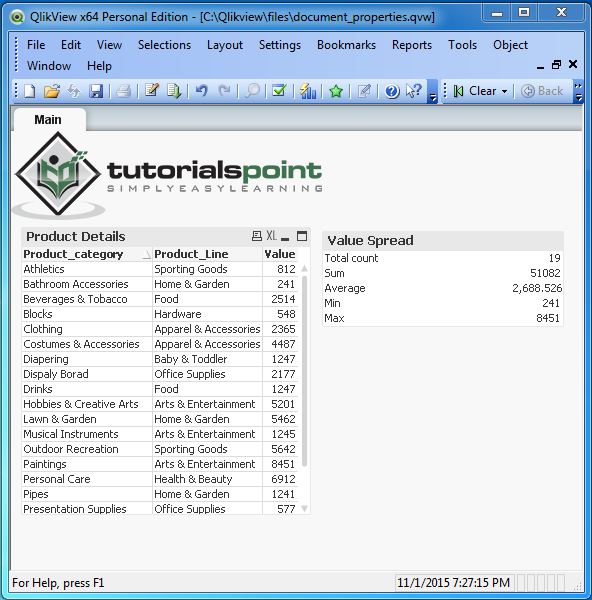
Sheet Objects
The QlikView document contains various Sheet objects, which can be moved around by dragging them and placed anywhere in the document. Let us create two sheet objects, a Table box and a Statistics Box. You can follow the earlier chapters where we have already learnt to create sheet objects. In addition, we are using the file Product_sales.csv, which is mentioned here.
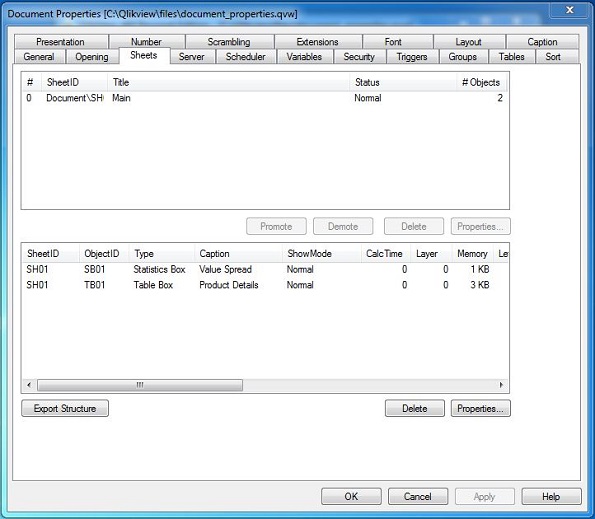
Details of the Sheets objects can be seen using the "Sheets" tab. It shows all the sheets contained in the document and for each sheet, the sheet objects are shown. Both the sheets and sheet objects have unique IDs. We can also edit various properties of these objects from this tab itself.
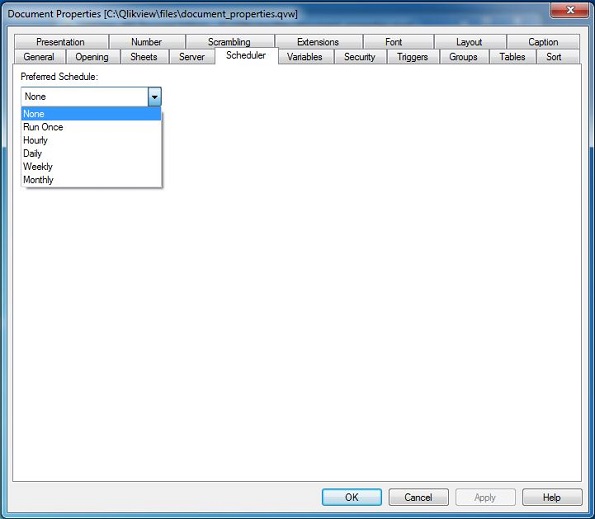
Scheduling a Document
A QlikView document can be scheduled to refresh at some desired intervals. This is done using the Schedule tab available under the Document properties window.
QlikView - List Box
A list box represents the list of all the values of a specific field. Selecting a value in list box highlights the related values in other sheet objects. This helps in faster visual analysis. It is also very useful to follow a drill down path among various sheet objects. It also has a search feature, which allows to search for specific values in the list box which is very helpful for a very long list of values.
Input Data
Let us consider the following input data, which represents the sales figure of different product lines and product categories.
Product_Line,Product_category,Value
Sporting Goods,Outdoor Recreation,5642
Food, Beverages & Tobacco,2514
Apparel & Accessories,Clothing,2365
Apparel & Accessories,Costumes & Accessories,4487
Sporting Goods,Athletics,812
Health & Beauty,Personal Care,6912
Arts & Entertainment,Hobbies & Creative Arts,5201
Arts & Entertainment,Paintings,8451
Arts & Entertainment,Musical Instruments,1245
Hardware,Tool Accessories,456
Home & Garden,Bathroom Accessories,241
Food,Drinks,1247
Home & Garden,Lawn & Garden,5462
Office Supplies,Presentation Supplies,577
Hardware,Blocks,548
Baby & Toddler,Diapering,1247
Baby & Toddler,Toys,257
Home & Garden,Pipes,1241
Office Supplies,Display Board,2177
Load Script
The above data is loaded to QlikView memory by using the script editor. Open the Script editor from the File menu or press Control+E. Choose the Table Files option from the Data from Files tab and browse for the file containing the above data. Edit the load script to add the following code. Click OK and click Control+R to load the data into QlikView's memory.
LOAD Product_Line,
     Product_category,
     Value
FROM
[C:\Qlikview\data\product_sales.csv]
(txt, codepage is 1252, embedded labels, delimiter is ',', msq);
Creating List Box
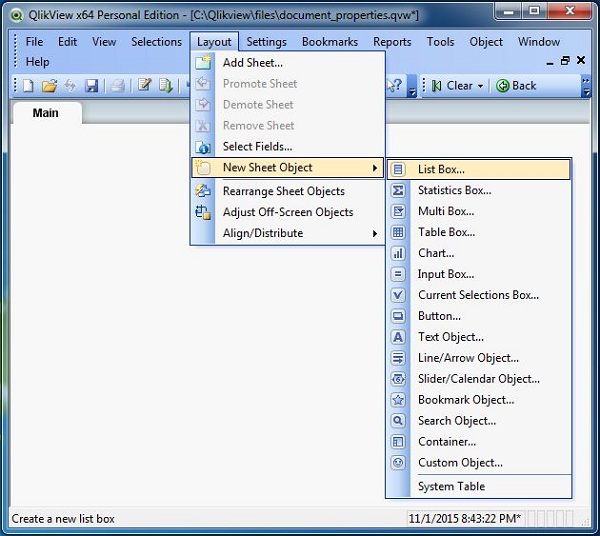
Creation of List Box involves navigating through menu Layout → New Sheet Object → List Box. The following screen shows these steps.
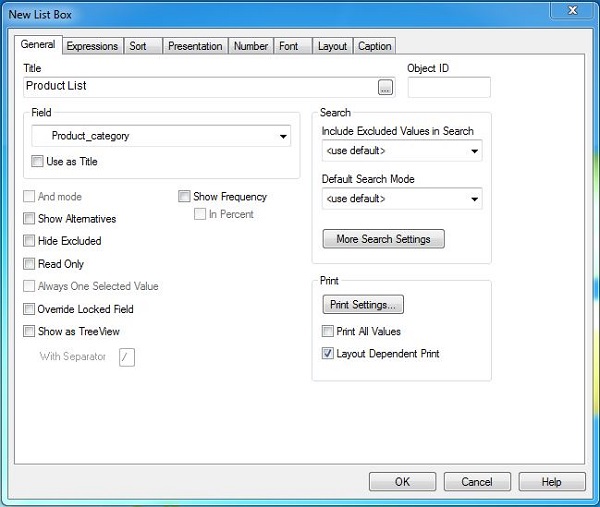
Next, we choose Product category as the field on which we build the list box.
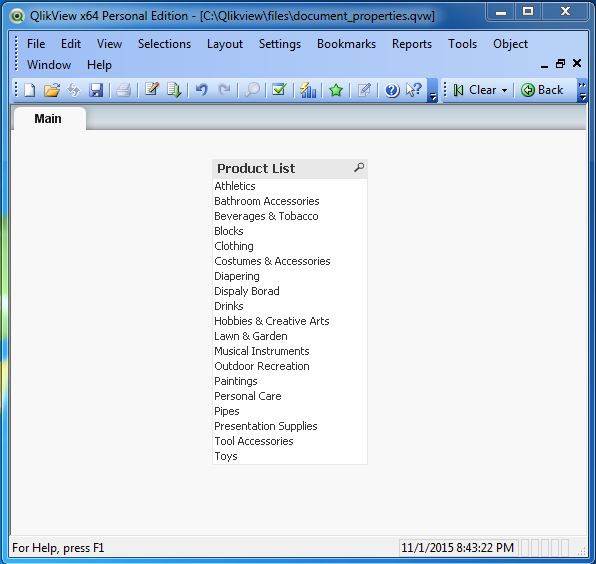
List Box Data
Finishing the above steps brings the following screen, which shows the values of Product category as a list box.
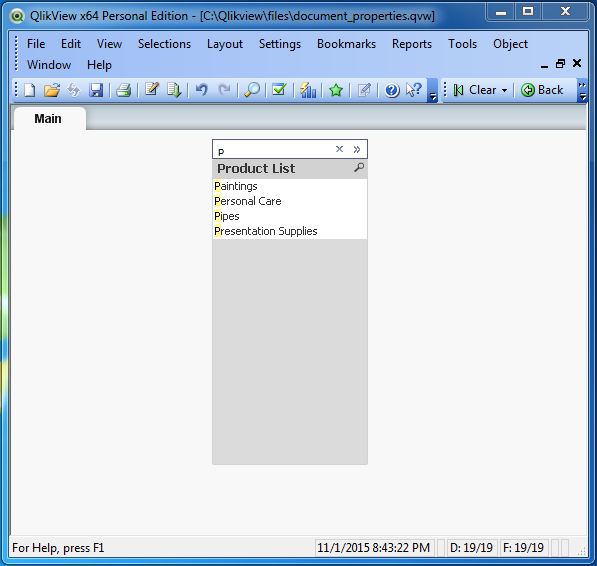
Search Option in List Box
When the List Box contains very large number of values, it is difficult to scroll down and look for it. So the search box at the top of the list box can be used to type the search string. The relevant values appear as soon as the first letter is typed.
List Box and Association
Other Sheet Objects automatically get associated with the List Box and the association is easily observed by selecting values form the list box.
QlikView - Multi Box
A Multi Box represents the list of all the values from multiple fields as drop down values. Similar to list box, the selection of a value in Multi Box highlights the related values in other sheet objects. This helps in faster visual analysis. It is also very useful to follow a drill down path among various sheet objects.
Input Data
Let us consider the following input data, which represents the sales figure of different product lines and product categories.
Product_Line,Product_category,Value
Sporting Goods,Outdoor Recreation,5642
Food, Beverages & Tobacco,2514
Apparel & Accessories,Clothing,2365
Apparel & Accessories,Costumes & Accessories,4487
Sporting Goods,Athletics,812
Health & Beauty,Personal Care,6912
Arts & Entertainment,Hobbies & Creative Arts,5201
Arts & Entertainment,Paintings,8451
Arts & Entertainment,Musical Instruments,1245
Hardware,Tool Accessories,456
Home & Garden,Bathroom Accessories,241
Food,Drinks,1247
Home & Garden,Lawn & Garden,5462
Office Supplies,Presentation Supplies,577
Hardware,Blocks,548
Baby & Toddler,Diapering,1247
Baby & Toddler,Toys,257
Home & Garden,Pipes,1241
Office Supplies,Display Board,2177
Load Script
The above data is loaded to QlikView memory by using the script editor. Open the Script editor from the File menu or press Control+E. Choose the Table Files option from the Data from Files tab and browse for the file containing the above data. Edit the load script to add the following code. Click OK and click Control+R to load the data into the QlikView's memory.
LOAD Product_Line,
     Product_category,
     Value
FROM
[C:\Qlikview\data\product_sales.csv]
(txt, codepage is 1252, embedded labels, delimiter is ',', msq);
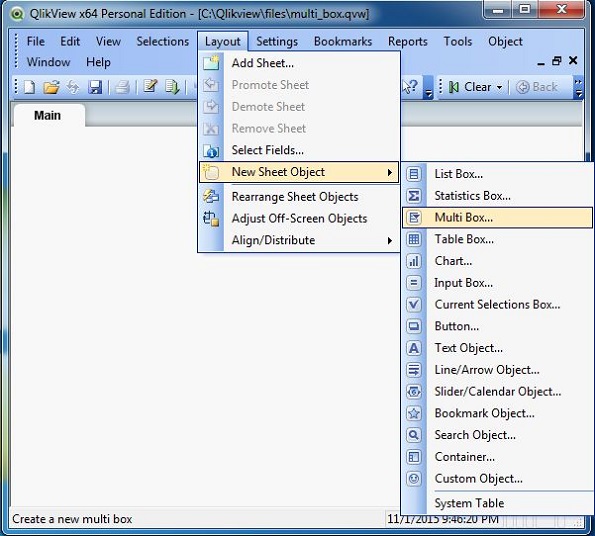
Creating Multi Box
Creation of Multi Box involves navigating through menu Layout → New Sheet Object → Multi Box. The following screen shows these steps.
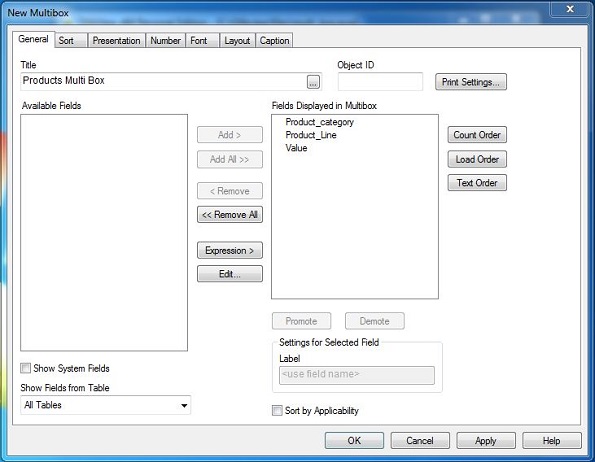
Next we choose the fields of the Products sales tables to build the Multi Box.
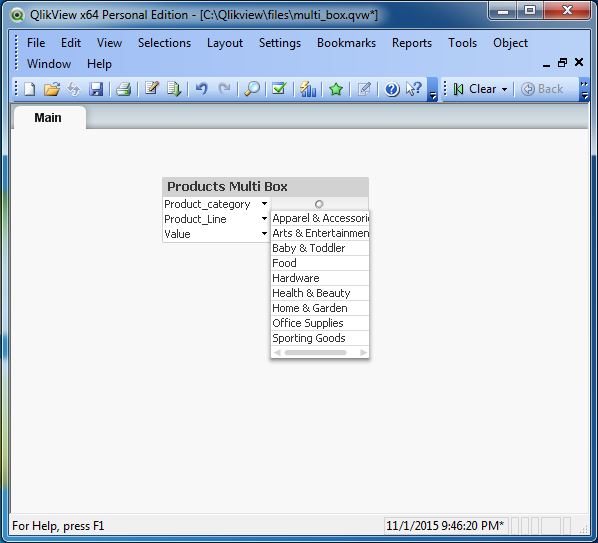
Multi Box Data
Finishing the above steps brings the following screen, which shows the values of Product category as a Multi box.
Multi Box and Association
Other Sheet Objects automatically get associated with the Multi Box and the association is easily observed by selecting values from the Multi Box.
QlikView - Text Object
QlikView text Object is used to show some descriptive information about the QlikView report being displayed. It can also show calculations based on certain expressions. It is mainly used for displaying nicely formatted information using colors and different font types in a box separately from the other Sheet Objects.
Input Data
Let us consider the following input data, which represents the sales figure of different product lines and product categories.
Product_Line,Product_category,Value
Sporting Goods,Outdoor Recreation,5642
Food, Beverages & Tobacco,2514
Apparel & Accessories,Clothing,2365
Apparel & Accessories,Costumes & Accessories,4487
Sporting Goods,Athletics,812
Health & Beauty,Personal Care,6912
Arts & Entertainment,Hobbies & Creative Arts,5201
Arts & Entertainment,Paintings,8451
Arts & Entertainment,Musical Instruments,1245
Hardware,Tool Accessories,456
Home & Garden,Bathroom Accessories,241
Food,Drinks,1247
Home & Garden,Lawn & Garden,5462
Office Supplies,Presentation Supplies,577
Hardware,Blocks,548
Baby & Toddler,Diapering,1247
Baby & Toddler,Toys,257
Home & Garden,Pipes,1241
Office Supplies,Display Board,2177
Load Script
The above data is loaded to QlikView memory by using the script editor. Open the Script editor from the File menu or press Control+E. Choose the "Table Files" option from the "Data from Files" tab and browse for the file containing the above data. Edit the load script to add the following code. Click "OK" and press "Control+R" to load the data into the QlikView's memory.
LOAD Product_Line,
     Product_category,
     Value
FROM
[C:\Qlikview\data\product_sales.csv]
(txt, codepage is 1252, embedded labels, delimiter is ',', msq);
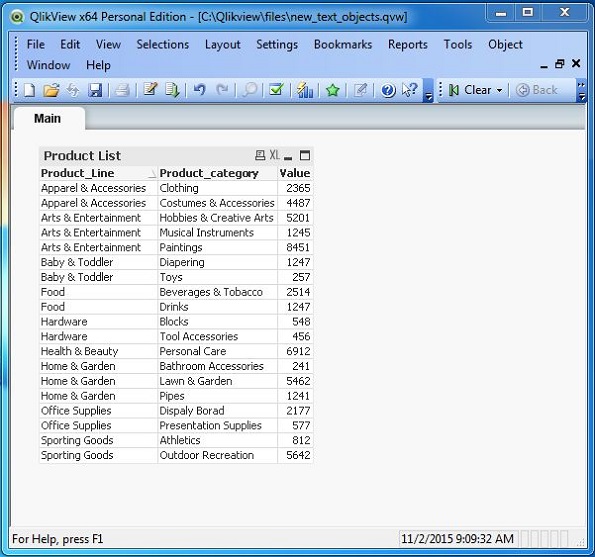
Creating Table Box
For the above data, let us create a Table Box , which will show the data in a tabular form. Go to the menu Layout → New Sheet Object → Table Box and choose the column as shown below.
Click Apply and then OK to finish creating the Table box. The following screen appears.
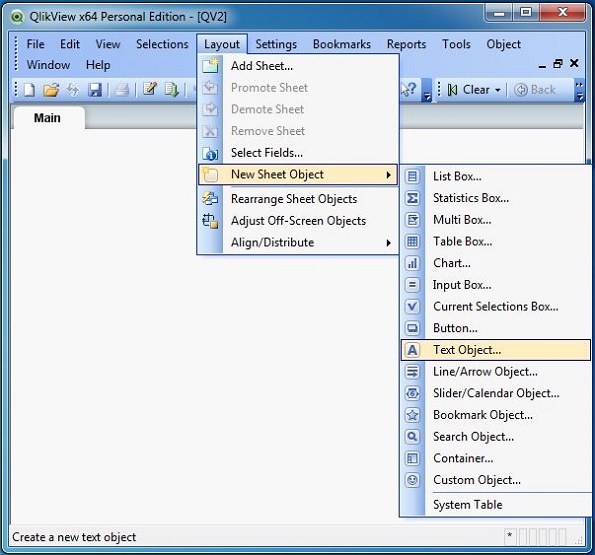
Creating Text Object
For the above data, let us create a Text Object. Go to the menu Layout → New Sheet Object → Text Object as shown below.
Creating Text Object Expression
On the text box created above, right click and choose properties. Then enter the content to be displayed on the Text Object in the Text box under the General tab as shown below.
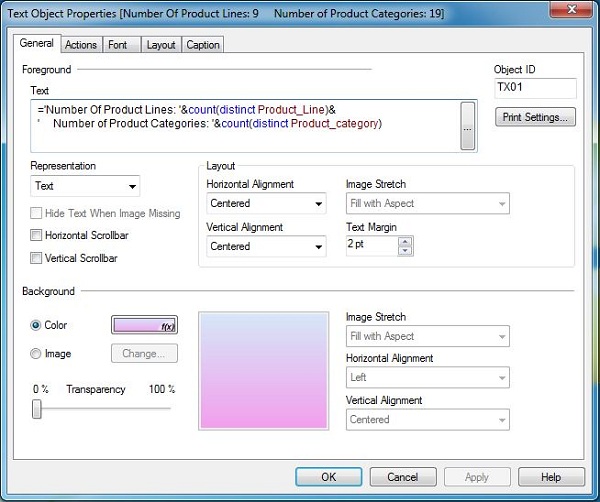
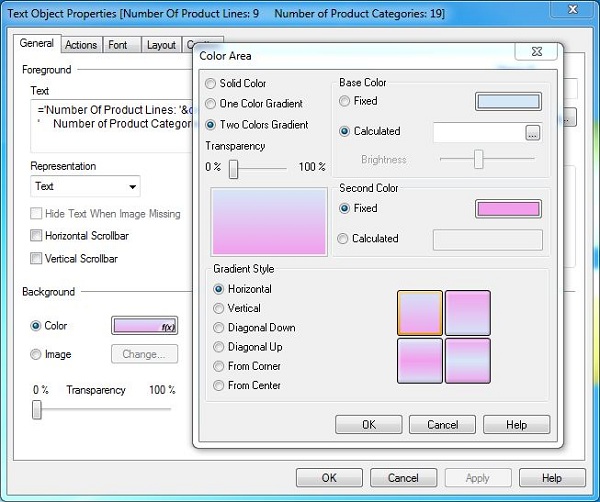
Choosing the Background Color
The background color of the Text Object can be set using the background option in the General tab.
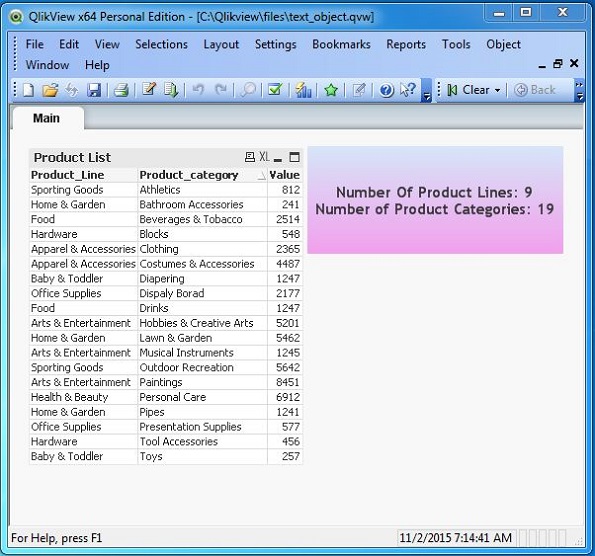
The Text Object
The final Text Object is shown below. If we click on some Product Line to filter it, then the content in the Text Object changes accordingly to reflect the new values.
QlikView - Bar Chart
Bar charts are very widely used charting method to study the relation between two dimensions in form of bars. The height of the bar in the graph represents the value of one dimension. The number of bars represent the sequence of values or grouped values of another dimension.
Input Data
Let us consider the following input data, which represents the sales figure of different product lines and product categories.
Product_Line,Product_category,Value
Sporting Goods,Outdoor Recreation,5642
Food, Beverages & Tobacco,2514
Apparel & Accessories,Clothing,2365
Apparel & Accessories,Costumes & Accessories,4487
Sporting Goods,Athletics,812
Health & Beauty,Personal Care,6912
Arts & Entertainment,Hobbies & Creative Arts,5201
Arts & Entertainment,Paintings,8451
Arts & Entertainment,Musical Instruments,1245
Hardware,Tool Accessories,456
Home & Garden,Bathroom Accessories,241
Food,Drinks,1247
Home & Garden,Lawn & Garden,5462
Office Supplies,Presentation Supplies,577
Hardware,Blocks,548
Baby & Toddler,Diapering,1247
Baby & Toddler,Toys,257
Home & Garden,Pipes,1241
Office Supplies,Display Board,2177
Load Script
The above data is loaded to the QlikView memory by using the script editor. Open the Script editor from the File menu or press Control+E. Choose the "Table Files" option form the "Data from Files" tab and browse for the file containing the above data. Edit the load script to add the following code. Click "OK" and press "Control+R" to load the data into the QlikView's memory.
LOAD Product_Line,
     Product_category,
     Value
FROM
[C:\Qlikview\data\product_sales.csv]
(txt, codepage is 1252, embedded labels, delimiter is ',', msq);
Creating Table Box(Sheet Object)
For the above data, let us create a Table Box, which will show the data in a tabular form. Go to the menu Layout → New Sheet Object → Table Box and choose the column as shown below.
Click Apply and then OK to finish creating the Table box. The below given screen appears.
Using the Quick Chart Wizard
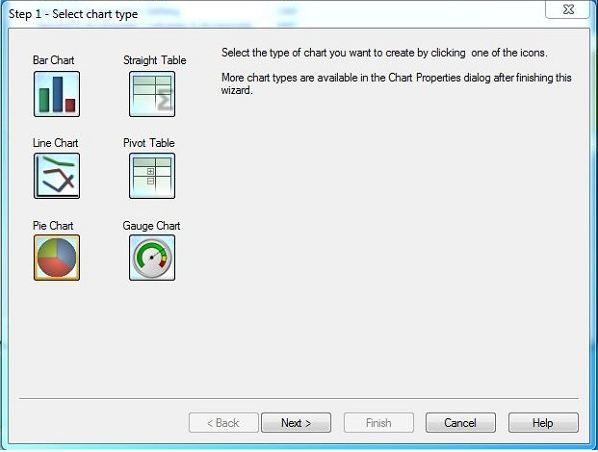
To start creating a bar chart, we will use the quick chart wizard. On clicking it, the following screen appears which prompts for selecting the chart type. Choose bar Chart and click Next.
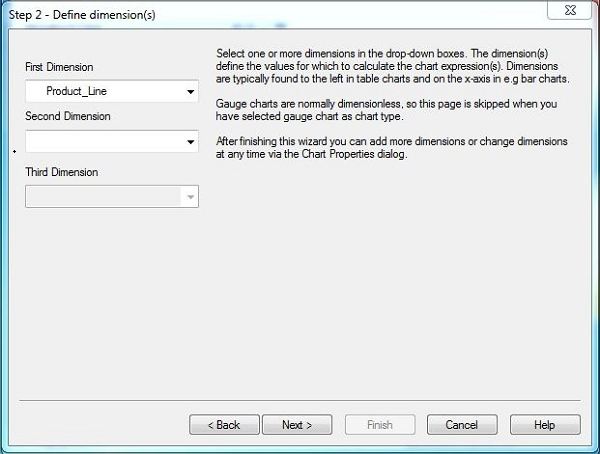
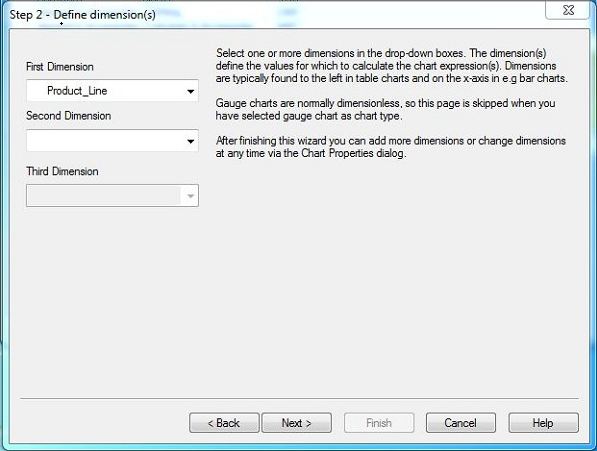
Choose the Chart Dimension
Choose Product Line as the First Dimension.
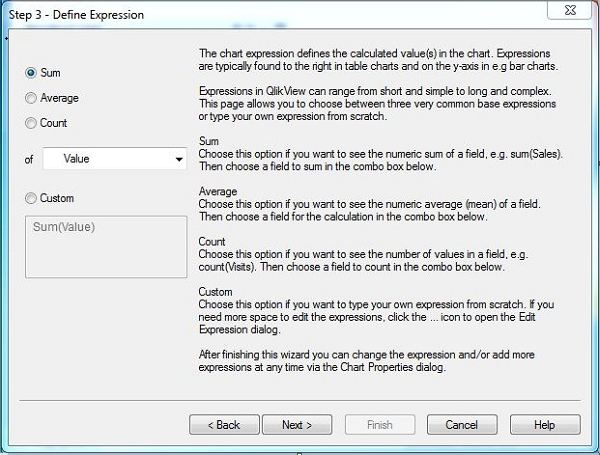
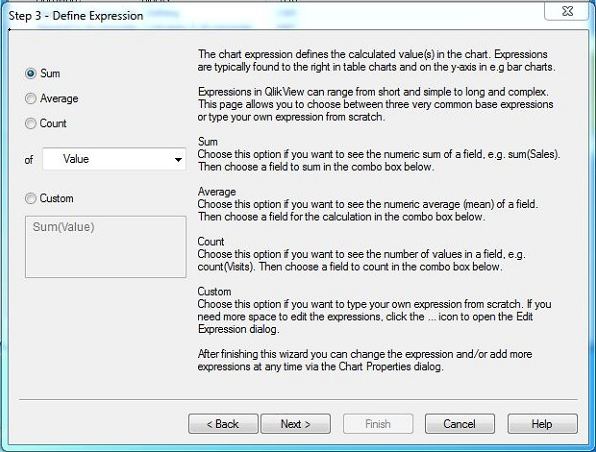
Choose the Chart Expression
The chart expression is used to apply the functions like Sum, Average, or Count on the fields with numeric values. We will apply the Sum function on the filed named Value. Click Next.
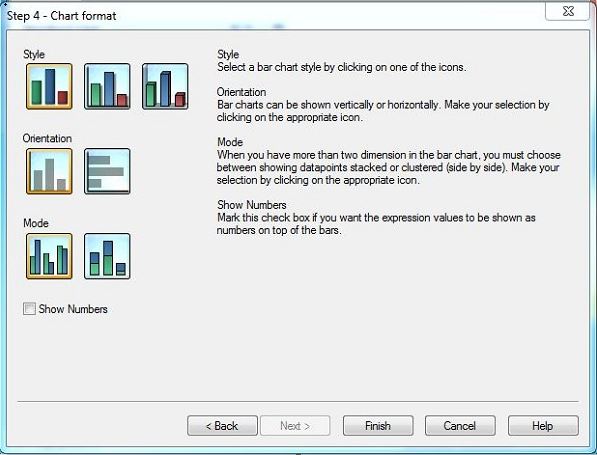
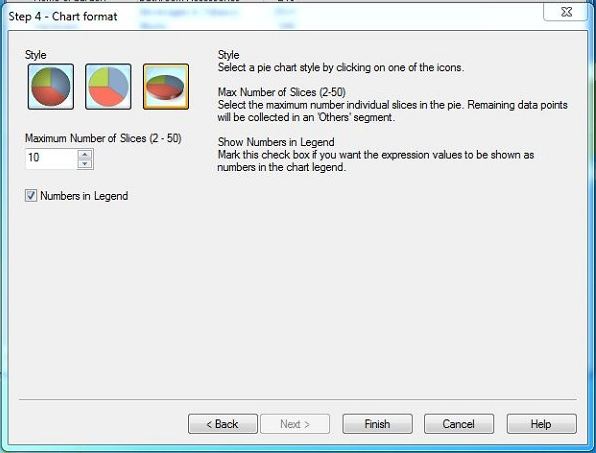
Choose the Chart Format
The Chart format defines the style and orientation of the chart. We choose the first option in each category. Click Next.
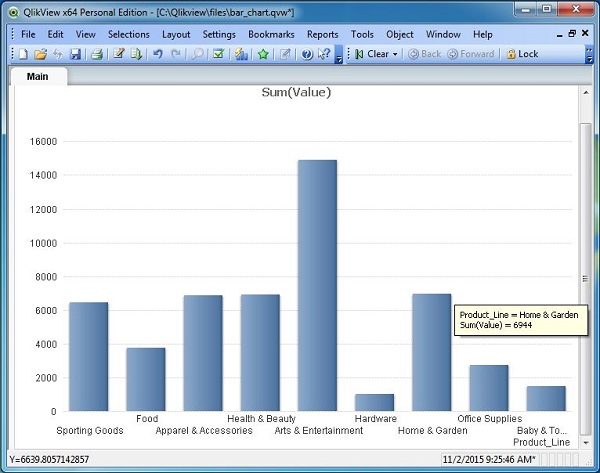
The Bar Chart
The Bar chart appears as shown below. It shows the height of the field value for different product lines.
QlikView - Pie Chart
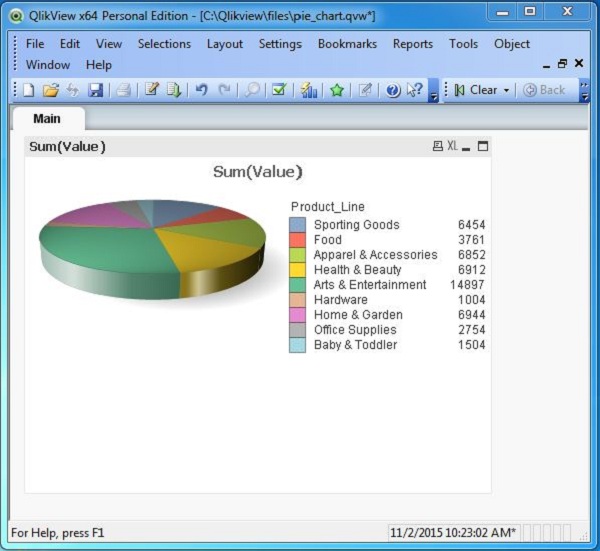
A pie-chart is a representation of values as slices of a circle with different colors. The slices are labeled and the numbers corresponding to each slice is also represented in the chart. QlikView creates pie-chart using the chart wizard or chart Sheet Object.
Input Data
Let us consider the following input data, which represents the sales figure of different product lines and product categories.
Product_Line,Product_category,Value
Sporting Goods,Outdoor Recreation,5642
Food, Beverages & Tobacco,2514
Apparel & Accessories,Clothing,2365
Apparel & Accessories,Costumes & Accessories,4487
Sporting Goods,Athletics,812
Health & Beauty,Personal Care,6912
Arts & Entertainment,Hobbies & Creative Arts,5201
Arts & Entertainment,Paintings,8451
Arts & Entertainment,Musical Instruments,1245
Hardware,Tool Accessories,456
Home & Garden,Bathroom Accessories,241
Food,Drinks,1247
Home & Garden,Lawn & Garden,5462
Office Supplies,Presentation Supplies,577
Hardware,Blocks,548
Baby & Toddler,Diapering,1247
Baby & Toddler,Toys,257
Home & Garden,Pipes,1241
Office Supplies,Display Board,2177
Load Script
The above data is loaded to QlikView memory by using the script editor. Open the Script editor from the File menu or press Control+E. Choose the "Table Files" option from the "Data from Files" tab and browse for the file containing the above data. Edit the load script to add the following code. Click "OK" and press "Control+R" to load the data into the QlikView's memory.
LOAD Product_Line,
     Product_category,
     Value
FROM
[C:\Qlikview\data\product_sales.csv]
(txt, codepage is 1252, embedded labels, delimiter is ',', msq);
Using the Quick Chart Wizard
To start creating a Pie chart, we will use the quick chart wizard. On clicking it, the following screen appears which prompts for selecting the chart type. Choose Pie Chart and click Next.
Choose the Chart Dimension
Choose Product Line as the First Dimension.
Choose the Chart Expression
The chart expression is used to apply the functions like Sum, Average or Count on the fields with numeric values. We will apply the Sum function on the filed named Value. Click Next.
Choose the Chart Format
The Chart format defines the style and orientation of the chart. We choose the third option. Click Next.
The Pie Chart
The Bar chart appears as shown below. It shows the height of the field value for different product lines.
QlikView - Dashboard
A Dashboard is a powerful feature to display values from many fields simultaneously. QlikeView's feature of data association in memory can display the dynamic values in all the sheet objects.
Input Data
Let us consider the following input data, which represents the sales figure of different product lines and product categories.
Product_Line,Product_category,Value
Sporting Goods,Outdoor Recreation,5642
Food, Beverages & Tobacco,2514
Apparel & Accessories,Clothing,2365
Apparel & Accessories,Costumes & Accessories,4487
Sporting Goods,Athletics,812
Health & Beauty,Personal Care,6912
Arts & Entertainment,Hobbies & Creative Arts,5201
Arts & Entertainment,Paintings,8451
Arts & Entertainment,Musical Instruments,1245
Hardware,Tool Accessories,456
Home & Garden,Bathroom Accessories,241
Food,Drinks,1247
Home & Garden,Lawn & Garden,5462
Office Supplies,Presentation Supplies,577
Hardware,Blocks,548
Baby & Toddler,Diapering,1247
Baby & Toddler,Toys,257
Home & Garden,Pipes,1241
Office Supplies,Display Board,2177
Load Script
The above data is loaded to QlikView memory by using the script editor. Open the Script editor from the File menu or press Control+E. Choose the "Table Files" option from the "Data from Files" tab and browse for the file containing the above data. Edit the load script to add the following code. Click "OK" and press "Control+R" to load the data into the QlikView's memory.
LOAD Product_Line,
     Product_category,
     Value
FROM
[C:\Qlikview\data\product_sales.csv]
(txt, codepage is 1252, embedded labels, delimiter is ',', msq);
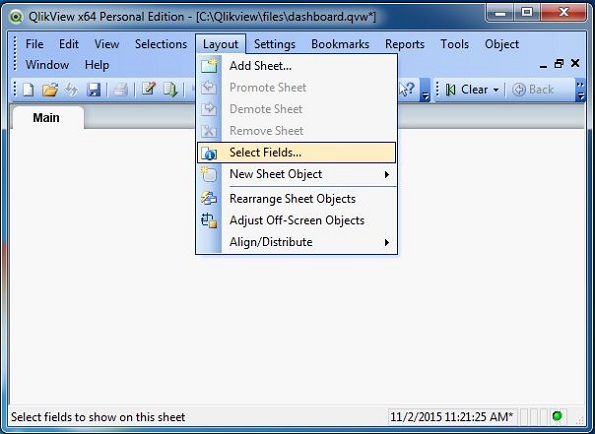
Choose Matrices
We choose the fields from the above input data as matrices to be displayed in the dashboard. For this, we follow the steps in the menu Layout → Select Fields.
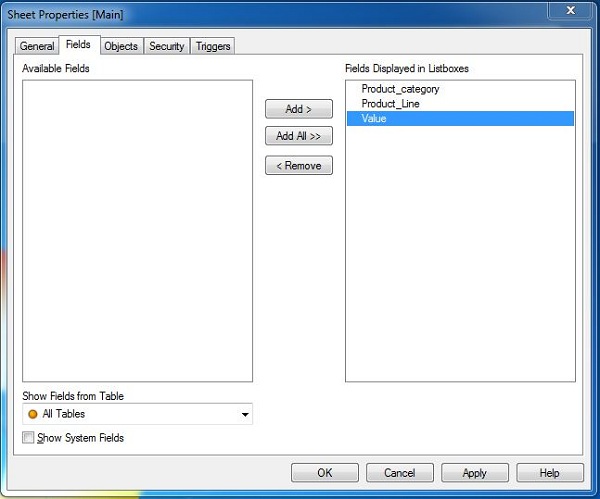
In the next screen, choose the available fields to be displayed in the dashboard. Click "OK".
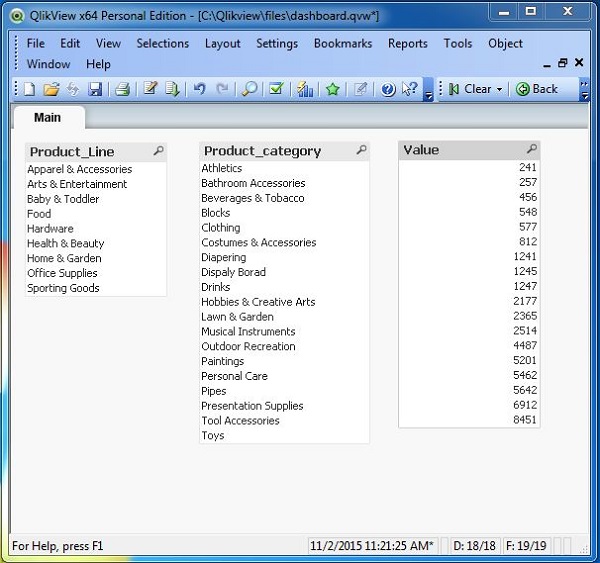
The following screen appears displaying all the fields
Adding Chart to Dashboard
NNow we add a chart to the dashboard by right-clicking anywhere in the sheet and choosing New Sheet Object → Chart.
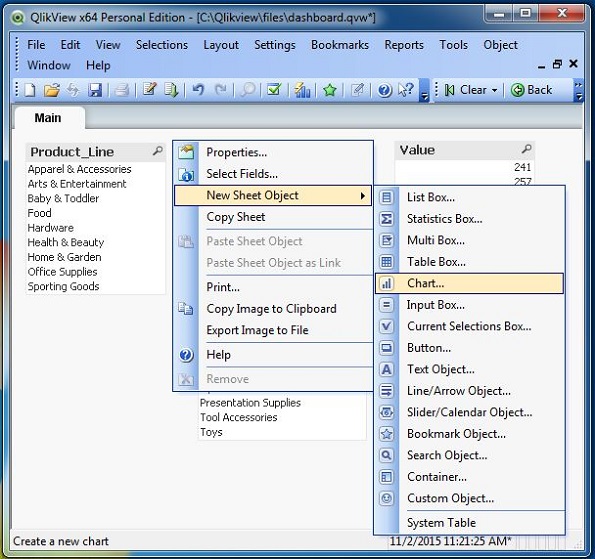
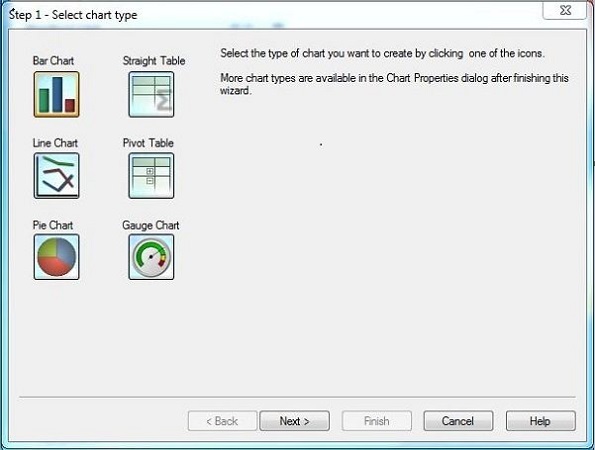
Choose the Chart Type
Let us choose the chart type as a bar chart to display the sales values for various product Lines.
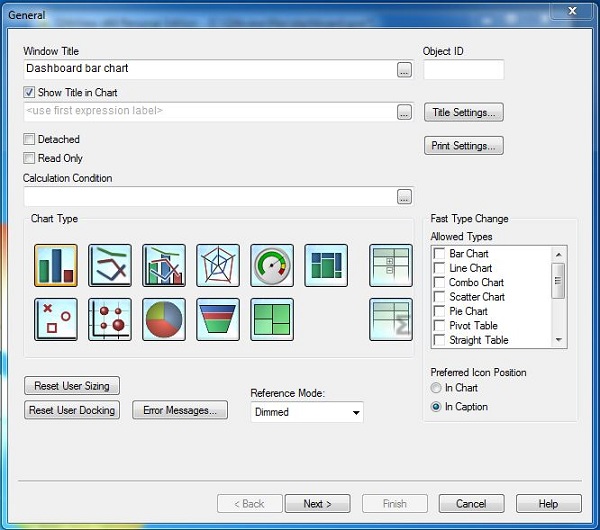
Chart Dimension
Let us select the Product Line as the Chart Dimension.
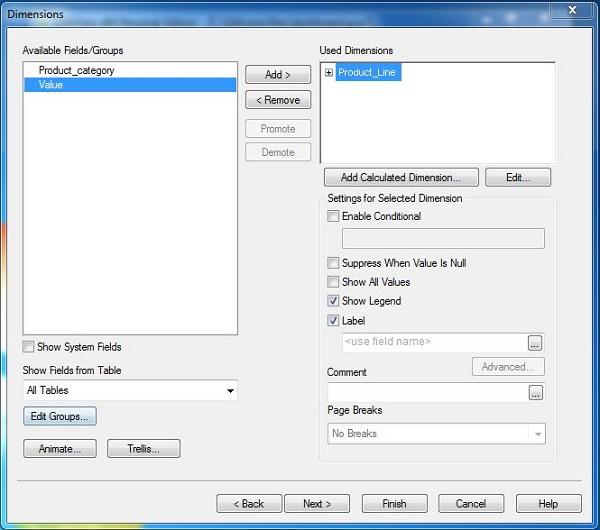
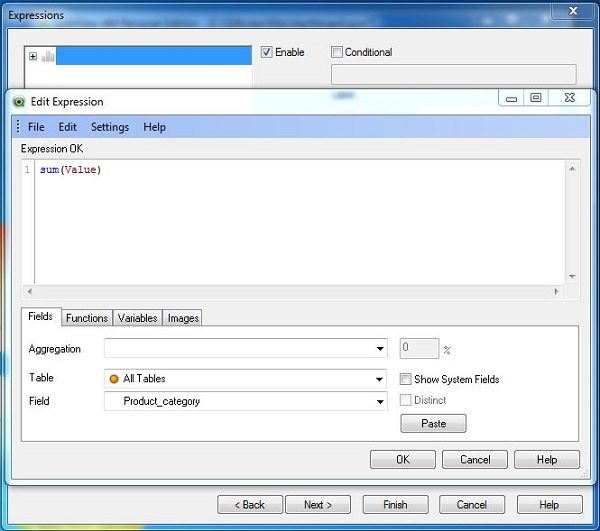
Chart Expression
The expression to display the sales value for the Product Line dimension is written in the expression editor.
The Dashboard
Given below is the dashboard displayed after finishing the above steps.
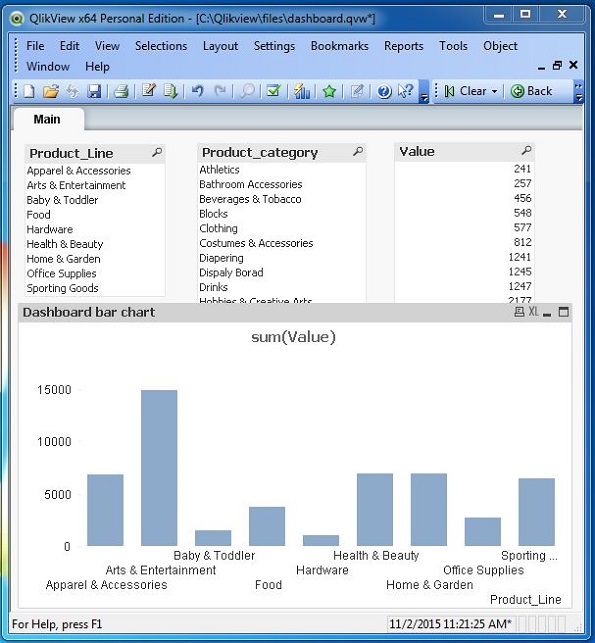
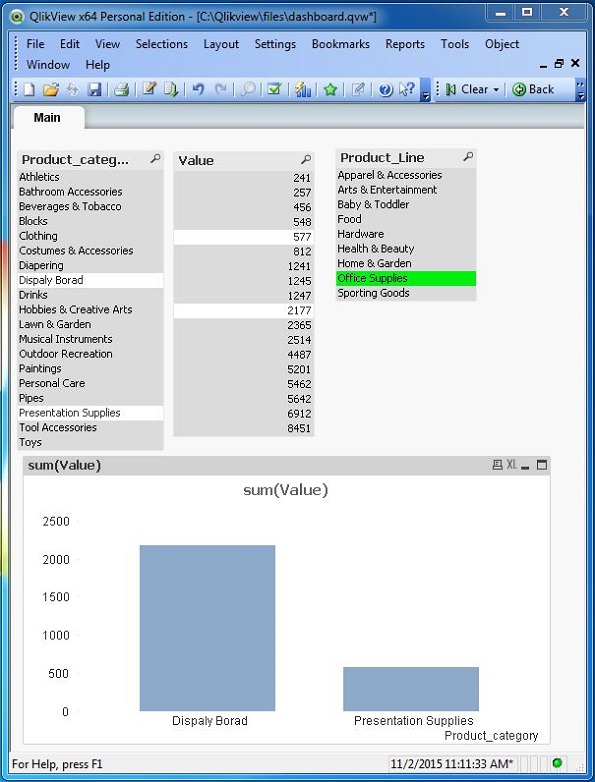
Using the Dashboard
The values in the above Dashboard can be selected for filtering specific products and the chart changes accordingly. In addition, the associated values are highlighted.
QlikView - Data Transformation
Data Transformation is the process of modifying the existing data to a new data format. It can also involve filtering out or adding some specific values to the existing data set. QlikView can carry out data transformation after reading it to its memory and using many in-built functions.
Input Data
Let us consider the following input data, which represents the sales figures of each month. This is stored as a csv file with name quarterly_sales.csv
Month,SalesVolume
March,2145
April,2458
May,1245
Sales Values in Q2
June,5124
July,7421
August,2584
Sales Values in Q3
September,5314
October,7846
November,6532
December,4625
January,8547
February,3265
Loading the Data
The above data is loaded to QlikView memory by using the script editor. Open the Script editor from the File menu or press Control+E. Choose the "Table Files" option form the "Data from Files" tab and browse for the file quarterlt_sales.csv. Click next.
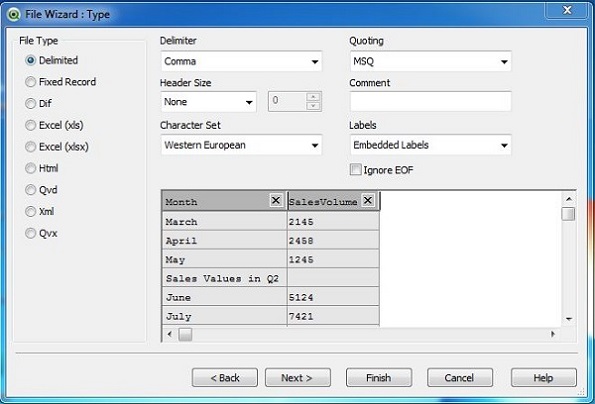
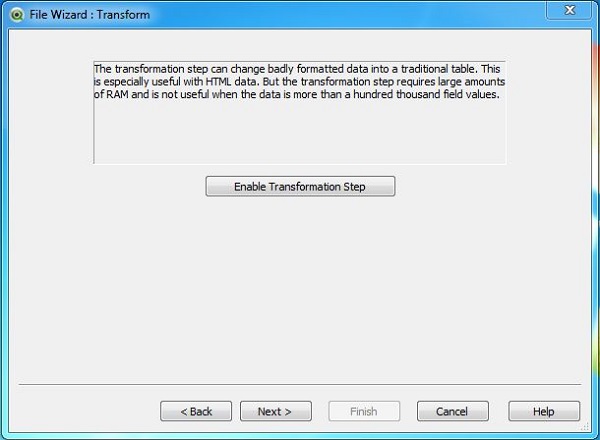
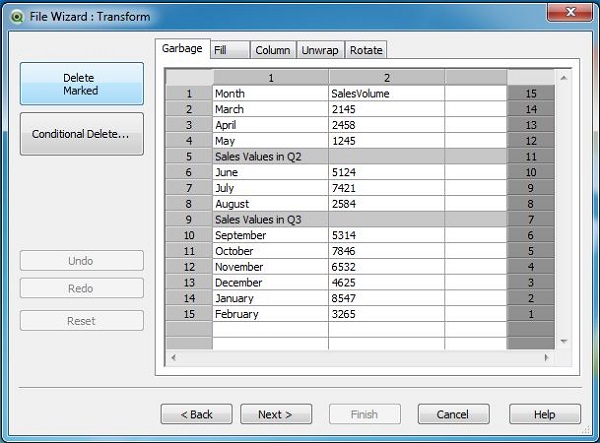
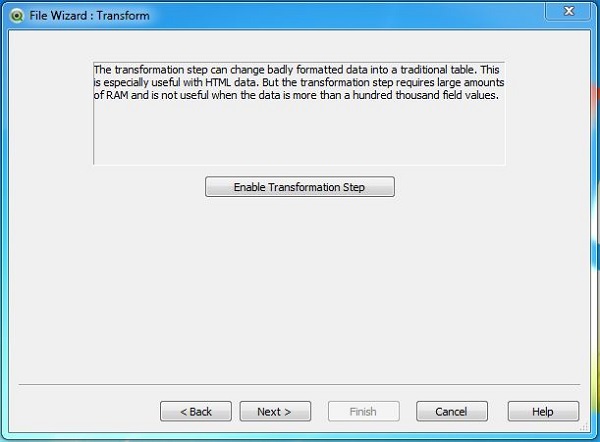
The Transformation Wizard
The next screen prompts us to choose some data transformation. Click on the button Enable Transformation Step.
Transformation Type
In this step, we will select the transformation to eliminate the rows, which describe the quarter. We select Garbage → delete marked and select the two rows, which are not required. Click Next.
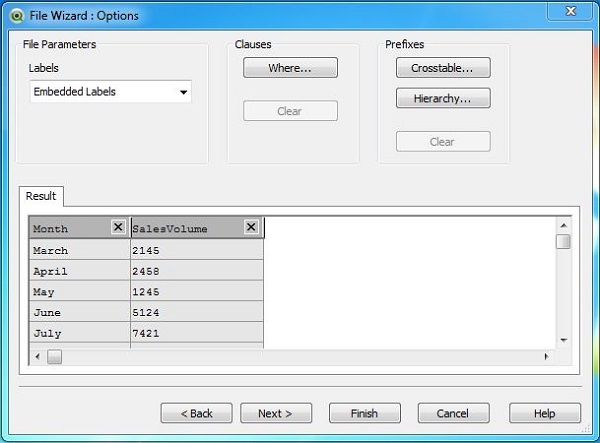
File Wizard Options
After selecting the type of Transformation and the rows to be removed, the next screen prompts us for any further transformation like selecting a where clause or adding any Prefixes. We will ignore this step and click Finish.
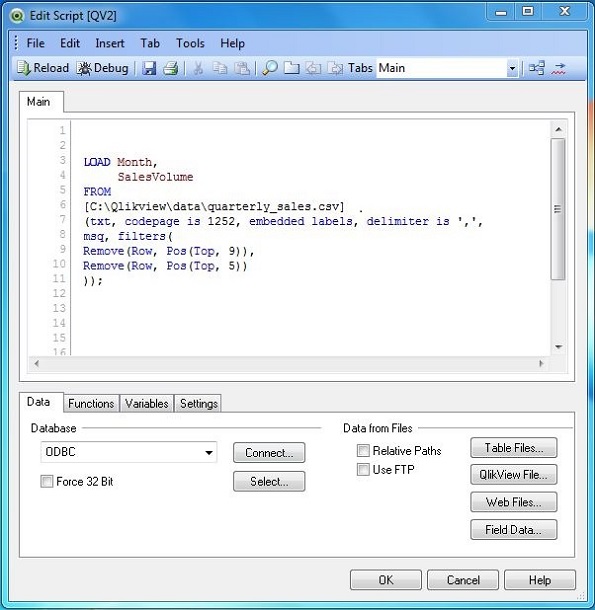
Load Script for Transformed Data
The Load script for the above data after all the transformation steps are complete is given below.
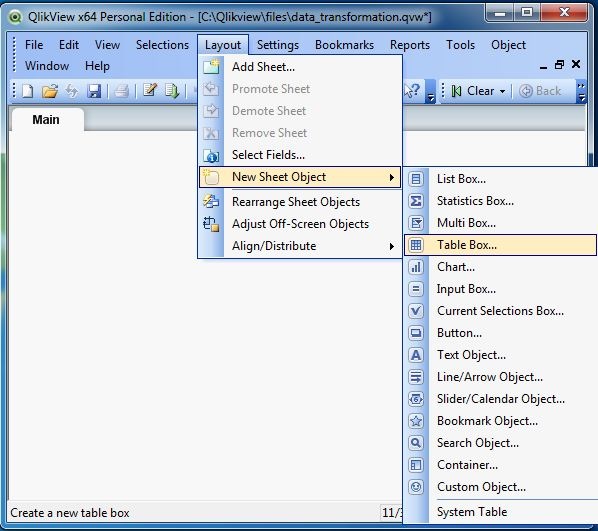
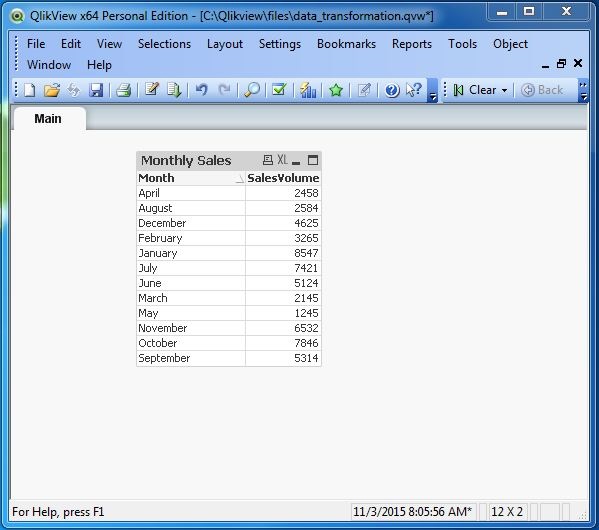
Displaying Transformed Data
The transformed data can be displayed by using a Table Box sheet object. The steps to create it are given below.
Next, we choose the fields for the Table Box.
The Table Box now displays the data in the sheet.
QlikView - Fill Function
The Fill function in QlikView is used to fill values from existing fields into a new field.
Input Data
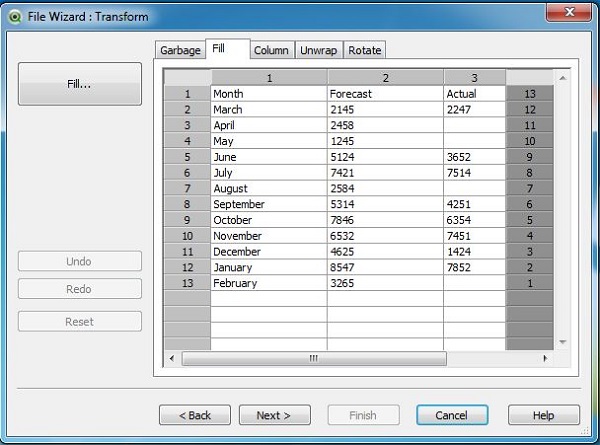
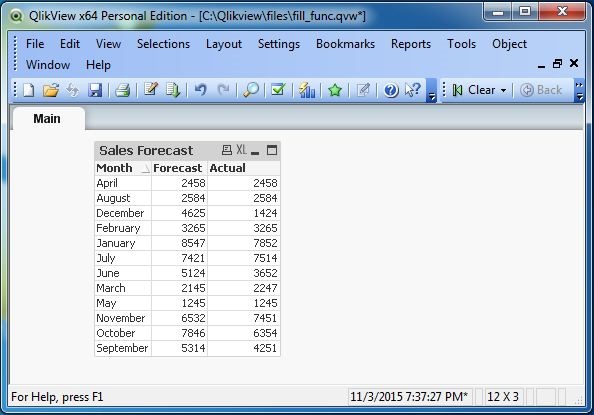
Let us consider the following input data, which represents the actual and forecasted sales figures.
Month,Forecast,Actual
March,2145,2247
April,2458,
May,1245,
June,5124,3652
July,7421,7514
August,2584,
September,5314,4251
October,7846,6354
November,6532,7451
December,4625,1424
January,8547,7852
February,3265,
Load Script
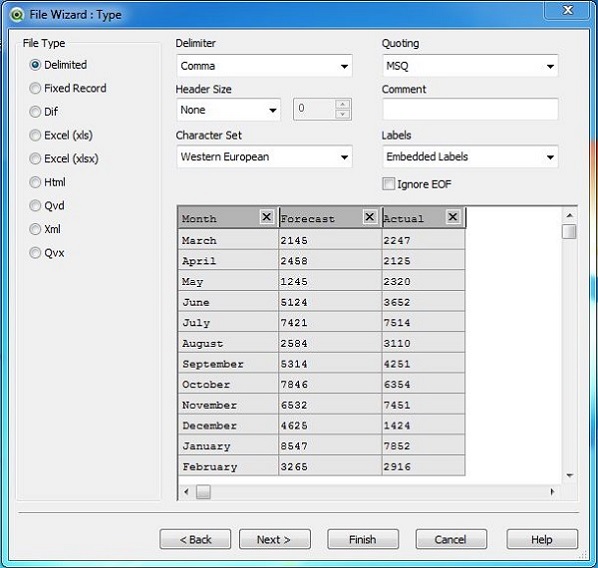
The above data is loaded to the QlikView memory by using the script editor. Open the Script editor from the File menu or press Control+E. Choose the "Table Files" option from the "Data from Files" tab and browse for the file containing the above data.
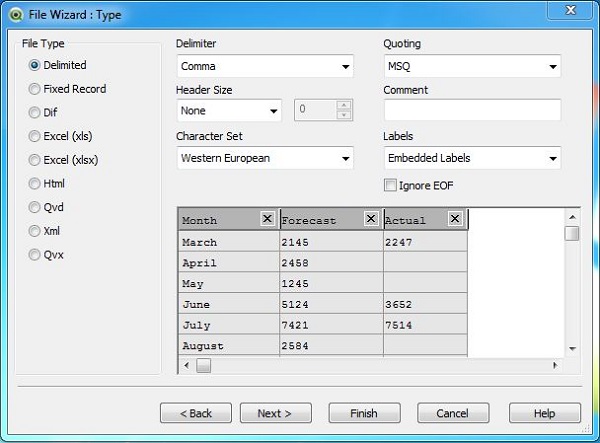
After clicking Next in the above step, we choose the Enable Transformation Step button to carry out the required data transformation.
Selecting the Data Transformation
As we are going to use the Fill function, let us choose the Fill tab, which displays th empty values under the Actual Field.
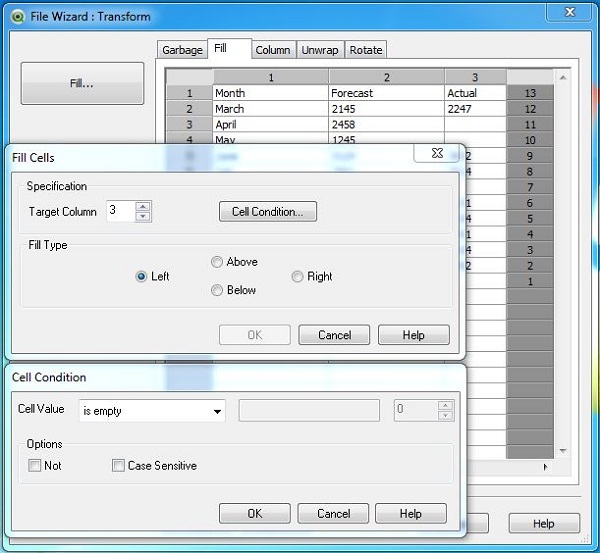
Create the Fill Condition
On clicking the Fill button, the option to choose target column and the cell condition appears. We choose column three, as we want to fill the empty values of this column with values from same row in column two. Also, choose the Cell Value as empty so that only the empty cells will be overwritten with new values.
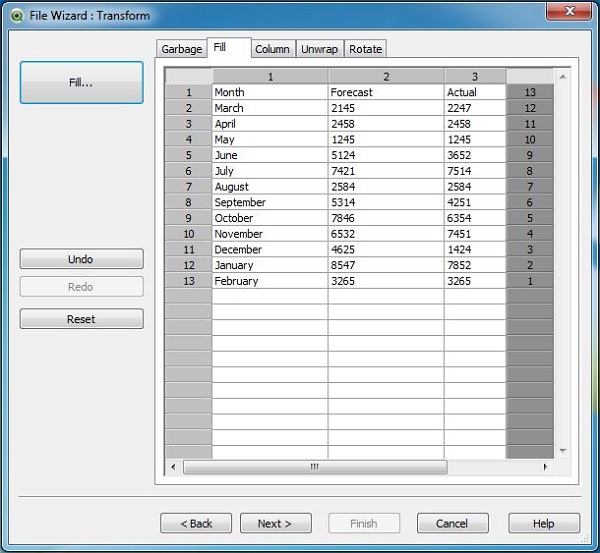
Transformed Data
On completing the above steps, we get the transformed data as shown below.
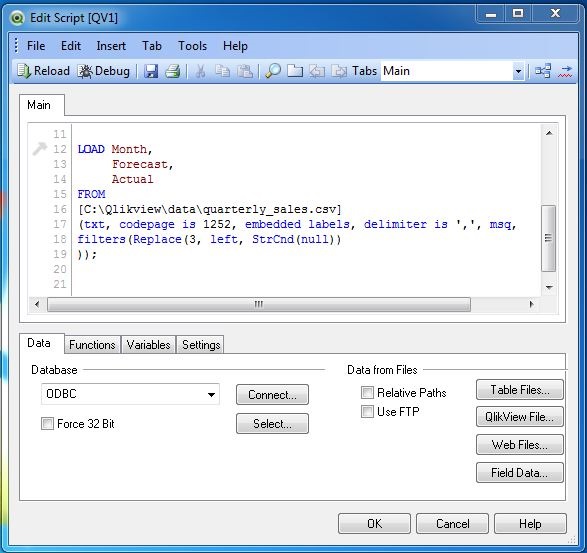
Load Script for transformed Data
The load script for the transformed data can be seen using the script editor. The script shows the expression, which replaces the empty cell values.
Display Transformed Data
The transformed data can be seen by creating a Table Box using the option in the menu Layout → New Sheet Object.
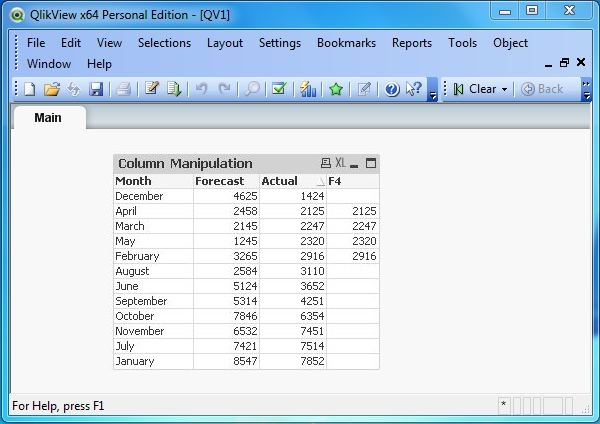
QlikView - Column Manipulation
Column Manipulation is a type of Data Transformation in which a new column is populated with values from an existing column, which meets certain criteria. The criteria can be an expression, which is created as part of the Data Transformation step.
Input Data
Let us consider the following input data, which represents the actual and forecasted sales figures.
Month,Forecast,Actual
March,2145,2247
April,2458,2125
May,1245,2320
June,5124,3652
July,7421,7514
August,2584,3110
September,5314,4251
October,7846,6354
November,6532,7451
December,4625,1424
January,8547,7852
February,3265,2916
Load Script
The above data is loaded to QlikView memory by using the script editor. Open the Script editor from the File menu or press Control+E. Choose the "Table Files" option from the "Data from Files" tab and browse for the file containing the above data. After clicking Next, we choose the Enable Transformation Step button to carry out the required data transformation.
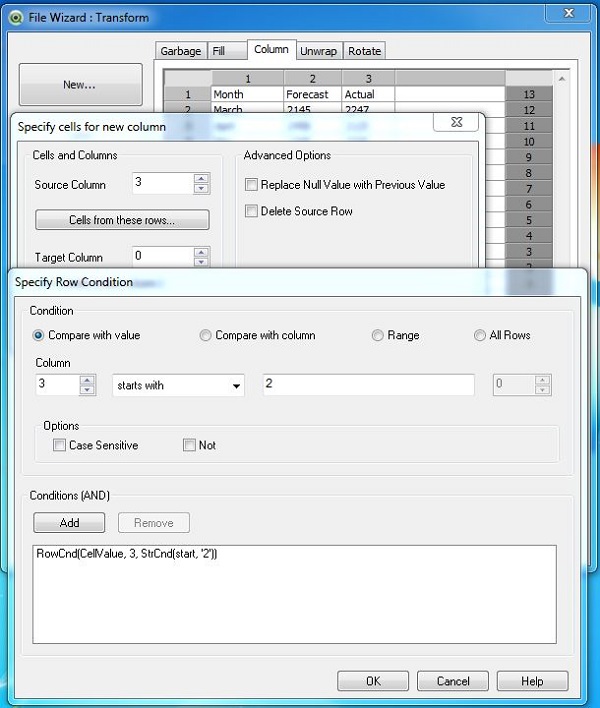
Selecting the Data Transformation
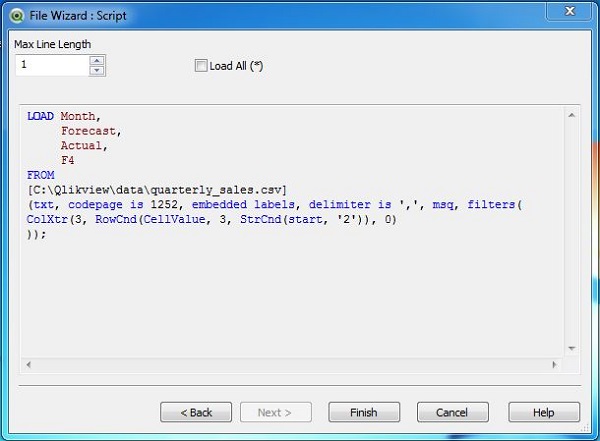
Choose the Column tab and then choose the New button. It asks to specify the New column and the Row Condition. We specify column 3 as the source column and pick the values, which start with two as the Row Condition.
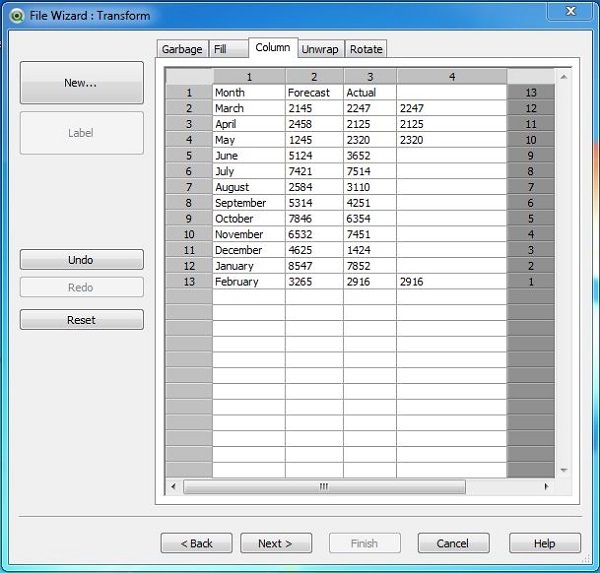
Transformed Data
On completing the above steps, we get the transformed data as shown below.
Load Script for Transformed Data
The load script for the Transformed data can be seen using the script editor. The script shows the expression, which creates the new column with required values.
Display Transformed Data
The transformed data can be seen by creating a Table Box using the option in the menu Layout → New Sheet Object.
QlikView - Rotating Tables
The Rotating table in QlikView is similar to the column and row transpose feature in Microsoft Excel but with some additional options. We can transpose columns in multiple directions and they give different results. In this chapter, we will be seeing the normal transpose option of converting rows to columns.
Input Data
Let us consider the following input data, which represents the actual and forecasted sales figures.
Month,Forecast,Actual
March,2145,2247
April,2458,
May,1245,
June,5124,3652
July,7421,7514
August,2584,
September,5314,4251
October,7846,6354
November,6532,7451
December,4625,1424
January,8547,7852
February,3265,
Load Script
The above data is loaded to QlikView memory by using the script editor. Open the script editor from the File menu or press Control+E. Choose the "Table Files" option from the "Data from Files" tab and browse for the file containing the above data.

After clicking Next, we choose the Enable Transformation Step button to carry out the required data transformation.
Selecting the Data Transformation
As we are going to use the Rotate function, let us choose the Rotate tab which displays the values of all the fields.
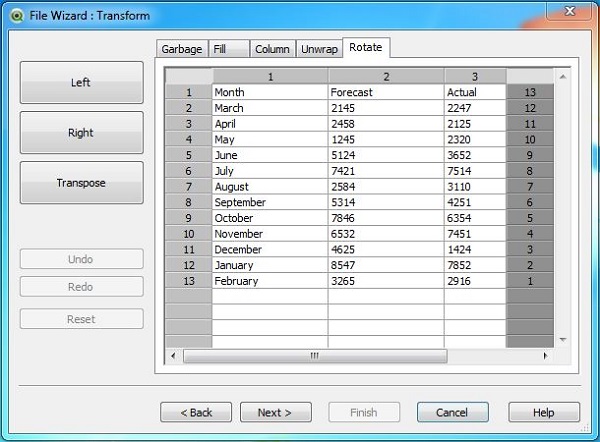
Apply Rotate
We click the Transpose button to transpose the above data. The transposed data appears as shown below.
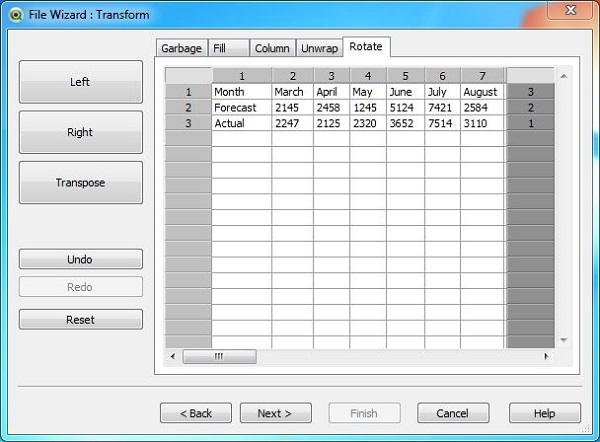
Load Script for transformed Data
The load script for the Transformed data can be seen using the script editor. The script shows the expression, which replaces the empty cell values.
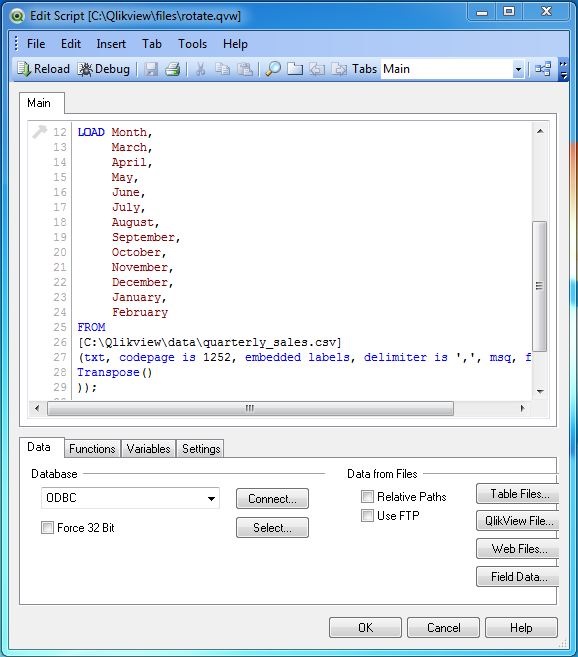
Display Transformed Data
The transformed data can be seen by creating a Table Box using the option in the menu Layout → New Sheet Object.
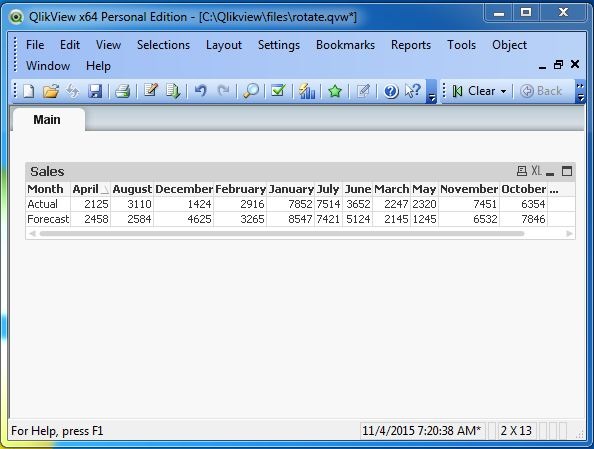
QlikView - Dimensions and Measures
Dimensions and Measures are fundamental entities, which are always used in data analysis. For example, consider the result of the analysis, what is the percentage change in volume of sales for each quarter? In this case, each quarter represents the Dimensions, which is the name of the quarter. The percentage change in volume represents the Measures, which is a calculation with respect to each value in the dimension. Below are some widely accepted definition of these two terms.
- Dimension − It is a descriptive field in the data set which represents few distinct values. Examples − Month, Year, Product ID etc.
- Measures − It is a numeric field on which some calculations are performed for each distinct value of dimension.
Input Data
Let us consider the following input data, which represents the sales volume and Revenue of different product lines and product categories in different regions. Save the data into a .csv file.
ProductID,ProductCategory,Region,SalesVolume, Revenue
1,Outdoor Recreation,Europe,457,25841
2,Clothing,Europe,125,54281
3,Costumes & Accessories,South Asia,781,54872
4,Athletics,South Asia,839,87361
5,Personal Care,Australia,473,15425
6,Arts & Entertainment,North AMerica,625,84151
7,Hardware,South America,772,45812
Load Script
The above data is loaded to the QlikView memory by using the script editor. Open the Script editor from the File menu or press Control+E. Choose the Table Files option from the Data from Files tab and browse for the file containing the above data. Click OK and press Control+R to load the data into the QlikView's memory
Table Structure
We can see the structure of the table by following the menu File → Table Viewer or pressing Control+T. The following screen comes up in which we have marked the dimensions inside a green box and the measures inside a red box.
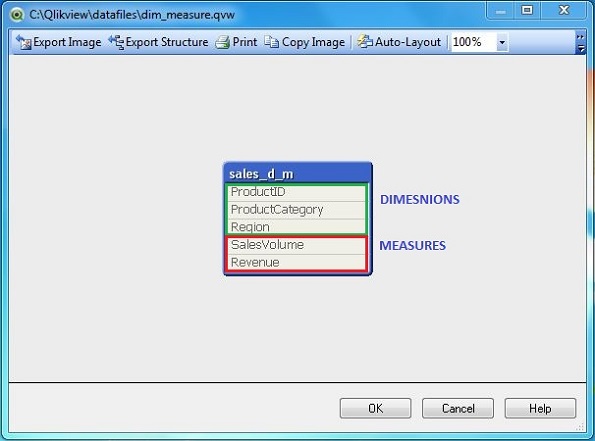
Using Dimensions and Measures
Let us create a straight table chart showing the calculation using above dimensions and measures. Click on the Quick Chart Wizard as shown below.
Next, click on the Straight Table option. Click Next.
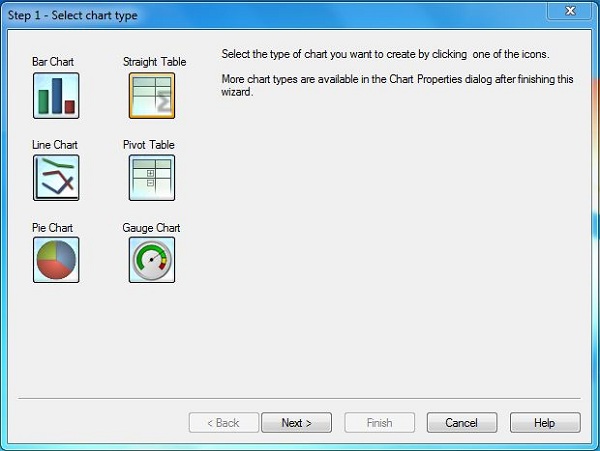
Choose Dimensions
In this screen, we choose Region as the dimension as we want to select the total revenue for each region.
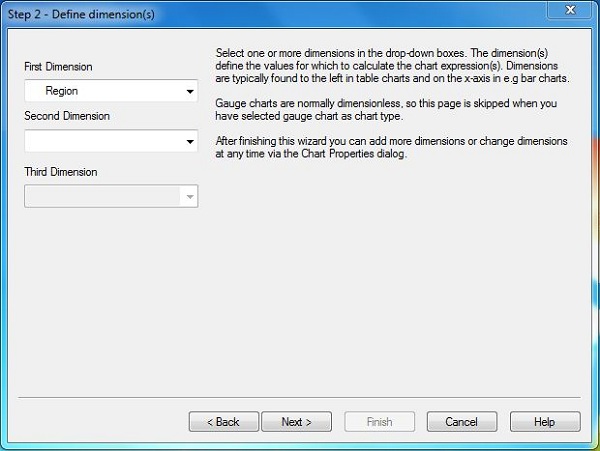
Choose Measure
The Next screen prompts for applying the calculation on a measure field. We choose to apply Sum on the field Revenue.
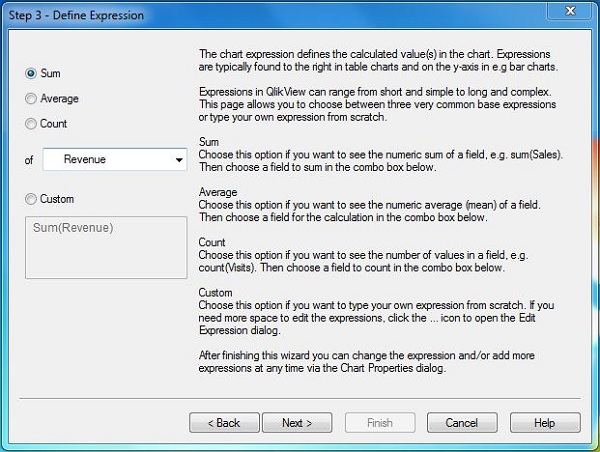
Final chart
On completing the above steps, we get the final chart which shows the total revenue(Measure) for each region(Dimension).
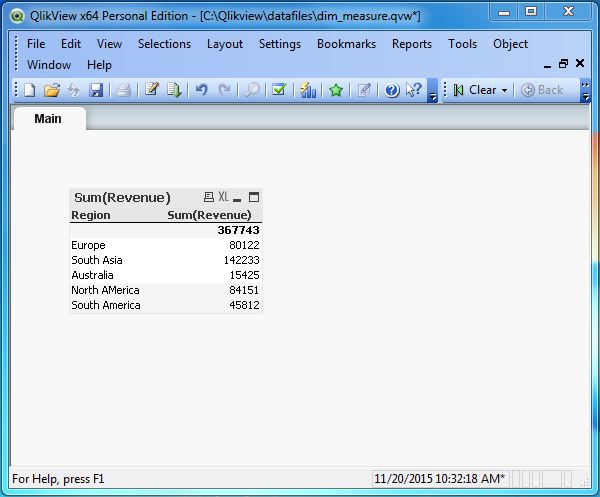
QlikView - Star Schema
A start schema model is a type of data model in which multiple dimensions are linked to a single fact table. Of course, in bigger models there can be multiple facts tables linked to multiple dimensions and other fact tables. The usefulness of this model lies in performing fast queries with minimal joins among various tables. The fact table contains data, which are measures and have numeric values. Calculations are applied on the fields in the fact table. The unique keys of the dimension tables are used in linking it to the fat table, which also has a key usually with the same field name. Therefore, the Fact table contains the keys from the entire dimension table and forms a concatenated primary key used in various queries.
Input Data
Given below is a list of tables, which contain the data for different products from various suppliers and regions. Also the supply happens at different time intervals, which are captured in the Time dimension table.
Product Dimension
It contains the Product Category and Product Names. The Product ID field is the unique Key.
ProductID,ProductCategory,ProductName
1,Outdoor Recreation,Winter Sports & Activities
2,Clothing,Uniforms
3,Lawn & Garden	Power, Equipment
4,Athletics,Rugby
5,Personal Care,Shaver
6,Arts & Entertainment,Crafting Materials
7,Hardware,Power Tool Batteries
Region Dimension
It contains the Region Names where the suppliers are based. The RegionID field is the unique Key.
RegionID,Continent,Country
3,North America, USA
7,South America, Brazil
12,Asia,China
2,Asia,Japan
5,Europe,Belgium
Supplier Dimension
It contains the Supplier Names, which supply the above products. The SupplierID field is the unique Key.
SupplierID,SupplierName
3S12,Supre Suppliers
4A15,ABC Suppliers
4S66,Max Sports
5F244,Nice Foods
8A45,Artistic angle
Time Dimension
It contains the Time periods when the supply of the above products occur. The TimeID field is the unique Key.
TimeID,Year,Month
1,2012,Feb
2,2012,May
3,2012,Sep
4,2013,Aug
5,2014,Jan
6,2014,Nov
Supplier Quantity Fact
It contains the values for the quantities supplied and percentage of defects in them. It joins to each of the above dimensions through keys with same name.
ProductID,RegionID,TimeID,SupplierID,Quantity, DefectPercentage
1,3,3,5F244,8452,12
2,3,1,4S66,5124,8.25
3,7,1,8A45,5841,7.66
4,12,2,4A15,5123,1.25
5,5,3,4S66,7452,8.11
6,2,5,4A15,5142,3.66
7,2,1,4S66,452,2.06
Load Script
The above data is loaded to QlikView memory by using the script editor. Open the Script editor from the File menu or press Control+E. Choose the Table Files option from the Data from Files tab and browse for the file containing the above data. Click OK and press Control+R to load the data into QlikView's memory. Below is the script which appears after each of the above file is read.
LOAD ProductID,
     ProductCategory,
     ProductName
FROM
[C:\Qlikview\images\StarSchema\Product_dimension.csv]
(txt, codepage is 1252, embedded labels, delimiter is ',', msq);

LOAD TimeID,
     Year,
     Month
FROM
[C:\Qlikview\images\StarSchema\Time.csv]
(txt, codepage is 1252, embedded labels, delimiter is ',', msq);

LOAD SupplierID,
     SupplierName
FROM
[C:\Qlikview\images\StarSchema\Suppliers.csv]
(txt, codepage is 1252, embedded labels, delimiter is ',', msq);

LOAD RegionID,
     Continent,
     Country
FROM
[C:\Qlikview\images\StarSchema\Regions.csv]
(txt, codepage is 1252, embedded labels, delimiter is ',', msq);

LOAD ProductID,
     RegionID,
     TimeID,
     SupplierID,
     Quantity,
     DefectPercentage
FROM
[C:\Qlikview\images\StarSchema\Supplier_quantity.csv]
(txt, codepage is 1252, embedded labels, delimiter is ',', msq);
Star Schema Data Model
After reading the above data into QlikView memory, we can look at the data model, which shows all the tables, fields, and relationship in form of a star schema.
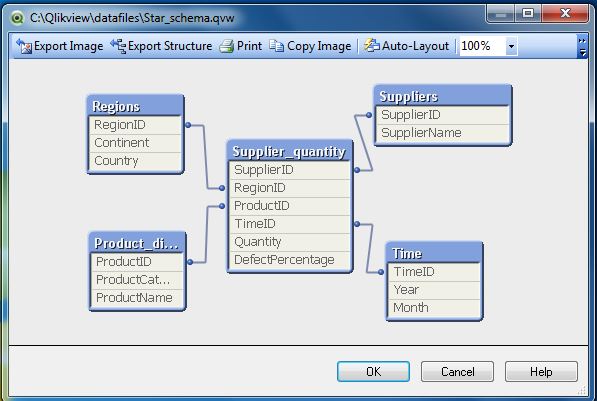
QlikView - Synthetic Key
A Synthetic Key is QlikView's solution to create an artificial key when there is ambiguity about which key to use between two tables. This situation arises when two tables have two or more fields in common. QlikView's feature of creating association in memory automatically detects this scenario and creates an additional table, which will hold the value of the new key created.
Input Data
Let us consider the following two CSV data files, which are used as input for further illustrations.
Sales:
ProductID,ProductCategory,Country,SaleAmount
1,Outdoor Recreation,Italy,4579
2,Clothing,USA,4125
3,Costumes & Accessories,South Korea,6521

Product:
ProductID, Country
3,Brazil
3,China
2,Korea
1,USA
Load Script
We load the above input data using the script editor, which is invoked by pressing Control+E. Choose the option Table Files and browse for the Input file.
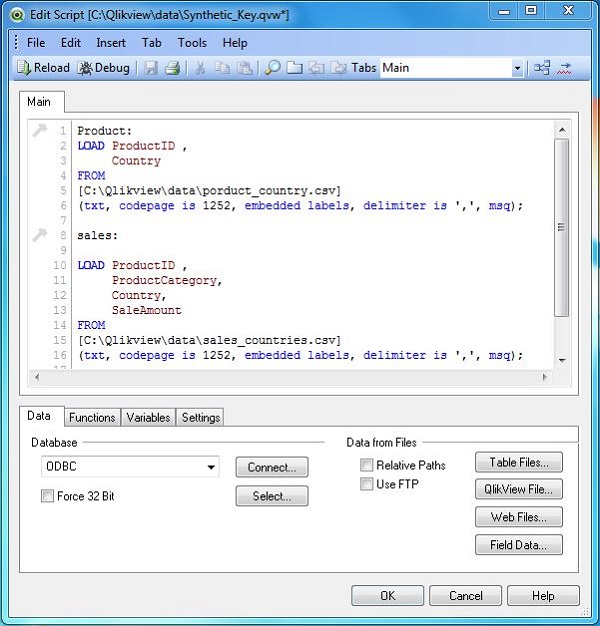
Data Model
Next, we look at the data model by using the menu command for table viewer, Control+T. The following screen comes up, which shows the creation of a third table that supplies the value of the synthetic key as both the tables have ProductID and Country as matching keys.
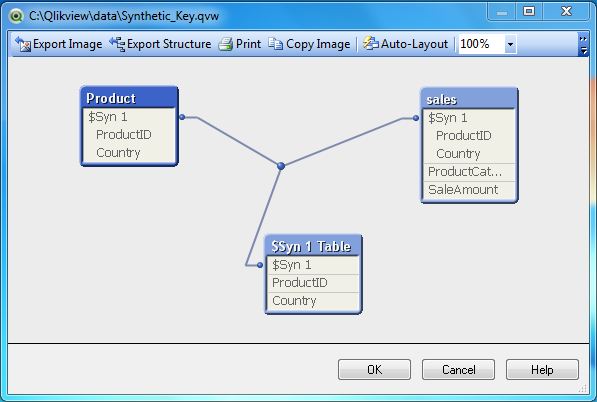
Impact of Synthetic key
Synthetic keys indicate the flaw in the data model that is being used. They do not cause any issue in the correctness of the data or performance of the report. Things will work fine if a big data model has one or two instances of synthetic keys. However, if we have too many of them, then that is an implication to redesign the data model.
QlikView - Generating Data
Many times, we need some data to be generated programmatically by the software being used, which is not coming from a source. For example, 100 random numbers or just the dates of 23rd week of a year. A data analyst may need such data to be created to perform some analysis on the data that does not contain these values as it arrived. QlikView provides a function called Autogenerate, which can be used for such requirement.
Data Requirement
Consider a scenario where we need to find only the dates, which are a Thursday or a Sunday. We need to find it for the range starting today until the end of the year. We create the following script, which will achieve this.
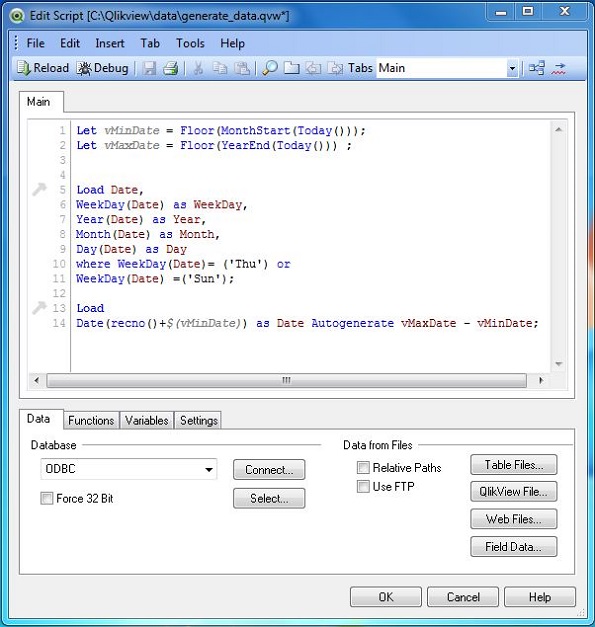
Explanation
We declare two variables to capture the first day of the current month and end of the year. Next we apply various functions and a filter condition to generate the required values. The recno() function creates one record for each of these dates. We add Autogenerate function giving the variables as the range.
Generated data
On loading the above script to QlikView's memory and creating a Table Box using the menu Layout → New Sheet Objects → Table Box, we get the data created as shown below.
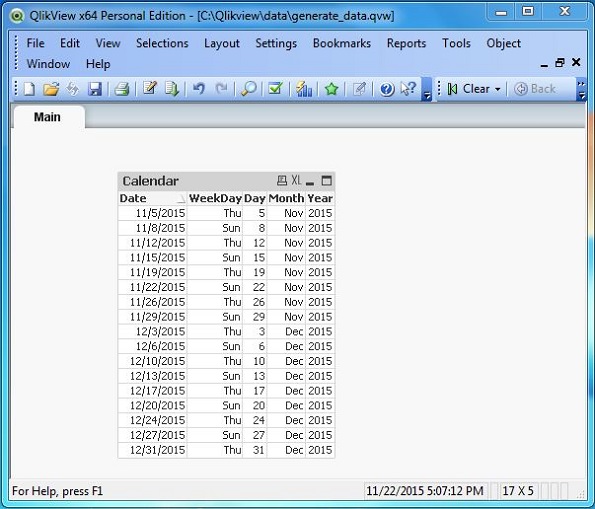
QlikView - Cross Tables
While analyzing data, we come across situations where we desire columns to become rows and vice-versa. It is not just about transposing, it also involves rolling up many columns together or repeating many values in a row many times to achieve the desired column and row layout in the table.
Input data
Consider the following input data, which shows region wise sales of a certain product for each quarter. We create a delimited file (CSV) with the below given data.
Quarter,Region1,Region2,Region 3
Q1,124,421,471
Q2,415,214,584
Q3,417,321,582
Q4,751,256,95
Loading Input Data
We load the above input data using the script editor, which is invoked by pressing Control+E. Choose the option Table Files and browse for the Input file. After choosing the options as shown below, click Next.
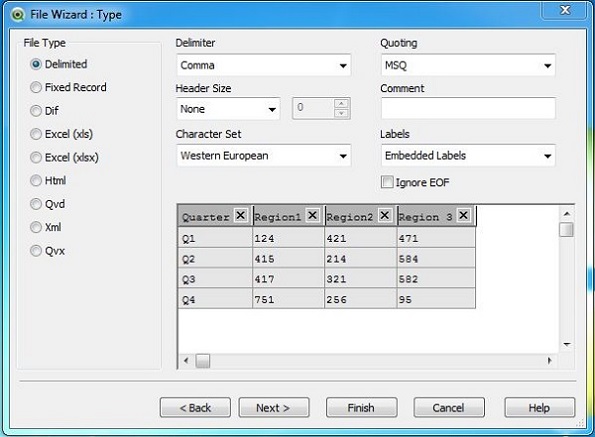
Crosstable Options
In the next window (File Wizard → Options), click on the Crosstable button. It highlights the columns in different colors. The pink color shows the qualifier field, which is going to be repeated across many rows for each value of in the Attribute Field. The cell values under the Attribute fields are taken as the data. Click OK.
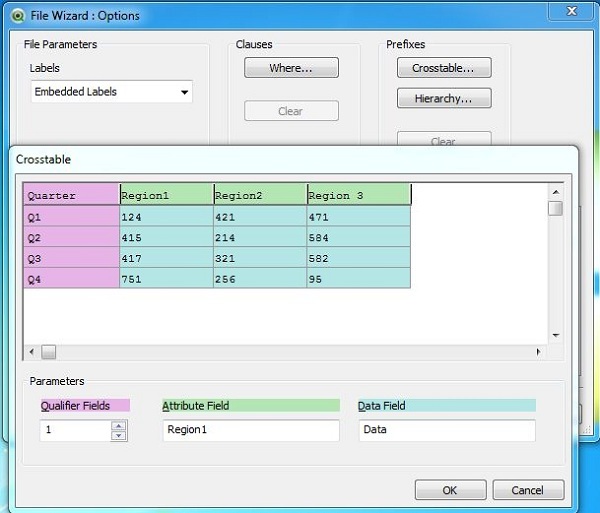
Crosstable Transformation
The transformed data appears in which all the Region fields are clubbed to one column but with values repeating for each quarter.
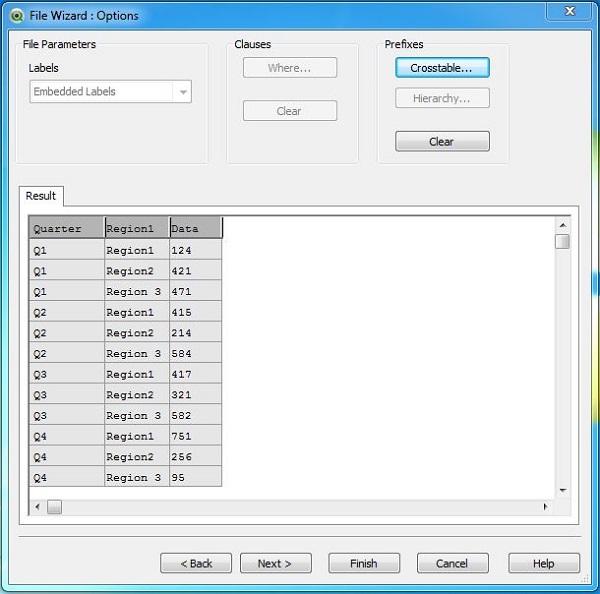
Load Script
The Load script for the crosstable transformations shows the commands given below.
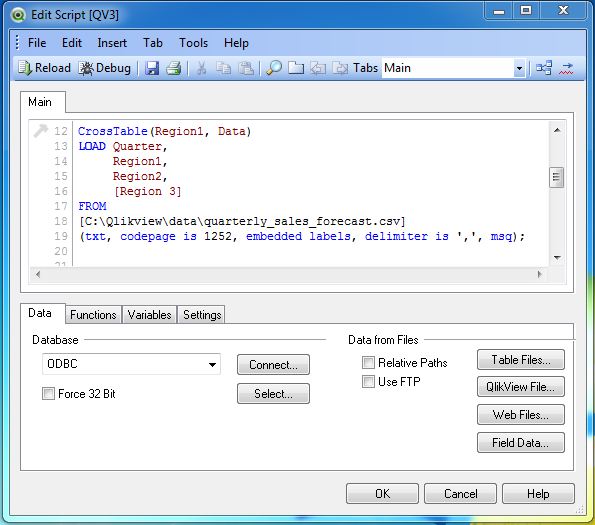
Crosstable Data
On creating a Table Box sheet object using the menu Layout → New Sheet Objects → Table Box, we get the following output.
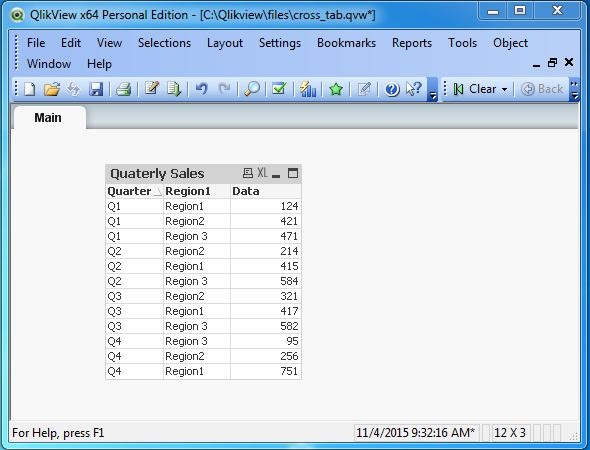
QlikView - Straight Tables
Straight Tables are most widely used sheet object to display data in QlikView. They are very simple yet powerful with features like column rearrangement, sorting and coloring the background etc.
Input Data
Let us consider the following input data, which represents the sales figure of different product lines and product categories.
Product_Line,Product_category,Value
Sporting Goods,Outdoor Recreation,5642
Food, Beverages & Tobacco,2514
Apparel & Accessories,Clothing,2365
Apparel & Accessories,Costumes & Accessories,4487
Sporting Goods,Athletics,812
Health & Beauty,Personal Care,6912
Arts & Entertainment,Hobbies & Creative Arts,5201
Arts & Entertainment,Paintings,8451
Arts & Entertainment,Musical Instruments,1245
Hardware,Tool Accessories,456
Home & Garden,Bathroom Accessories,241
Food,Drinks,1247
Home & Garden,Lawn & Garden,5462
Office Supplies,Presentation Supplies,577
Hardware,Blocks,548
Baby & Toddler,Diapering,1247
Baby & Toddler,Toys,257
Home & Garden,Pipes,1241
Office Supplies,Display Board,2177
Load Script
The above data is loaded to the QlikView memory by using the script editor. Open the Script editor from the File menu or press Control+E. Choose the "Table Files" option from the "Data from Files" tab and browse for the file containing the above data. The following screen appears.

Click "OK" and press "Control+R" to load the data into the QlikView's memory
Create Table Box
Next, we create a new sheet Object of type Table Box. We follow the menu as shown below.
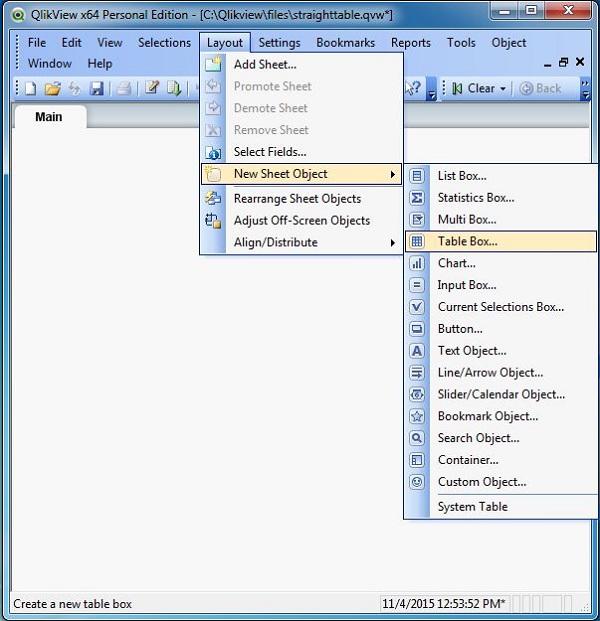
Select the Columns
QlikView prompts for the columns to be chosen which will be displayed in the final Table Box. We choose all the columns and use the Promote or Demote option to set the order of the columns.
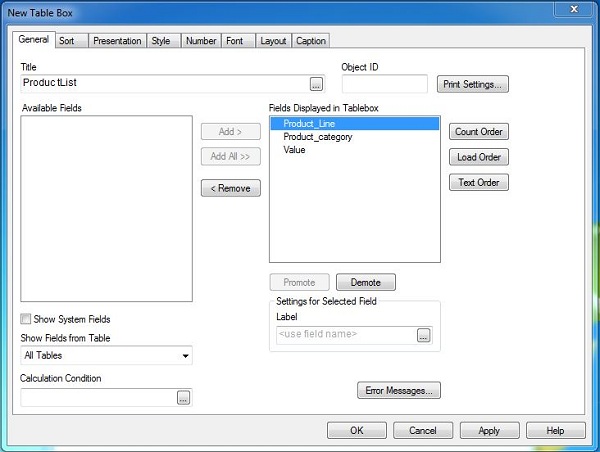
Select Display Style
Next, we choose the style tab to give specific background colors to the display data. The current style option lists many pre-built styles. We choose Pyjama Red with Stripes every two rows.
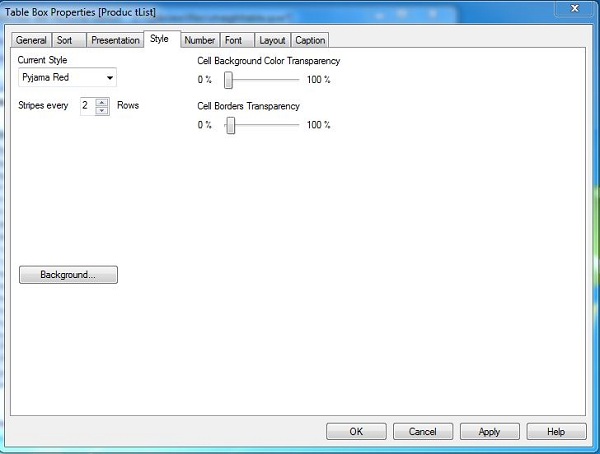
Column Re-ordering
We can reorder the positions of the columns by pressing and holding the mouse button at the column headers and then dragging it to the desired position.
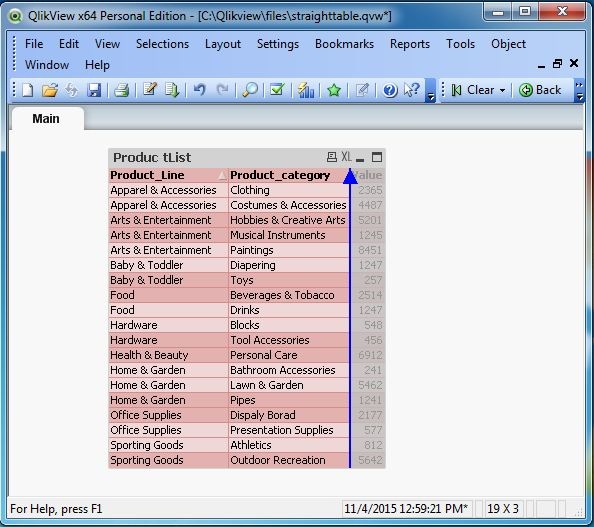
QlikView - Pivot Tables
Pivot Tables are widely used in data analysis to present sum of values across many dimensions available in the data. QlikView's Chart option has the feature to create a Pivot Table by choosing the appropriate chart type.
Input Data
Let us consider the following input data, which represents the sales figure of different product lines and product categories.
Product_Line,Product_category,Value
Sporting Goods,Outdoor Recreation,5642
Food, Beverages & Tobacco,2514
Apparel & Accessories,Clothing,2365
Apparel & Accessories,Costumes & Accessories,4487
Sporting Goods,Athletics,812
Health & Beauty,Personal Care,6912
Arts & Entertainment,Hobbies & Creative Arts,5201
Arts & Entertainment,Paintings,8451
Arts & Entertainment,Musical Instruments,1245
Hardware,Tool Accessories,456
Home & Garden,Bathroom Accessories,241
Food,Drinks,1247
Home & Garden,Lawn & Garden,5462
Office Supplies,Presentation Supplies,577
Hardware,Blocks,548
Baby & Toddler,Diapering,1247
Baby & Toddler,Toys,257
Home & Garden,Pipes,1241
Office Supplies,Display Board,2177
Load Script
The above data is loaded to the QlikViews memory by using the script editor. Open the Script editor from the File menu or press Control+E. Choose the "Table Files" option from the "Data from Files" tab and browse for the file containing the above data. The following screen appears.
Click "OK" and press "Control+R" to load the data into QlikView's memory.
Select Chart Type
Next, we use the chart wizard to select the Pivot Table option. Click Next.
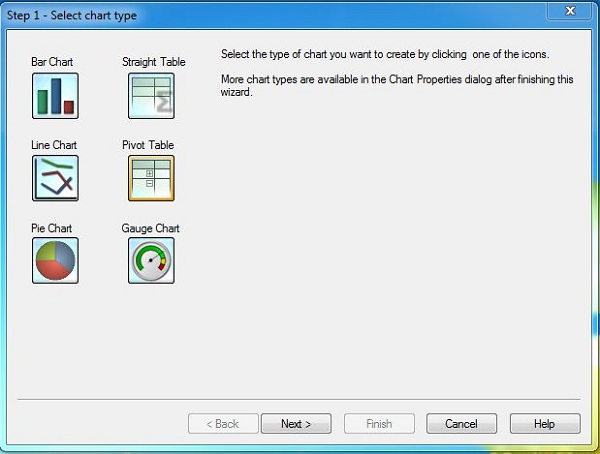
Select Chart Dimension
In the next screen, we choose Product_Line as the first dimension for the chart.
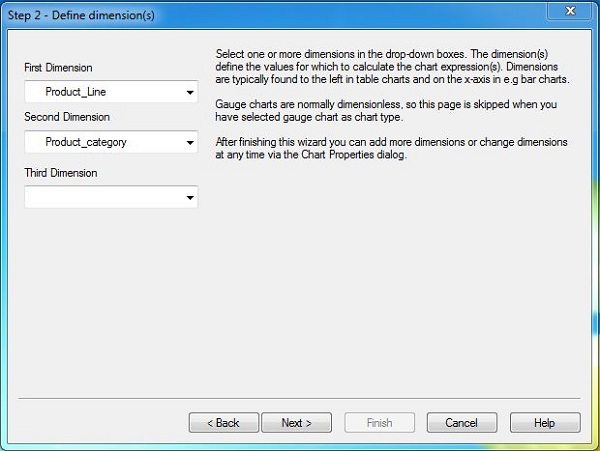
Select Chart Expression
The next screen prompts us for selecting the chart expression where we choose the sum of value.
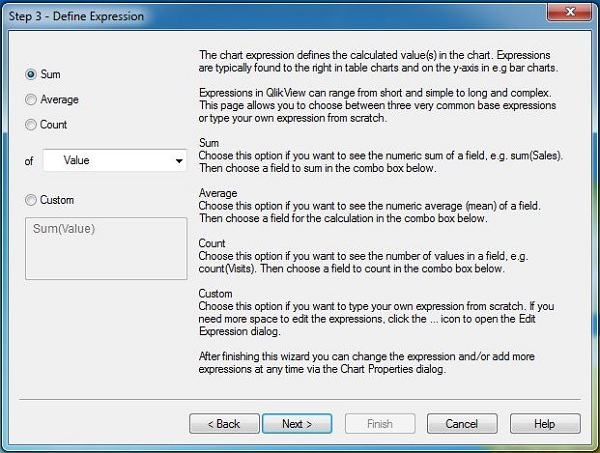
Select the Chart Format
On clicking next, we get the screen to choose chart format in which we select Pyjama Green as the style and the default mode.
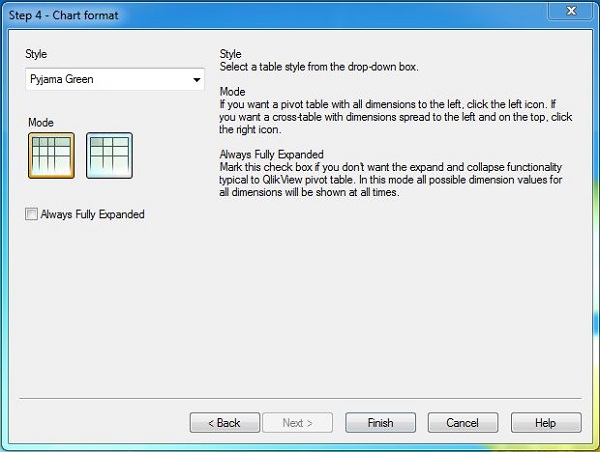
Pivot Chart Data
Completing the above steps gives us the final chart as below.
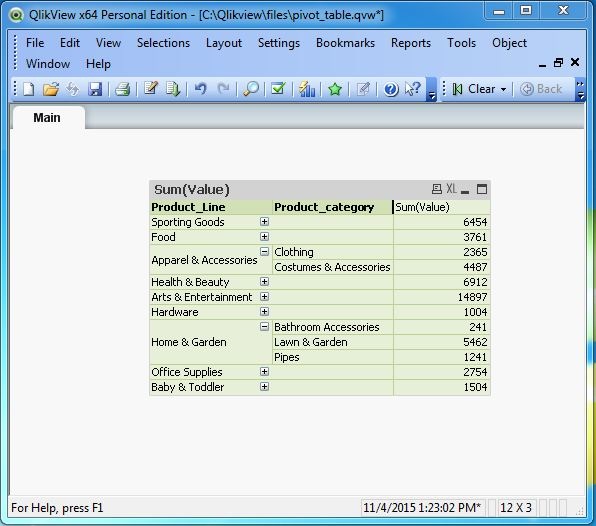
QlikView - Set Analysis
QlikView's Set Analysis feature is used to segregate the data in different sheet objects into many sets and keeps the values unchanged in some of them. In simpler terms, it creates an option to not associate some sheet objects with others while the default behavior is all sheet objects get associated with each other. This helps in filtering the data in one sheet object and seeing the corresponding result in others, while the sheet object chosen as a different set displays values as per its own filters.
Input Data
Let us consider the following input data, which represents the sales figure of different product lines and product categories.
Product_Line,Product_category,Month,Value
Arts & Entertainment,Hobbies & Creative Arts,Jan,5201
Arts & Entertainment,Paintings,Feb,8451
Arts & Entertainment,Musical Instruments,Jan,1245
Baby & Toddler,Diapering,Mar,1247
Baby & Toddler,Toys,Dec,257
Apparel & Accessories,Clothing,Feb,574
Apparel & Accessories,Costumes & Accessories,Apr,1204
Arts & Entertainment,Musical Instruments,Apr,3625
Baby & Toddler,Diapering,Apr,1281
Apparel & Accessories,Clothing,Jul,2594
Arts & Entertainment,Paintings,Sep,6531
Baby & Toddler,Toys,May,7421
Apparel & Accessories,Clothing,Aug,2541
Arts & Entertainment,Paintings,Oct,2658
Arts & Entertainment,Musical Instruments,Mar,1185
Baby & Toddler,Diapering,Jun,1209
Load Script
The above data is loaded to QlikView memory by using the script editor. Open the Script editor from the File menu or press Control+E. Choose the "Table Files" option from the "Data from Files" tab and browse for the file containing the above data. A screen appears as shown below.
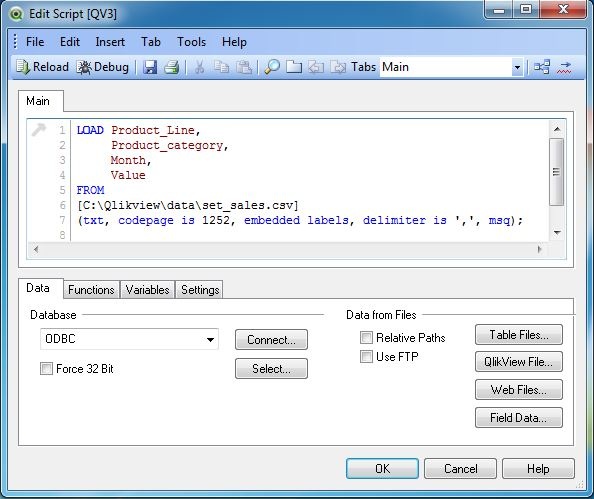
Create Table Box
Choose all the fields available to create a table box using the menu option Layout → New Sheet Objects → Table Box and a list box containing the months field using the menu option Layout → New Sheet Objects → List Box. Also, create a straight table chart showing the total sales under each product category.
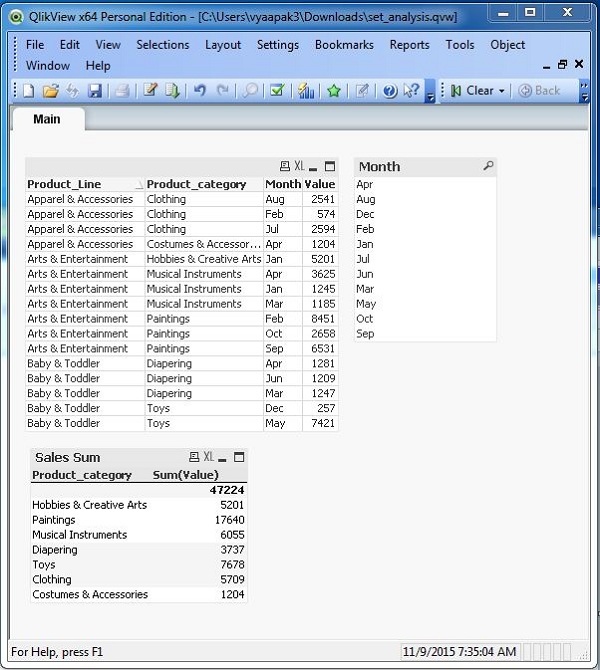
Data Association
Now we can observe the association between these three sheet objects by selecting some values in one of them. Let us select the month Apr and Jan from the Month list Box. We can see the change in values in the Table Box and chart showing the related values.
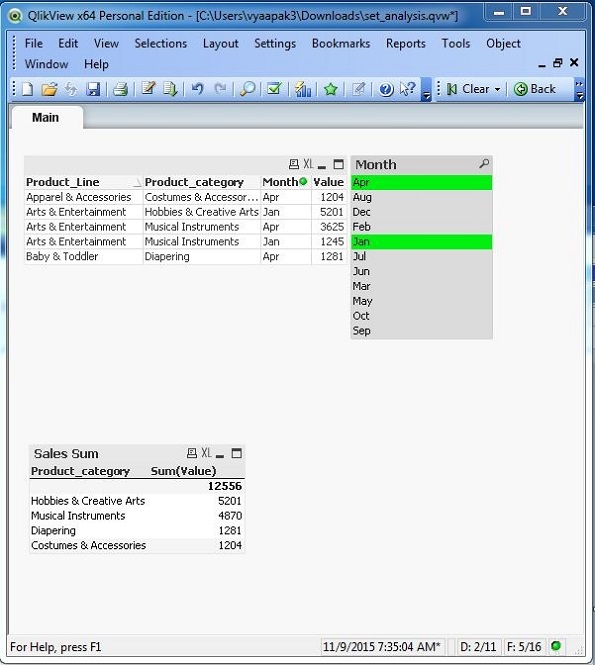
Clone Object
Next, we clone the sales sum chart to produce a new set of data not associated with other sheet objects. Right click on the chart Sales Sum and click on the option Clone as shown below. Another copy of the same chart appears in the QlikView document.
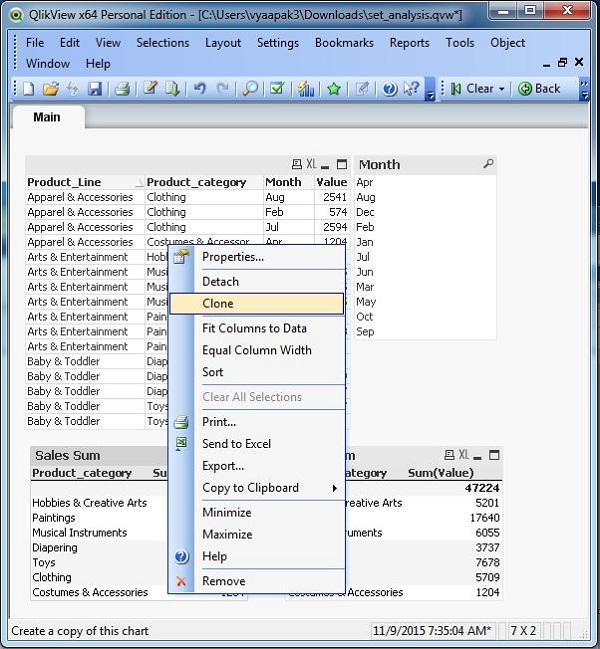
Set Expression
Next, we choose the second copy of the chart Sales Sum and right click it to get the chart properties. We create an expression called Sales values writing the formula under the Definition tab as shown below.
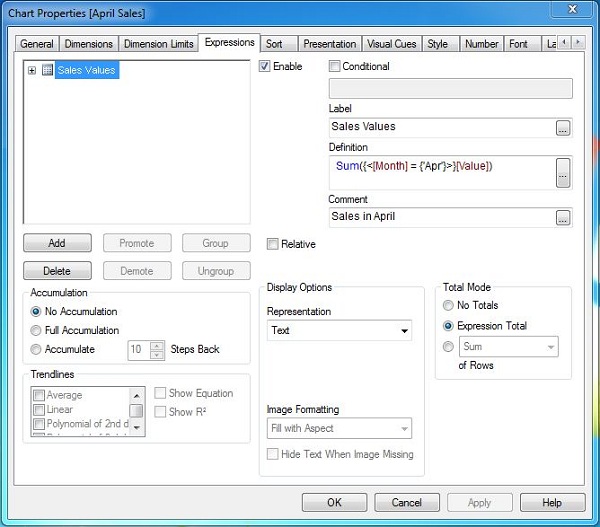
Applying Set Analysis
On completing the above given steps, we find that when we select the month June we get the associated values in the Table Box and Sales Sum chart. However, the April sales does not change as it is based on the data from the set expression.
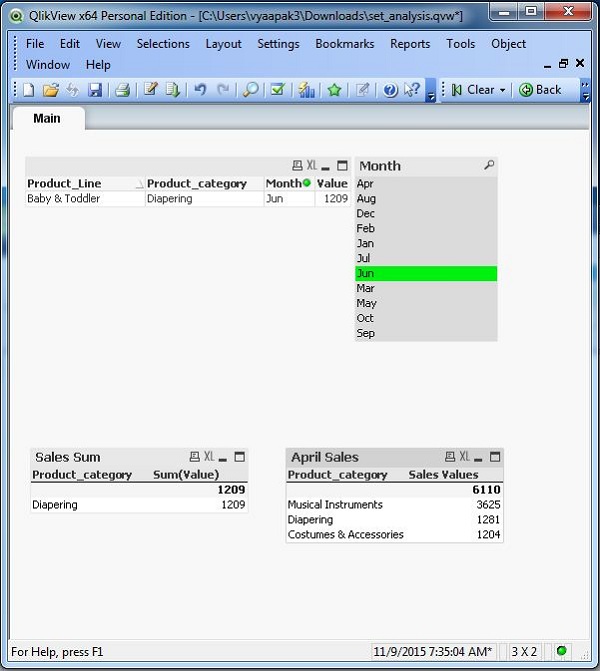
QlikView - Joins
Joins in QlikView are used to combine data from two data sets into one. Joins in QlikView mean the same as in joins in SQL. Only the column and row values that match the join conditions are shown in the output. In case you are completely new to joins, you may like to first learn about them here.
Input Data
Let us consider the following two CSV data files, which are used as input for further illustrations.
Product List:
ProductID,ProductCategory
1,Outdoor Recreation
2,Clothing
3,Costumes & Accessories
4,Athletics
5,Personal Care
6,Hobbies & Creative Arts

ProductSales:
ProductID,ProductCategory,SaleAmount
4,Athletics,1212
5,Personal Care,5211
6,Hobbies & Creative Arts,1021
7,Display Board,2177
8,Game,1145
9,soap,1012
10,Beverages & Tobacco,2514
Inner Join
We load the above input data using the script editor, which is invoked by pressing Control+E. Choose the option Table Files and browse for the Input file. Then we edit the commands in the script to create an inner join between the tables.
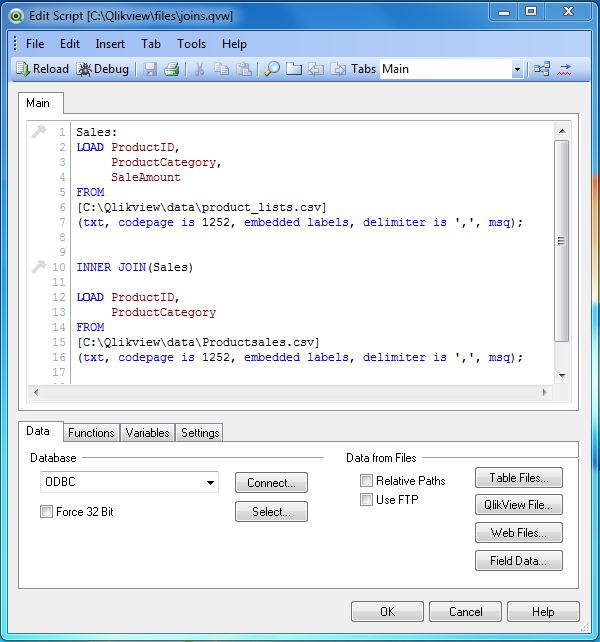
Inner join fetches only those rows, which are present in both the tables. In this case, the rows available in both Product List and Product Sales table are fetched. We create a Table Box using the menu Layout → New Sheet Objects → Table Box where we choose all the three fields - ProductID, ProductCategory and SaleAmount to be displayed.
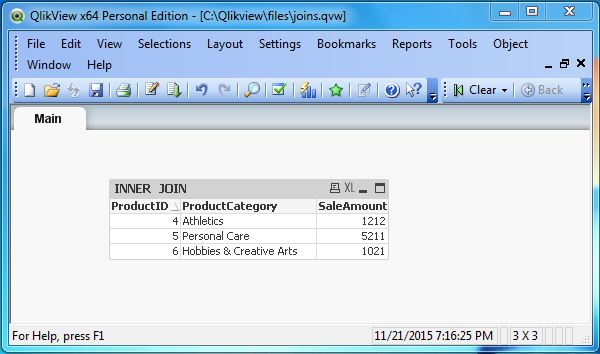
Left Join
Left join involves fetching all the rows from the table in the left and the matching rows from the table in the right.
Load Script
Sales:
LOAD ProductID,
     ProductCategory,
     SaleAmount
FROM
[C:\Qlikview\data\product_lists.csv]
(txt, codepage is 1252, embedded labels, delimiter is ',', msq);

LEFT JOIN(Sales)

LOAD ProductID,
     ProductCategory
FROM
[C:\Qlikview\data\Productsales.csv]
(txt, codepage is 1252, embedded labels, delimiter is ',', msq);
We create a Table Box using the menu Layout → New Sheet Objects → Table Box, where we choose all the three fields − ProductID, ProductCategory and SaleAmount to be displayed.
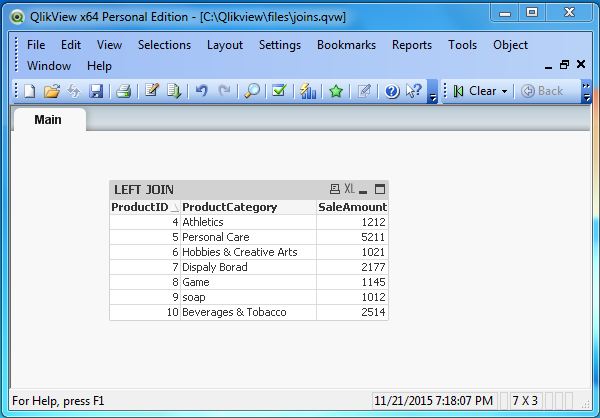
Right Join
Right join involves fetching all the rows from the table in the right and the matching rows from the table in the left.
Load Script
Sales:
LOAD ProductID,
     ProductCategory,
     SaleAmount
FROM
[C:\Qlikview\data\product_lists.csv]
(txt, codepage is 1252, embedded labels, delimiter is ',', msq);

RIGHT JOIN(Sales)

LOAD ProductID,
     ProductCategory
FROM
[C:\Qlikview\data\Productsales.csv]
(txt, codepage is 1252, embedded labels, delimiter is ',', msq);
We create a Table Box using the menu Layout → New Sheet Objects → Table Box, where we choose all the three fields - ProductID, ProductCategory and SaleAmount to be displayed.
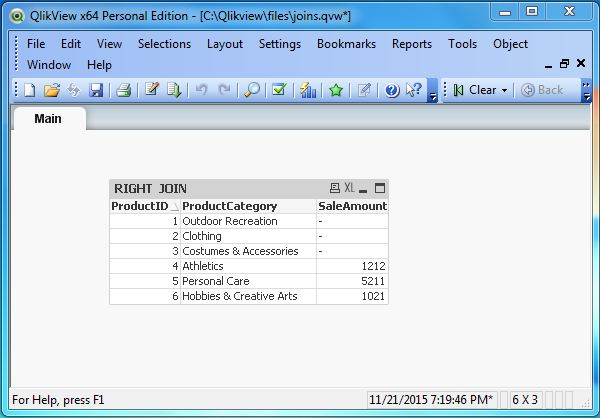
Outer Join
Outer join involves fetching all the rows from the table in the right as well as from the table in the left.
Load Script
Sales:
LOAD ProductID,
     ProductCategory,
     SaleAmount
FROM
[C:\Qlikview\data\product_lists.csv]
(txt, codepage is 1252, embedded labels, delimiter is ',', msq);

OUTER JOIN(Sales)

LOAD ProductID,
     ProductCategory
FROM
[C:\Qlikview\data\Productsales.csv]
(txt, codepage is 1252, embedded labels, delimiter is ',', msq);
We create a Table Box using the menu Layout → New Sheet Objects → Table Box where we choose all the three fields - ProductID, ProductCategory and SaleAmount to be displayed.
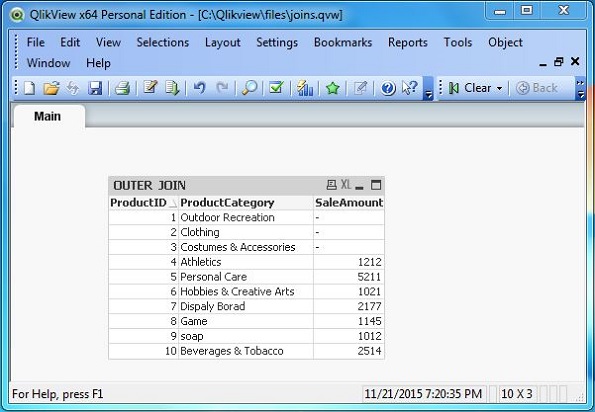
QlikView - Keeps
The keep command in QlikView is used to combine data from two data sets keeping both the data sets available in memory. It is very similar to joins we covered in the previous chapter except for two major differences. First difference is − in case of keep; both the datasets are available in QlikView's memory while in join the load statements produce only one data set from which you have to choose the columns. The second difference being − there is no concept of outer keep where as we have outer join available in case of joins.
Input Data
Let us consider the following two CSV data files, which are used as input for further illustrations.
Product List:
ProductID,ProductCategory
1,Outdoor Recreation
2,Clothing
3,Costumes & Accessories
4,Athletics
5,Personal Care
6,Hobbies & Creative Arts

Product Sales:
ProductID,ProductCategory,SaleAmount
4,Athletics,1212
5,Personal Care,5211
6,Hobbies & Creative Arts,1021
7,Display Board,2177
8,Game,1145
9,soap,1012
10,Beverages & Tobacco,2514
Inner Keep
We load the above input data using the script editor, which is invoked by pressing Control+E. Choose the option Table Files and browse for the Input file. Then we edit the commands in the script to create an inner keep between the tables.
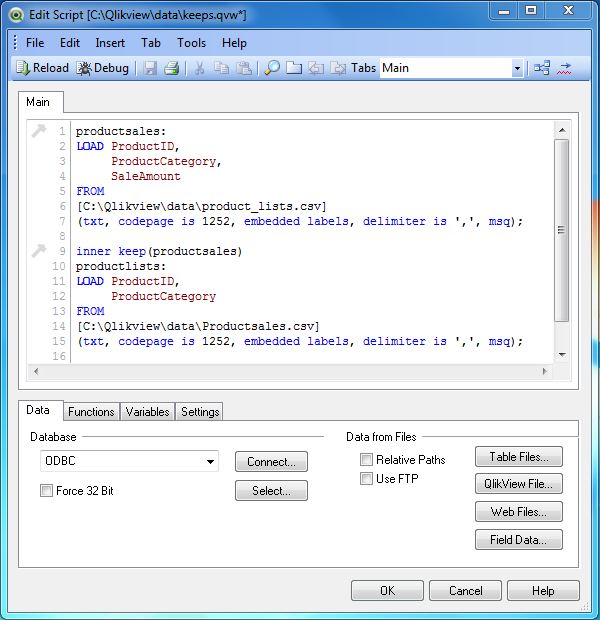
Inner keep fetches only those rows, which are present in both the tables. In this case, the rows available in both Product List and Product Sales table are fetched. We create a Table Boxes using the menu Layout → New Sheet Objects → Table Box.
First, we choose only the productSales table, which gives us the fields - ProductID, ProductCategory and SaleAmount to be displayed.
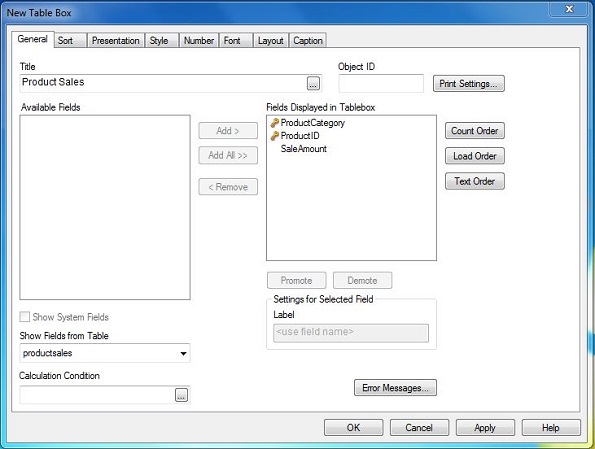
Next, we choose the ProductList data set, which gives us the fields ProductID and ProductCategory.
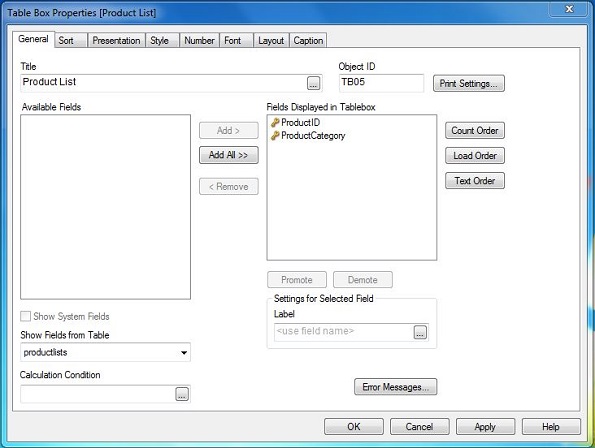
Finally, we choose the All Tables option and get all the available fields from all the tables.
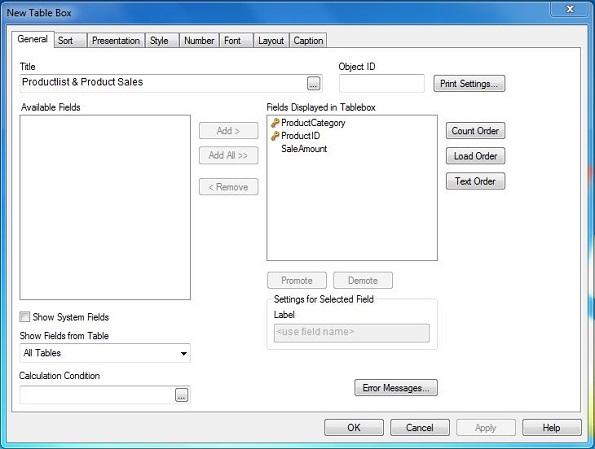
The following report shows all the Tables Boxes from the above given steps.
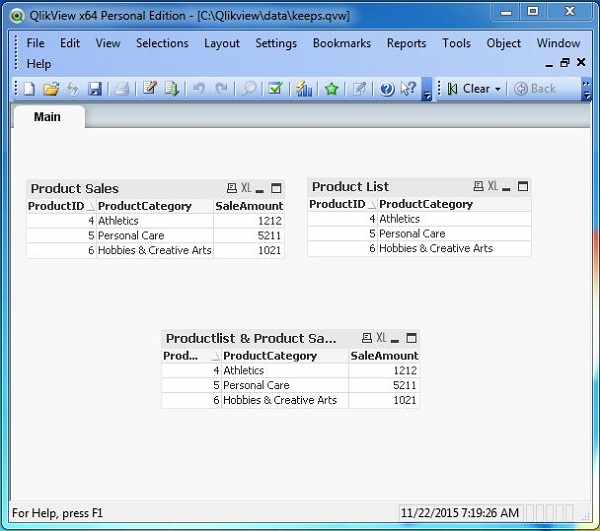
Left Keep
Left keep is similar to left join, which keeps all the rows from the table in the left along with both the data set being available in QlikView's memory.
Left keep Script
The following script is used to create the resulting data sets with left keep command.
productsales:
LOAD ProductID,
     ProductCategory,
     SaleAmount
FROM
[C:\Qlikview\data\product_lists.csv]
(txt, codepage is 1252, embedded labels, delimiter is ',', msq);

left keep(productsales)
productlists:
LOAD ProductID,
     ProductCategory
FROM
[C:\Qlikview\data\Productsales.csv]
(txt, codepage is 1252, embedded labels, delimiter is ',', msq);
Left keep Data
When we change the script as above and refresh the data in the report using Control+R, we get the following data in the sheet objects.
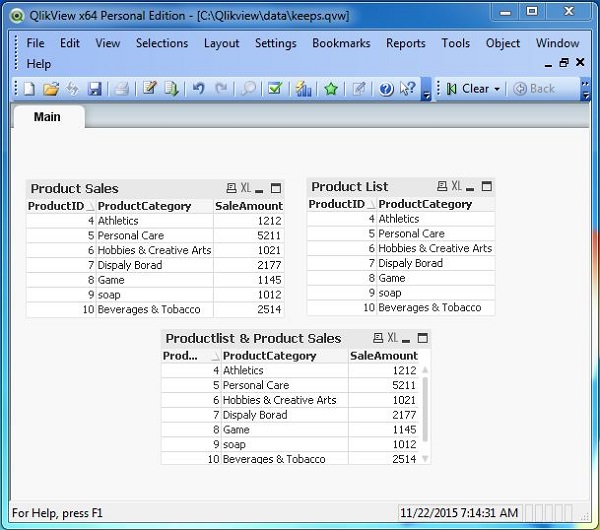
Right Keep
Right keep is similar to left join, which keeps all the rows from the table in the right along with both the data set being available in QlikView's memory.
Right keep Script
The following script is used to create the resulting data sets with left keep command.
productsales:
LOAD ProductID,
     ProductCategory,
     SaleAmount
FROM
[C:\Qlikview\data\product_lists.csv]
(txt, codepage is 1252, embedded labels, delimiter is ',', msq);

right keep(productsales)
productlists:
LOAD ProductID,
     ProductCategory
FROM
[C:\Qlikview\data\Productsales.csv]
(txt, codepage is 1252, embedded labels, delimiter is ',', msq);
Right keep data
When we change the script as above and refresh the data in the report using Control+R, we get the following data in the sheet objects.
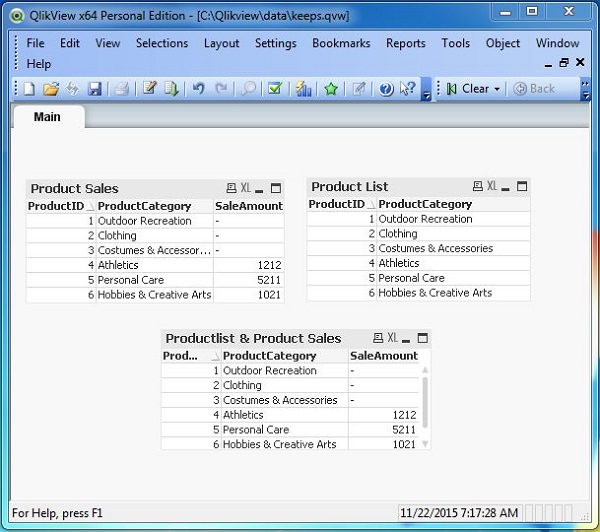
QlikView - Concatenation
Concatenation feature in QlikView is used to append the rows from one table to another. It happens even when the tables have different number of columns. It differs from both Join and Keep command, as it does not merge the matching rows from two tables into one row.
Input Data
Let us consider the following two CSV data files, which are used as input for further illustrations. Please note the second data set has an additional column named Country.
SalesRegionOld.csv
ProductID,ProductCategory,Region,SaleAmount
1,Outdoor Recreation,Europe,4579
2,Clothing,Europe,4125
3,Costumes & Accessories,South Asia,6521
4,Athletics,South Asia,4125
5,Personal Care,Australia,5124
6,Arts & Entertainment,North AMerica,1245
7,Hardware,South America,456

SalesRegionNew.csv
ProductID,ProductCategory,Region,Country,SaleAmount
6,Arts & Entertainment,North AMerica,USA,1245
7,Hardware,South America,Brazil,456
8,Home & Garden,South America,Brazil,241
9,Food,South Asia,Singapore,1247
10,Home & Garden,South Asia,China,5462
11,Office Supplies,Australia,Australia,577
Load Script
We load the above input data using the script editor, which is invoked by pressing Control+E. Choose the option Table Files and browse for the Input file. Then we edit the commands in the script to apply the concatenation between the tables.
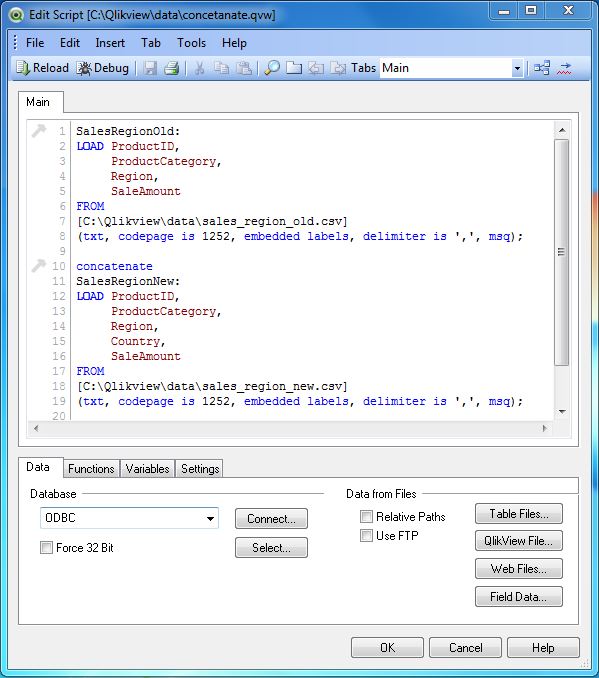
Next, we load the above data to QlikView's memory and create a Table Box by using the menu Layout → New Sheet Objects → Table Box where we choose all the available fields to be displayed as shown below.
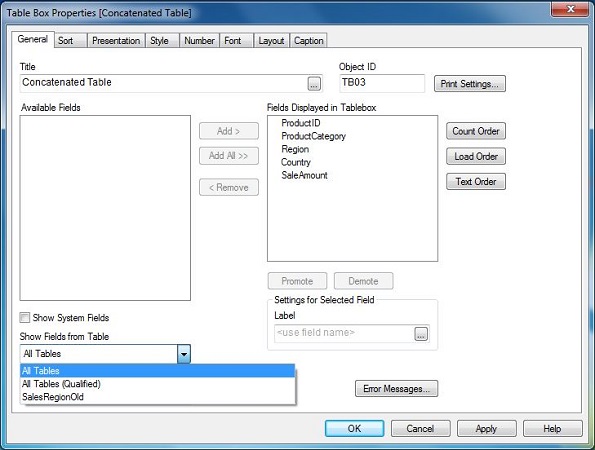
Concatenated Data
Completing above steps we get the Table box displayed as shown below. Please note the duplicate rows for the product ID 6 and 7. Concatenate does not eliminate the duplicates.
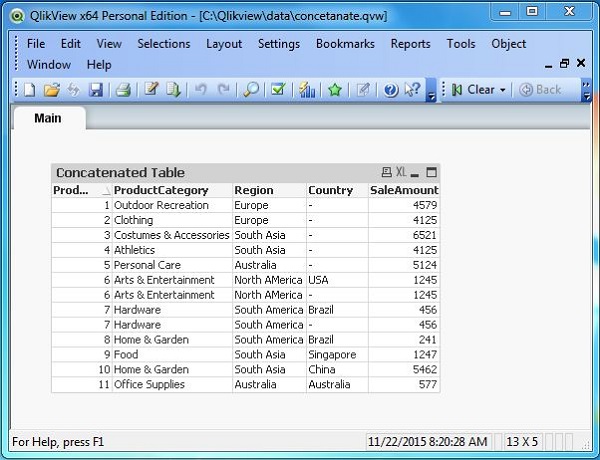
QlikView - Master Calendar
In QlikView, many times we need to create a calendar reference object, which can be linked to any data set present in QlikView's memory. For example, you have a table that captures the sales amount and sales date but does not store the weekday or quarter, which corresponds to that date. In such a scenario, we create a Master Calendar which will supply the additional date fields like Quarter, Day etc. as required by any data set.
Input Data
Let us consider the following CSV data files, which are used as input for further illustrations.
SalesDate,SalesVolume
3/28/2012,3152
3/30/2012,2458
3/31/2012,4105
4/8/2012,6245
4/10/2012,5816
4/11/2012,3522
Load Script
We load the above input data using the script editor, which is invoked by pressing Control+E. Choose the option Table Files and browse for the Input file.
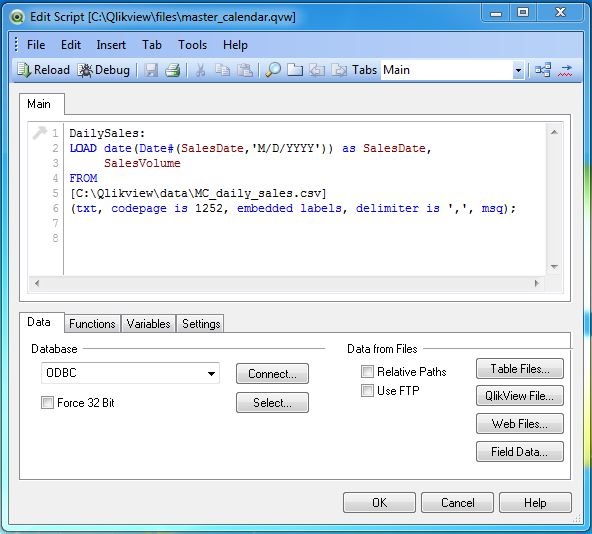
Next, we load the above data to QlikView's memory and create a Table Box by using the menu Layout → New Sheet Objects → Table Box where we choose all the available fields to be displayed as shown below.
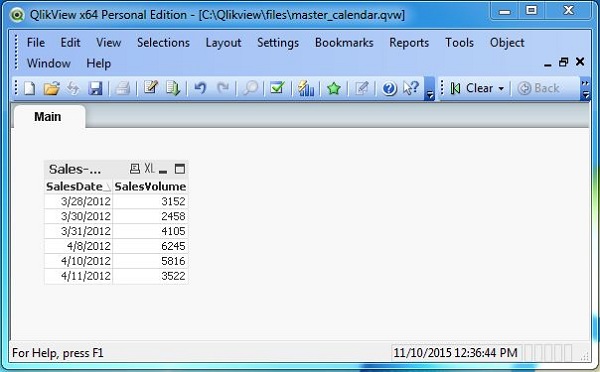
Create Master Calendar
Next, we create the Master Calendar by writing the following script in the script editor. Here we use the table DailySales as a resident table from which we capture the Maximum and Minimum dates. We load each of the dates within this range using the second load statement above the resident load. Finally, we have a third load statement, which extracts the year, quarter, month etc. from the SalesDate values.
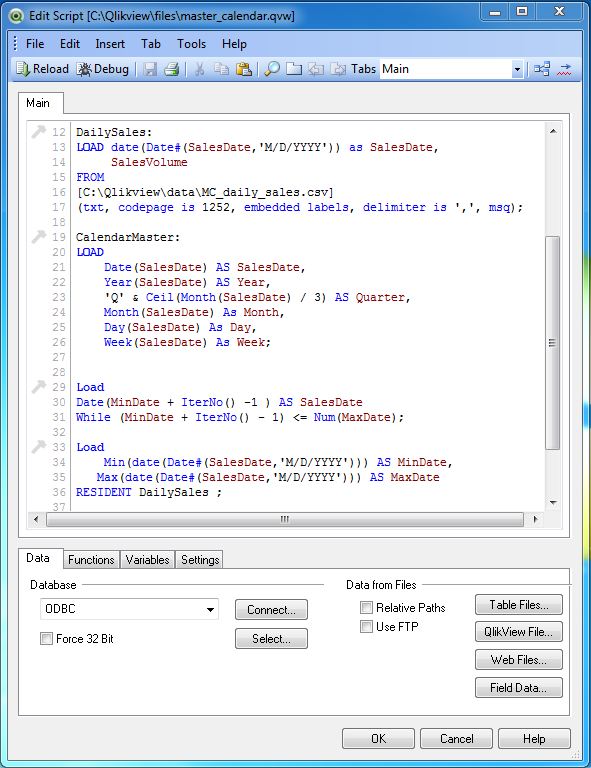
Select Fields
After creation of the complete load script along with the master calendar, we create a table box to view the data using the menu Layout → New Sheet Objects → Table Box
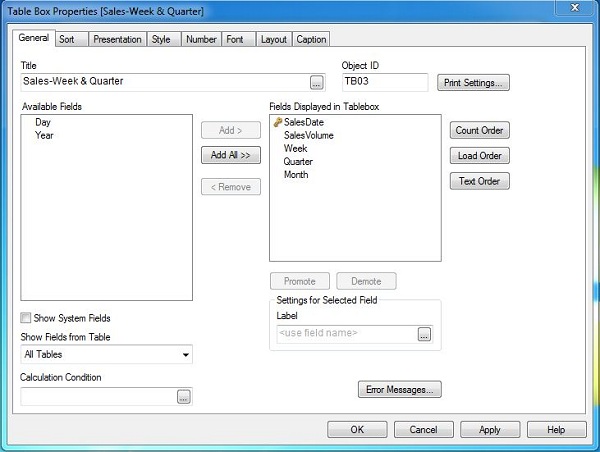
Final Data
The final output shows the table showing the Quarter and Month values, which are created using the Sales data and Master Calendar.
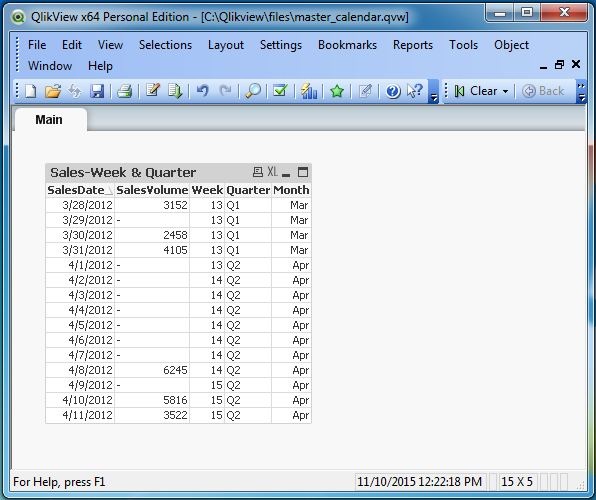
QlikView - Mapping Tables
Mapping table is a table, which is created to map the column values between two tables. It is also called a Lookup table, which is only used to look for a related value from some other table.
Input Data
Let us consider the following input data file, which represents the sales values in different regions.
ProductID,ProductCategory,Region,SaleAmount
1,Outdoor Recreation,Europe,4579
2,Clothing,Europe,4125
3,Costumes & Accessories,South Asia,6521
4,Athletics,South Asia,4125
5,Personal Care,Australia,5124
6,Arts & Entertainment,North AMerica,1245
7,Hardware,South America,456
8,Home & Garden,South America,241
9,Food,South Asia,1247
10,Home & Garden,South Asia,5462
11,Office Supplies,Australia,577
The following data represents the countries and their regions.
Region,Country
Europe,Germany
Europe,Italy
South Asia,Singapore
South Asia,Korea
North AMerica,USA
South America,Brazil
South America,Peru
South Asia,China
South Asia,Sri Lanka
Load Script
The above data is loaded to QlikView memory by using the script editor. Open the Script editor from the File menu or press Control+E. Choose the Table Files option from the Data from Files tab and browse for the file containing the above data. Click OK and ess Control+R to load the data into the QlikView's memory.
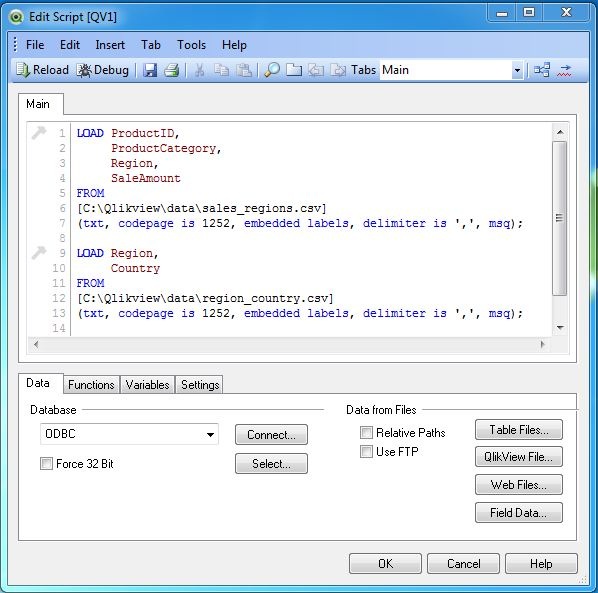
Create Table Box
Let us create two table boxes for each of the above table as shown below. Here we cannot get the value of country in the Sales region report.
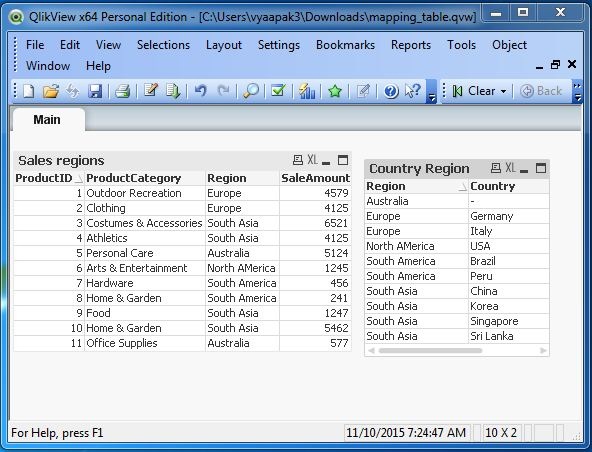
Create the Mapping Table
The following script produces the mapping table, which maps the region value from the sales table with the country value from the MapCountryRegion table.
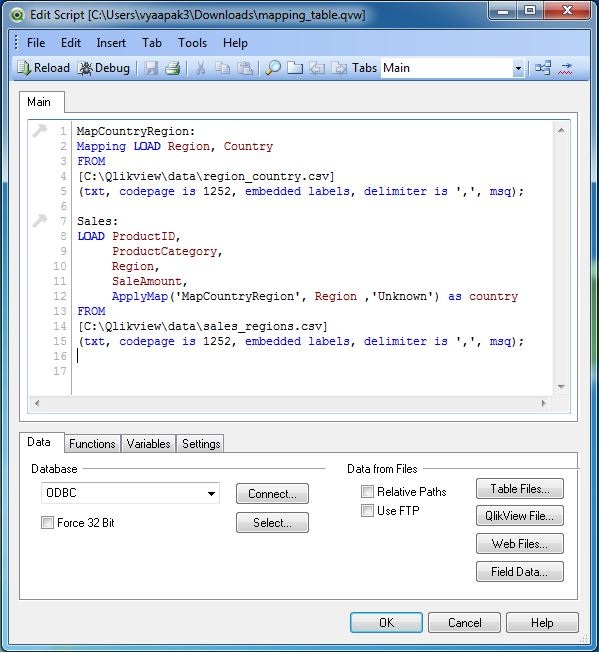
Table Chart
On completing the above steps and creating a Table box to view the data, we get the country columns along with other columns from Sales table.
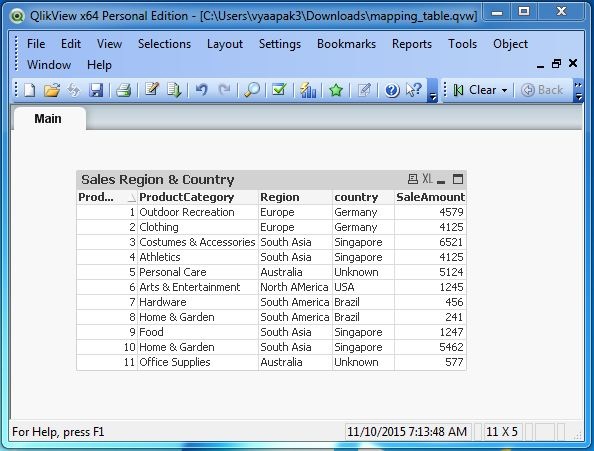
QlikView - Circular Reference
Circular Reference occurs when we can traverse from one table to another using two or more different paths. This means you can join Table1 with Table2 directly using a column or you can also first join Table1 with Table3 and then table3 with Table2. This can lead to incorrect result in the output formed by a data model, which loads all these three tables. QlikView prevents the load of such data into its memory once it recognizes a circular reference.
Input Data
Let us consider the following three CSV data files, which are used as input for further illustrations.
SalesCountries:
ProductID,ProductCategory,Country,SaleAmount
1,Outdoor Recreation,Italy,4579
2,Clothing,USA,4125
3,Costumes & Accessories,South Korea,6521
4,Athletics,Japan,4125
5,Personal Care,Brazil,5124
6,Arts & Entertainment,China,1245
7,Hardware,South America,456
8,Home & Garden,Peru,241
9,Food,India,1247
10,Home & Garden,Singapore,5462
11,Office Supplies,Hungary,577

ProductCountry:
ProductID, Country
3,Brazil
3,China
2,Korea
1,USA
2,Singapore
7,Sri Lanka
1,Italy
Load Script
We load the above input data using the script editor, which is invoked by pressing Control+E. Choose the option Table Files and browse for the Input file.
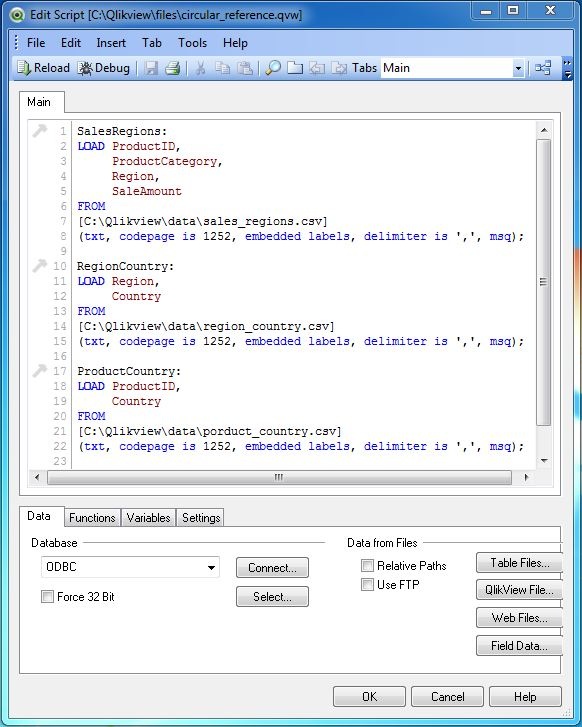
Data Load
After creating the above script, we load the data to QlikView's memory using the command Control+R. This is when we get the error prompt mentioning the presence of circular loop in the tables getting loaded.
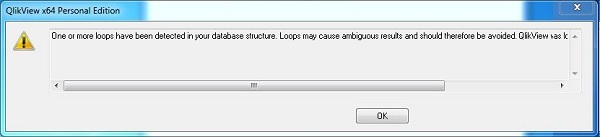
Data Model
To find the exact cause of the above warning we can look at the data model by using the menu command for table viewer - Control+T. The following screen comes up, which clearly shows the circular reference. Here the join between RegionCountry and SalesRegion can be directly achieved using the field Region. It can also be achieved by first going to the table ProductCountry, using the field Country and then mapping ProdcutID with Salesregion.
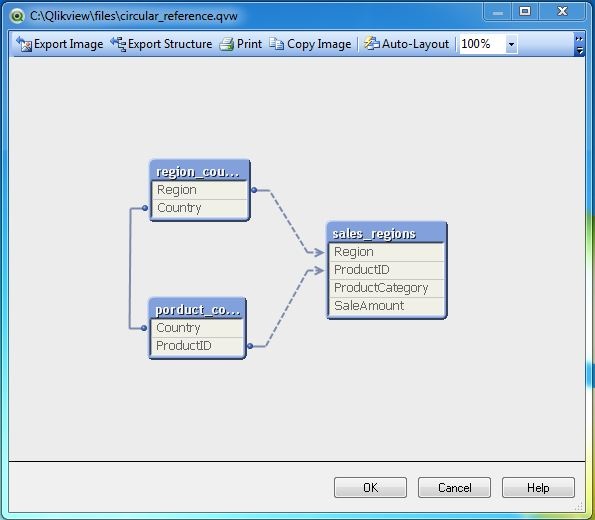
Resolving Circular Reference
The above circular reference can be resolved by renaming some of the columns in the data sets so that QlikView does not form an association between the tables automatically using the column names. For this, we will rename country column in RegionCountry to SalesCountry. In the data set ProdcuCountry, we rename the Country column to ProductCountry.
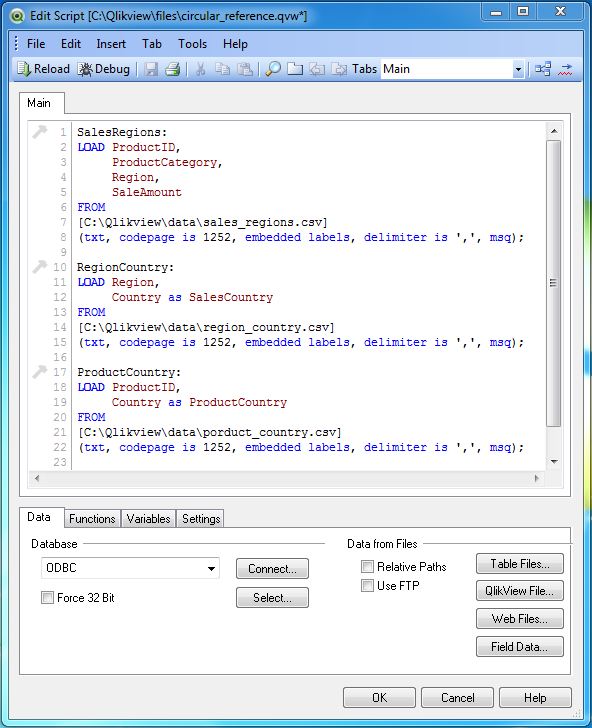
Rectified Data Model
The Rectified data model after renaming the column above can be seen using the command Control+T. Now we can see that the relationship between the tables does not form a loop.
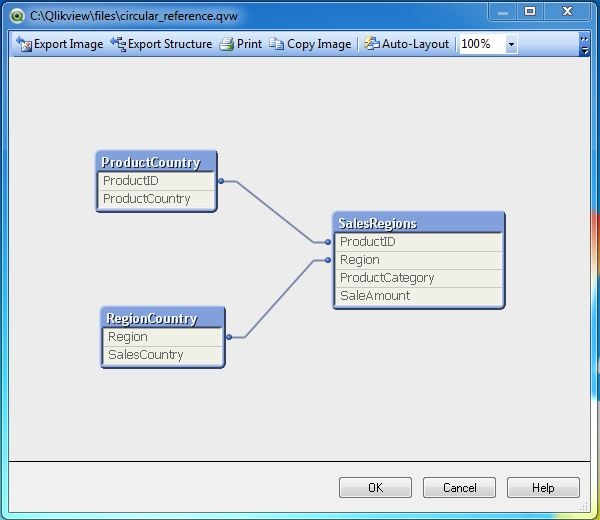
Pressing Control+R to reload the data does not give us the warning anymore and we can use this data to create reports.
