- QlikView - Home
- QlikView - Overview
- QlikView - Desktop Installation
- QlikView - Architecture
- QlikView - Navigation
- QlikView - Excel file
- QlikView - Delimited file
- QlikView - XML file
- QlikView - Web file
- QlikView - Database
- QlikView - Inline Data
- QlikView - Resident Load
- QlikView - Preceding Load
- QlikView - Incremental Load
- QlikView - Data - files(QVD)
- QlikView Report Interface
- QlikView - Sheet and Objects
- QlikView - Scripting
- Qlikview - Functions
- QlikView - IntervalMatch
- QlikView - Aggregate Functions
- QlikView - Match Function
- QlikView - Rank Function
- QlikView - Peek Function
- QlikView - RangeSum Function
- QlikView - Documents
- QlikView - List Box
- QlikView - Multi Box
- QlikView - Text Object
- QlikView - Bar Chart
- QlikView - Pie Chart
- QlikView - Dashboard
- QlikView Data Transformation
- QlikView - Transformation Wizard
- QlikView - Fill Function
- QlikView - Column Manipulation
- QlikView - Rotating Tables
- QlikView Data Model
- QlikView - Dimensions & measures
- QlikView - Star Schema
- QlikView - Synthetic Key
- QlikView - Generating Data
- QlikView Data Analysis
- QlikView - Cross Tables
- QlikView - Straight Tables
- QlikView - Pivot Tables
- QlikView - Set Analysis
- QlikView - Joins
- QlikView - Keeps
- QlikView - Concatenation
- QlikView - Master Calendar
- QlikView - Mapping Tables
- QlikView - Circular Reference
- Qlikview Useful Resources
- Qlikview - Questions/Answers
- Qlikview - Quick Guide
- Qlikview - Useful Resources
- Qlikview - Discussion
QlikView - Rotating Tables
The Rotating table in QlikView is similar to the column and row transpose feature in Microsoft Excel but with some additional options. We can transpose columns in multiple directions and they give different results. In this chapter, we will be seeing the normal transpose option of converting rows to columns.
Input Data
Let us consider the following input data, which represents the actual and forecasted sales figures.
Month,Forecast,Actual
March,2145,2247
April,2458,
May,1245,
June,5124,3652
July,7421,7514
August,2584,
September,5314,4251
October,7846,6354
November,6532,7451
December,4625,1424
January,8547,7852
February,3265,
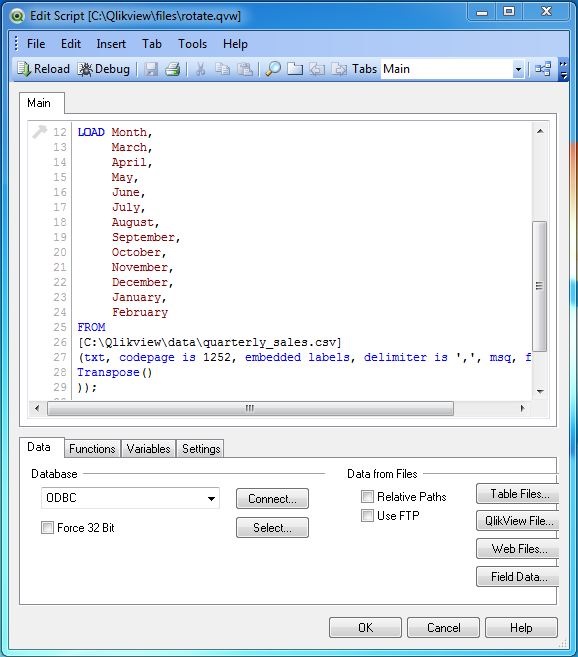
Load Script
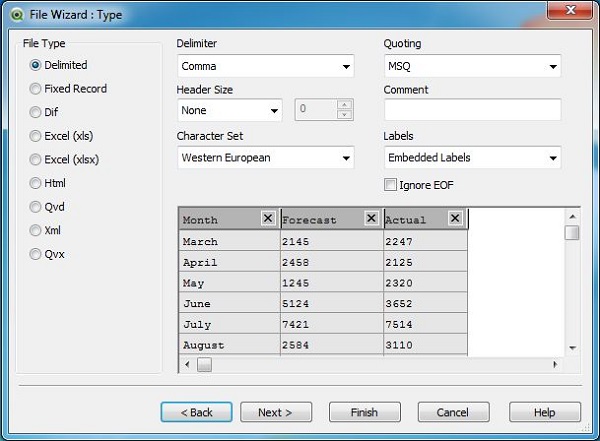
The above data is loaded to QlikView memory by using the script editor. Open the script editor from the File menu or press Control+E. Choose the "Table Files" option from the "Data from Files" tab and browse for the file containing the above data.
After clicking Next, we choose the Enable Transformation Step button to carry out the required data transformation.
Selecting the Data Transformation
As we are going to use the Rotate function, let us choose the Rotate tab which displays the values of all the fields.
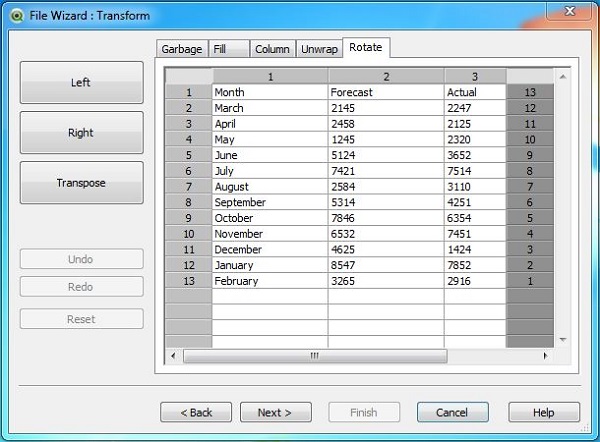
Apply Rotate
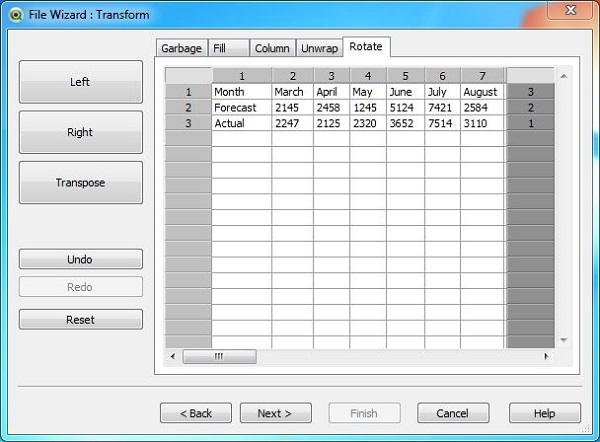
We click the Transpose button to transpose the above data. The transposed data appears as shown below.
Load Script for transformed Data
The load script for the Transformed data can be seen using the script editor. The script shows the expression, which replaces the empty cell values.
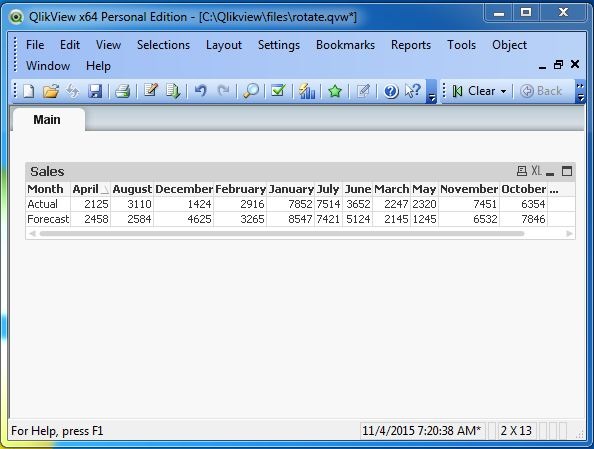
Display Transformed Data
The transformed data can be seen by creating a Table Box using the option in the menu Layout → New Sheet Object.