- QlikView - Home
- QlikView - Overview
- QlikView - Desktop Installation
- QlikView - Architecture
- QlikView - Navigation
- QlikView - Excel file
- QlikView - Delimited file
- QlikView - XML file
- QlikView - Web file
- QlikView - Database
- QlikView - Inline Data
- QlikView - Resident Load
- QlikView - Preceding Load
- QlikView - Incremental Load
- QlikView - Data - files(QVD)
- QlikView Report Interface
- QlikView - Sheet and Objects
- QlikView - Scripting
- Qlikview - Functions
- QlikView - IntervalMatch
- QlikView - Aggregate Functions
- QlikView - Match Function
- QlikView - Rank Function
- QlikView - Peek Function
- QlikView - RangeSum Function
- QlikView - Documents
- QlikView - List Box
- QlikView - Multi Box
- QlikView - Text Object
- QlikView - Bar Chart
- QlikView - Pie Chart
- QlikView - Dashboard
- QlikView Data Transformation
- QlikView - Transformation Wizard
- QlikView - Fill Function
- QlikView - Column Manipulation
- QlikView - Rotating Tables
- QlikView Data Model
- QlikView - Dimensions & measures
- QlikView - Star Schema
- QlikView - Synthetic Key
- QlikView - Generating Data
- QlikView Data Analysis
- QlikView - Cross Tables
- QlikView - Straight Tables
- QlikView - Pivot Tables
- QlikView - Set Analysis
- QlikView - Joins
- QlikView - Keeps
- QlikView - Concatenation
- QlikView - Master Calendar
- QlikView - Mapping Tables
- QlikView - Circular Reference
- Qlikview Useful Resources
- Qlikview - Questions/Answers
- Qlikview - Quick Guide
- Qlikview - Useful Resources
- Qlikview - Discussion
QlikView - Dashboard
A Dashboard is a powerful feature to display values from many fields simultaneously. QlikeView's feature of data association in memory can display the dynamic values in all the sheet objects.
Input Data
Let us consider the following input data, which represents the sales figure of different product lines and product categories.
Product_Line,Product_category,Value
Sporting Goods,Outdoor Recreation,5642
Food, Beverages & Tobacco,2514
Apparel & Accessories,Clothing,2365
Apparel & Accessories,Costumes & Accessories,4487
Sporting Goods,Athletics,812
Health & Beauty,Personal Care,6912
Arts & Entertainment,Hobbies & Creative Arts,5201
Arts & Entertainment,Paintings,8451
Arts & Entertainment,Musical Instruments,1245
Hardware,Tool Accessories,456
Home & Garden,Bathroom Accessories,241
Food,Drinks,1247
Home & Garden,Lawn & Garden,5462
Office Supplies,Presentation Supplies,577
Hardware,Blocks,548
Baby & Toddler,Diapering,1247
Baby & Toddler,Toys,257
Home & Garden,Pipes,1241
Office Supplies,Display Board,2177
Load Script
The above data is loaded to QlikView memory by using the script editor. Open the Script editor from the File menu or press Control+E. Choose the "Table Files" option from the "Data from Files" tab and browse for the file containing the above data. Edit the load script to add the following code. Click "OK" and press "Control+R" to load the data into the QlikView's memory.
LOAD Product_Line,
     Product_category,
     Value
FROM
[C:\Qlikview\data\product_sales.csv]
(txt, codepage is 1252, embedded labels, delimiter is ',', msq);
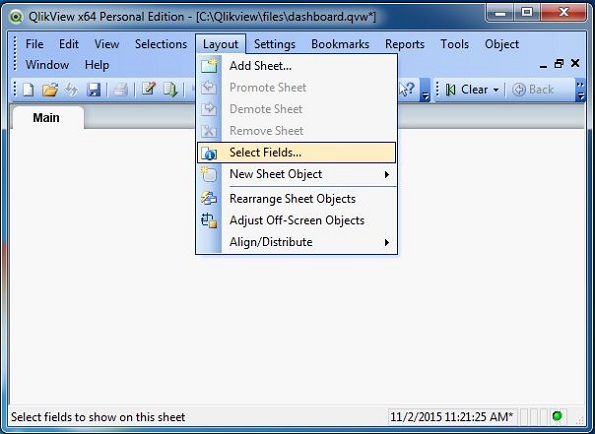
Choose Matrices
We choose the fields from the above input data as matrices to be displayed in the dashboard. For this, we follow the steps in the menu Layout → Select Fields.
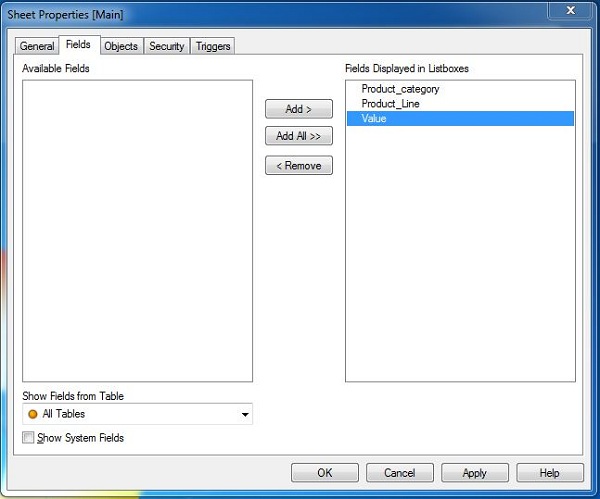
In the next screen, choose the available fields to be displayed in the dashboard. Click "OK".
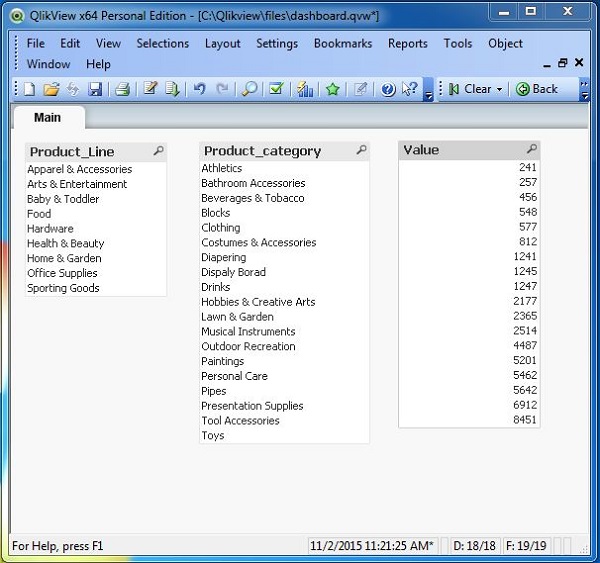
The following screen appears displaying all the fields
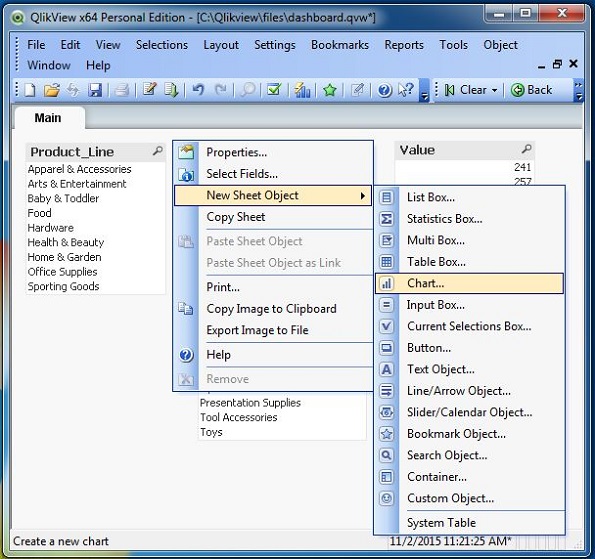
Adding Chart to Dashboard
NNow we add a chart to the dashboard by right-clicking anywhere in the sheet and choosing New Sheet Object → Chart.
Choose the Chart Type
Let us choose the chart type as a bar chart to display the sales values for various product Lines.
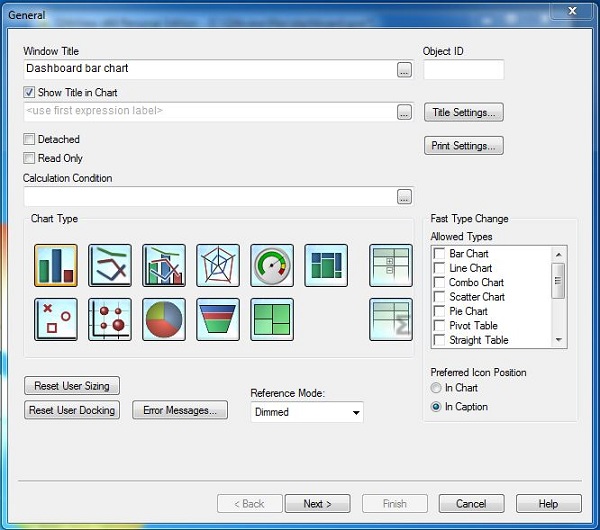
Chart Dimension
Let us select the Product Line as the Chart Dimension.
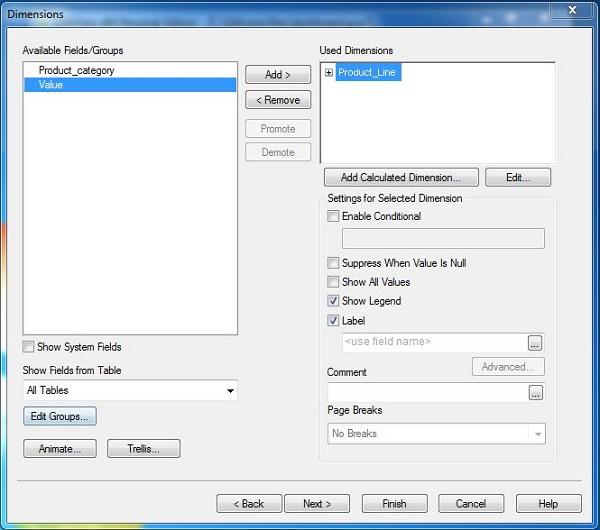
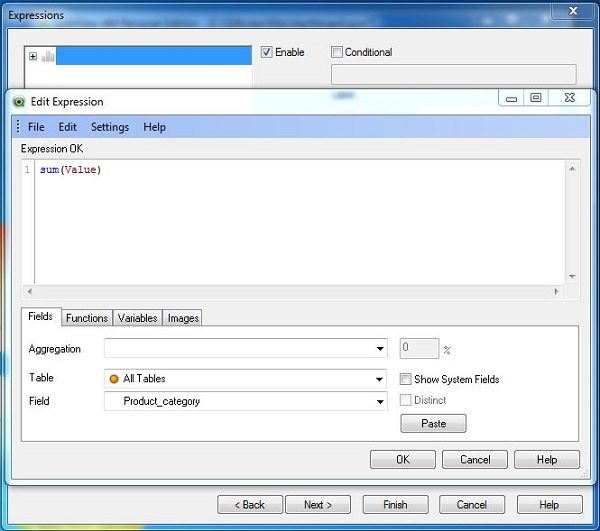
Chart Expression
The expression to display the sales value for the Product Line dimension is written in the expression editor.
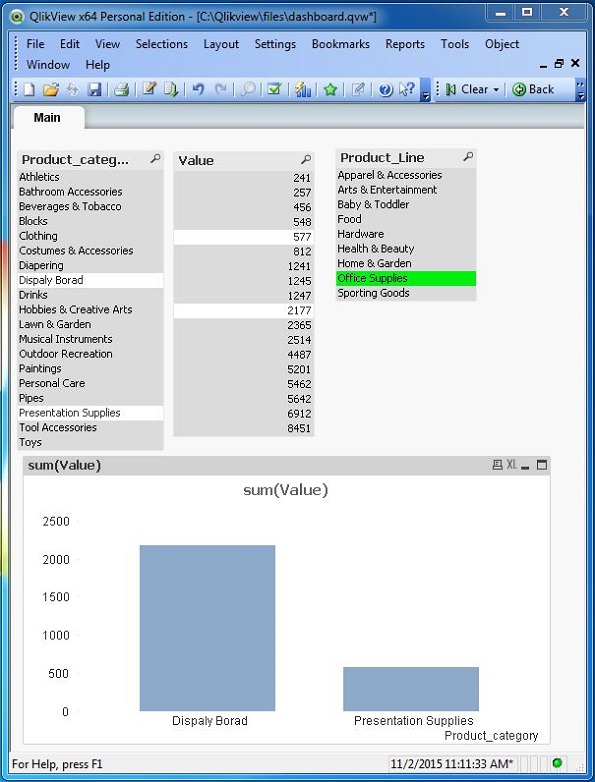
The Dashboard
Given below is the dashboard displayed after finishing the above steps.
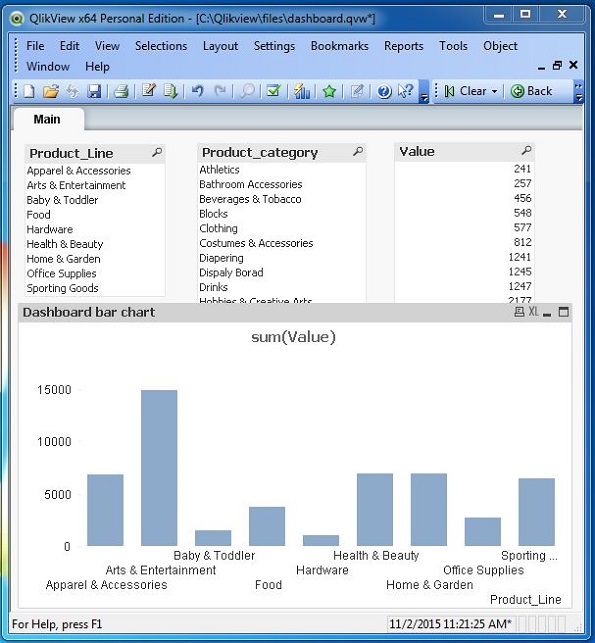
Using the Dashboard
The values in the above Dashboard can be selected for filtering specific products and the chart changes accordingly. In addition, the associated values are highlighted.