- QlikView - Home
- QlikView - Overview
- QlikView - Desktop Installation
- QlikView - Architecture
- QlikView - Navigation
- QlikView - Excel file
- QlikView - Delimited file
- QlikView - XML file
- QlikView - Web file
- QlikView - Database
- QlikView - Inline Data
- QlikView - Resident Load
- QlikView - Preceding Load
- QlikView - Incremental Load
- QlikView - Data - files(QVD)
- QlikView Report Interface
- QlikView - Sheet and Objects
- QlikView - Scripting
- Qlikview - Functions
- QlikView - IntervalMatch
- QlikView - Aggregate Functions
- QlikView - Match Function
- QlikView - Rank Function
- QlikView - Peek Function
- QlikView - RangeSum Function
- QlikView - Documents
- QlikView - List Box
- QlikView - Multi Box
- QlikView - Text Object
- QlikView - Bar Chart
- QlikView - Pie Chart
- QlikView - Dashboard
- QlikView Data Transformation
- QlikView - Transformation Wizard
- QlikView - Fill Function
- QlikView - Column Manipulation
- QlikView - Rotating Tables
- QlikView Data Model
- QlikView - Dimensions & measures
- QlikView - Star Schema
- QlikView - Synthetic Key
- QlikView - Generating Data
- QlikView Data Analysis
- QlikView - Cross Tables
- QlikView - Straight Tables
- QlikView - Pivot Tables
- QlikView - Set Analysis
- QlikView - Joins
- QlikView - Keeps
- QlikView - Concatenation
- QlikView - Master Calendar
- QlikView - Mapping Tables
- QlikView - Circular Reference
- Qlikview Useful Resources
- Qlikview - Questions/Answers
- Qlikview - Quick Guide
- Qlikview - Useful Resources
- Qlikview - Discussion
QlikView - Cross Tables
While analyzing data, we come across situations where we desire columns to become rows and vice-versa. It is not just about transposing, it also involves rolling up many columns together or repeating many values in a row many times to achieve the desired column and row layout in the table.
Input data
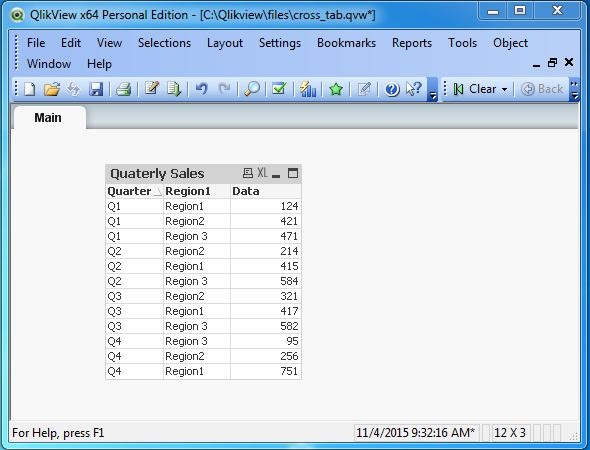
Consider the following input data, which shows region wise sales of a certain product for each quarter. We create a delimited file (CSV) with the below given data.
Quarter,Region1,Region2,Region 3
Q1,124,421,471
Q2,415,214,584
Q3,417,321,582
Q4,751,256,95
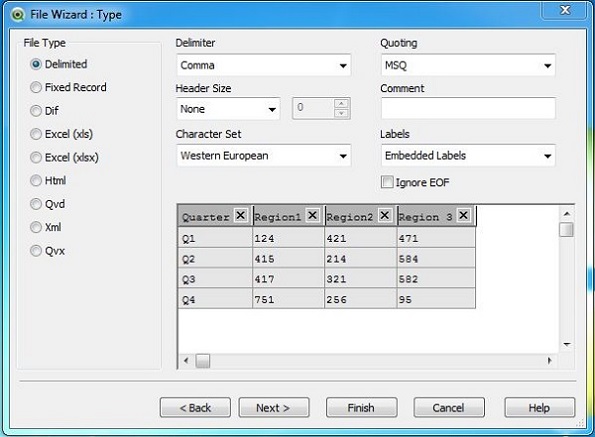
Loading Input Data
We load the above input data using the script editor, which is invoked by pressing Control+E. Choose the option Table Files and browse for the Input file. After choosing the options as shown below, click Next.
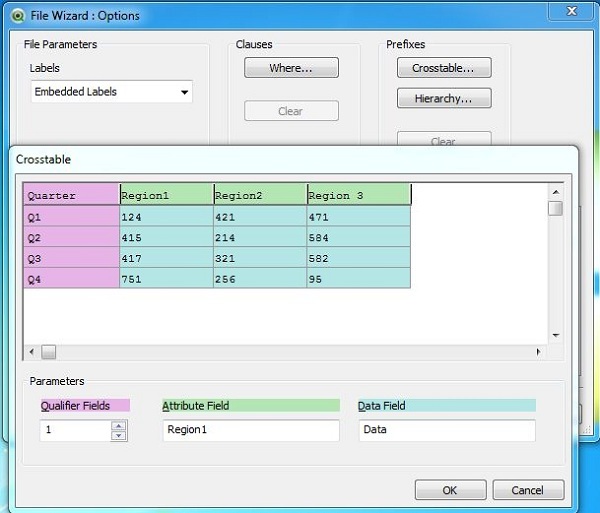
Crosstable Options
In the next window (File Wizard → Options), click on the Crosstable button. It highlights the columns in different colors. The pink color shows the qualifier field, which is going to be repeated across many rows for each value of in the Attribute Field. The cell values under the Attribute fields are taken as the data. Click OK.
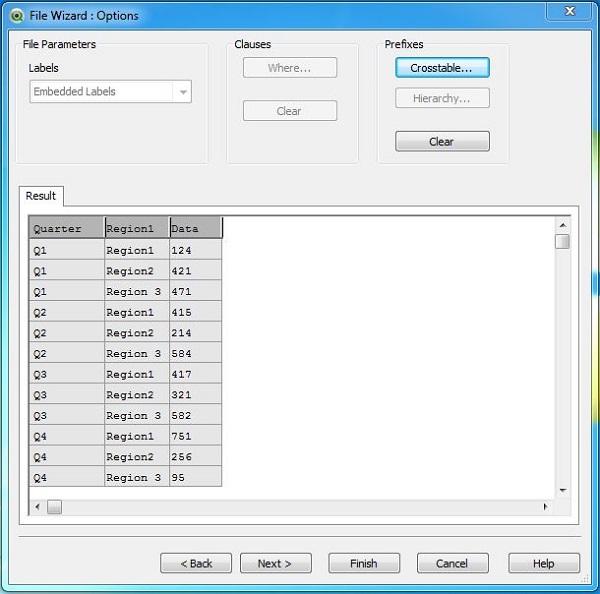
Crosstable Transformation
The transformed data appears in which all the Region fields are clubbed to one column but with values repeating for each quarter.
Load Script
The Load script for the crosstable transformations shows the commands given below.
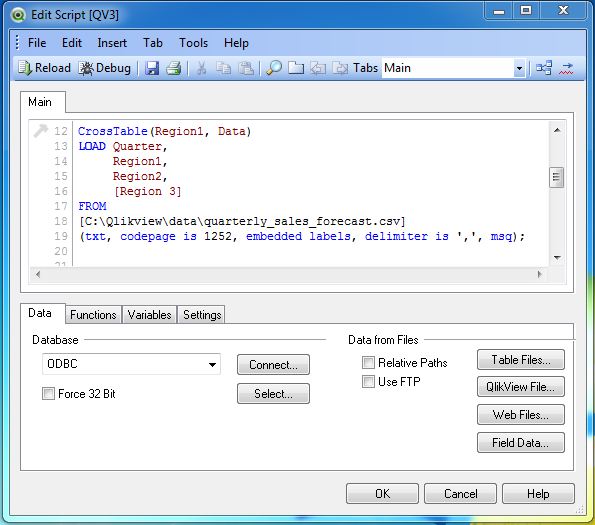
Crosstable Data
On creating a Table Box sheet object using the menu Layout → New Sheet Objects → Table Box, we get the following output.