- QlikView - Home
- QlikView - Overview
- QlikView - Desktop Installation
- QlikView - Architecture
- QlikView - Navigation
- QlikView - Excel file
- QlikView - Delimited file
- QlikView - XML file
- QlikView - Web file
- QlikView - Database
- QlikView - Inline Data
- QlikView - Resident Load
- QlikView - Preceding Load
- QlikView - Incremental Load
- QlikView - Data - files(QVD)
- QlikView Report Interface
- QlikView - Sheet and Objects
- QlikView - Scripting
- Qlikview - Functions
- QlikView - IntervalMatch
- QlikView - Aggregate Functions
- QlikView - Match Function
- QlikView - Rank Function
- QlikView - Peek Function
- QlikView - RangeSum Function
- QlikView - Documents
- QlikView - List Box
- QlikView - Multi Box
- QlikView - Text Object
- QlikView - Bar Chart
- QlikView - Pie Chart
- QlikView - Dashboard
- QlikView Data Transformation
- QlikView - Transformation Wizard
- QlikView - Fill Function
- QlikView - Column Manipulation
- QlikView - Rotating Tables
- QlikView Data Model
- QlikView - Dimensions & measures
- QlikView - Star Schema
- QlikView - Synthetic Key
- QlikView - Generating Data
- QlikView Data Analysis
- QlikView - Cross Tables
- QlikView - Straight Tables
- QlikView - Pivot Tables
- QlikView - Set Analysis
- QlikView - Joins
- QlikView - Keeps
- QlikView - Concatenation
- QlikView - Master Calendar
- QlikView - Mapping Tables
- QlikView - Circular Reference
- Qlikview Useful Resources
- Qlikview - Questions/Answers
- Qlikview - Quick Guide
- Qlikview - Useful Resources
- Qlikview - Discussion
QlikView - Bar Chart
Bar charts are very widely used charting method to study the relation between two dimensions in form of bars. The height of the bar in the graph represents the value of one dimension. The number of bars represent the sequence of values or grouped values of another dimension.
Input Data
Let us consider the following input data, which represents the sales figure of different product lines and product categories.
Product_Line,Product_category,Value
Sporting Goods,Outdoor Recreation,5642
Food, Beverages & Tobacco,2514
Apparel & Accessories,Clothing,2365
Apparel & Accessories,Costumes & Accessories,4487
Sporting Goods,Athletics,812
Health & Beauty,Personal Care,6912
Arts & Entertainment,Hobbies & Creative Arts,5201
Arts & Entertainment,Paintings,8451
Arts & Entertainment,Musical Instruments,1245
Hardware,Tool Accessories,456
Home & Garden,Bathroom Accessories,241
Food,Drinks,1247
Home & Garden,Lawn & Garden,5462
Office Supplies,Presentation Supplies,577
Hardware,Blocks,548
Baby & Toddler,Diapering,1247
Baby & Toddler,Toys,257
Home & Garden,Pipes,1241
Office Supplies,Display Board,2177
Load Script
The above data is loaded to the QlikView memory by using the script editor. Open the Script editor from the File menu or press Control+E. Choose the "Table Files" option form the "Data from Files" tab and browse for the file containing the above data. Edit the load script to add the following code. Click "OK" and press "Control+R" to load the data into the QlikView's memory.
LOAD Product_Line,
     Product_category,
     Value
FROM
[C:\Qlikview\data\product_sales.csv]
(txt, codepage is 1252, embedded labels, delimiter is ',', msq);
Creating Table Box(Sheet Object)
For the above data, let us create a Table Box, which will show the data in a tabular form. Go to the menu Layout → New Sheet Object → Table Box and choose the column as shown below.
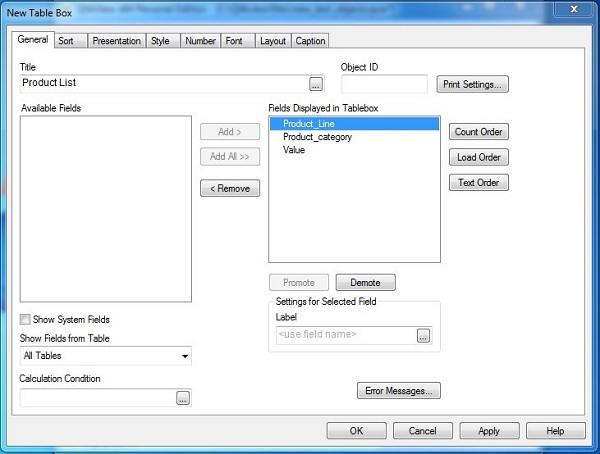
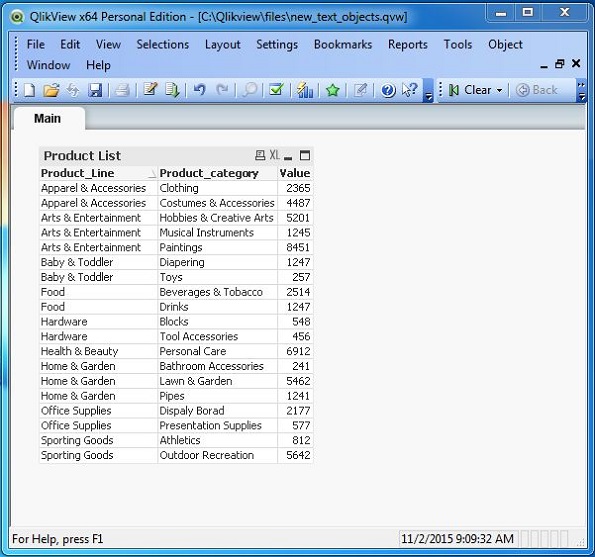
Click Apply and then OK to finish creating the Table box. The below given screen appears.
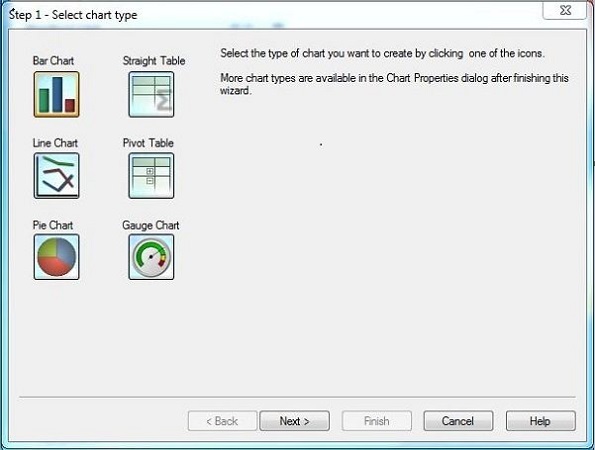
Using the Quick Chart Wizard
To start creating a bar chart, we will use the quick chart wizard. On clicking it, the following screen appears which prompts for selecting the chart type. Choose bar Chart and click Next.
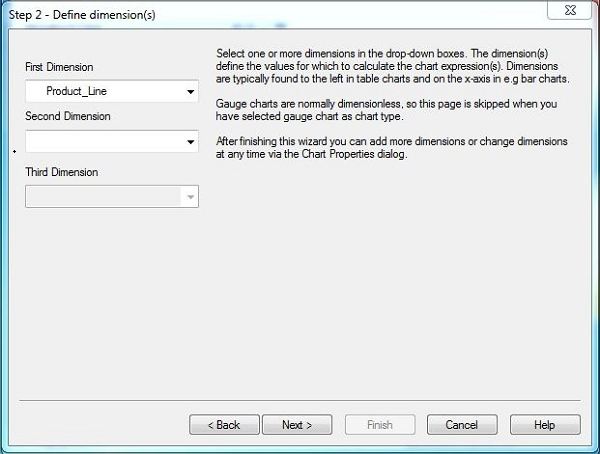
Choose the Chart Dimension
Choose Product Line as the First Dimension.
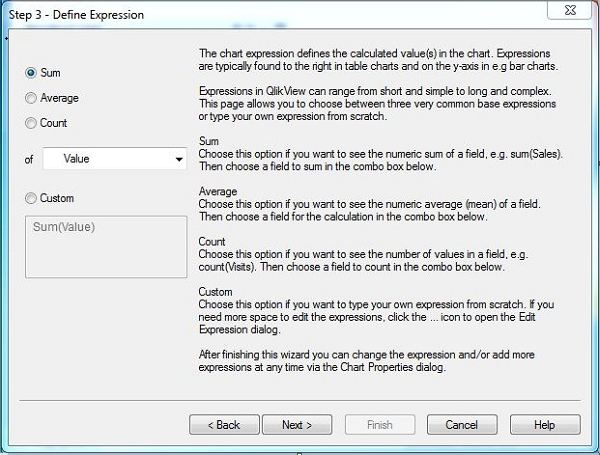
Choose the Chart Expression
The chart expression is used to apply the functions like Sum, Average, or Count on the fields with numeric values. We will apply the Sum function on the filed named Value. Click Next.
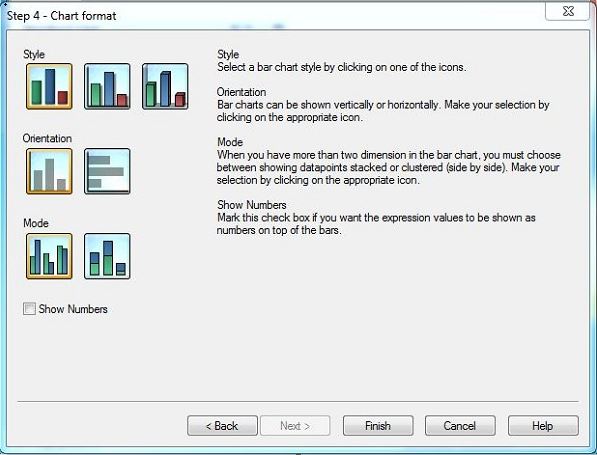
Choose the Chart Format
The Chart format defines the style and orientation of the chart. We choose the first option in each category. Click Next.
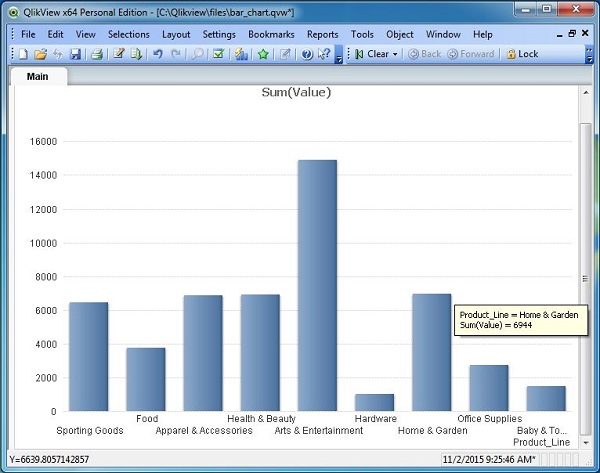
The Bar Chart
The Bar chart appears as shown below. It shows the height of the field value for different product lines.