- Microsoft Azure Tutorial
- Microsoft Azure - Home
- Cloud Computing - Overview
- Microsoft Azure - Windows
- Microsoft Azure - Components
- Microsoft Azure - Compute Module
- Microsoft Azure - Fabric Controller
- Microsoft Azure - Storage
- Microsoft Azure - Blobs
- Microsoft Azure - Queues
- Microsoft Azure - Tables
- Microsoft Azure - CDN
- Microsoft Azure - Applications
- Microsoft Azure - Security
- Microsoft Azure - Datacenters
- Microsoft Azure - Scenarios
- Microsoft Azure Advanced
- Microsoft Azure - Management Portal
- Azure - Create Virtual Network
- Azure - Deploying Virtual Machines
- Azure - Endpoint Configuration
- Azure - Point-to-Site Connectivity
- Azure - Site-to-Site Connectivity
- Microsoft Azure - Traffic Manager
- Microsoft Azure - PowerShell
- Azure - Monitoring Virtual Machines
- Azure - Setting Up Alert Rules
- Azure - Application Deployment
- Microsoft Azure - Backup & Recovery
- Azure - Self-Service Capabilities
- Azure - Multi-Factor Authentication
- Azure - Forefront Identity Manager
- Azure - Data Import & Export Job
- Microsoft Azure - Websites
- Microsoft Azure - Scalability
- Microsoft Azure - Disk Configuration
- Microsoft Azure - Disk Caching
- Microsoft Azure - Personalize Access
- Azure - Personalize Company Brand
- Azure - Self-Service Password Reset
- Microsoft Azure - Self-Service Group
- Microsoft Azure - Create a Group
- Azure - Security Reports & Alerts
- Azure - Orchestrated Recovery
- Microsoft Azure - Health Monitoring
- Microsoft Azure - Upgrades
- Microsoft Azure Useful Resources
- Microsoft Azure - Quick Guide
- Microsoft Azure - Useful Resources
- Microsoft Azure - Discussion
Microsoft Azure - Monitoring Virtual Machines
Monitoring virtual machines is important to keep a track of its performance and health. Windows Azure provides an interactive interface to monitor the statistics related to the performance of virtual machine. The five key statistics are −
- CPU percentage
- Disk Read Bytes/sec
- Disk Write Bytes/sec
- Network in
- Network out
Monitor VM in Azure Management Portal.
Step 1 − Login to Azure Management Portal.
Step 2 − Go to Virtual Machine.
Step 3 − Select the virtual machine you want to monitor.
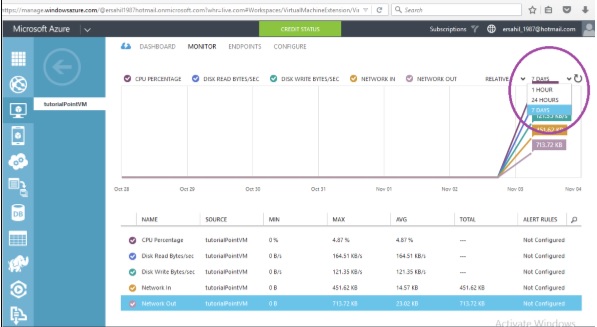
Step 4 − Select Monitor from the top menu as shown in following image.
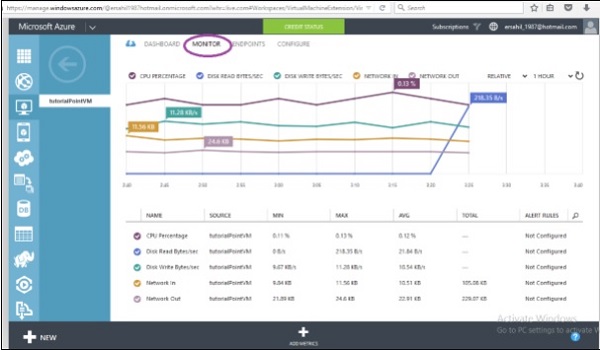
You can see 5 key terms on the above screen. It seems pretty complicated at first glance but when you look carefully, you can see that each line on the graph is in a different color which matches the color of the term. For example, CPU Percentage is in purple color and the purple line on the graph represents it. The machine shown in the above image is quite new. The following sections will explain how figures are read.
CPU Percentage
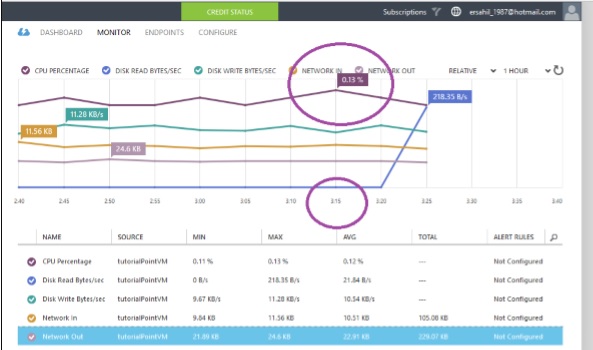
CPU percentage is the most common statistics to check whenever there is a performance issue in an application. It tells the processor’s utilization in percentage. In the following image, you can see that in the last dropdown at the right top corner 1 hour is selected and, highest utilization is at 3:15 which is 0.13%.
Disk Read Bytes/Sec
Another factor affecting performance is disk input/output operations. Disk read byte/second measures the amount of data read every second on the disk. If the read operations are done more frequently on the disk, performance issues can be resolved using a faster disk.
Disk Write Bytes/sec
Similarly, disk write byte/sec measures the amount of data written every second. If the application needs writing large amount of data on the disk, a bigger disk can be chosen.
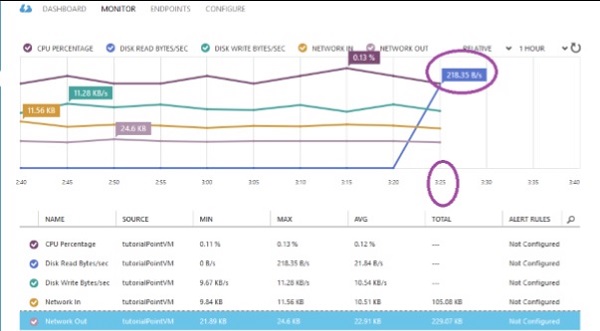
In the image above, you can see the highest point in disk read is 218.35 byte/sec at 3:25. You can see the last hour’s data because ‘1 Hour’ is selected in the dropdown. You can also see data for last 24 hours and 7 days.
Network In
Monitoring the network traffic can be done by looking at the ‘network in’ figures in the ‘Monitor’ section. The network-in statistics can be in bytes or TCP segments received.
Network Out
Network-out statics tells about TCP segments sent per second. You can also see relative or absolute statistics by selecting an option from dropdown encircled in the following image.
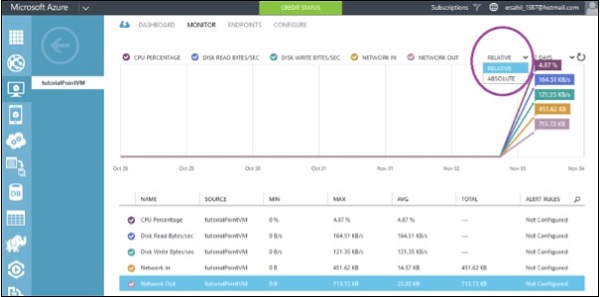
Similarly, you can choose the duration from the dropdown highlighted in the following image.
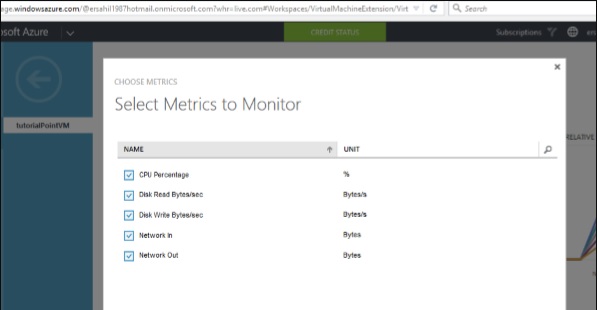
You can also choose particular metrics, by clicking on ‘Add Metrics’ at the bottom of the screen. The following screen will appear, in which you can check the desired metrics.
Enable Diagnostics
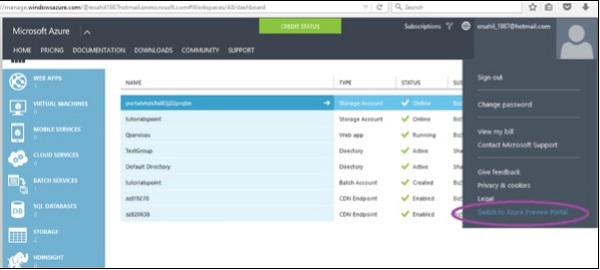
Enabling diagnostics allows you to collect logs. Azure will collect logs and store in a storage account you specified. We can enable diagnostics by switching to the ‘Preview Portal’. Diagnostic figures help in troubleshooting as the logs for errors can be tracked in the storage account.
Step 1 − Switch to the ‘preview portal’.
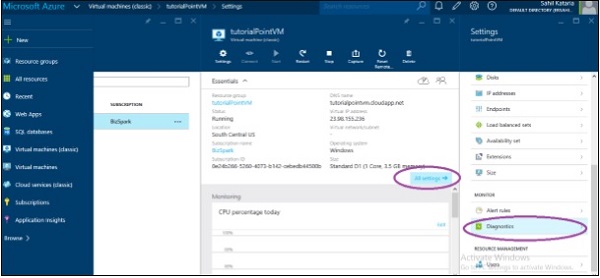
Step 2 − Locate the ‘Virtual Machine (classic)’ in the left panel.
Step 3 − Select the Machine and ‘All Settings’.
Step 4 − Scroll down and locate ‘Diagnostics’. Select ‘Diagnostic’ as shown in the following image.
Step 5 − Select ‘On’ in the next panel displayed on the right side. By default it will be set off.
Step 6 − Since it uses a storage account to store the logs you will have to configure the setting for the storage account by clicking on the encircled part in the following image.
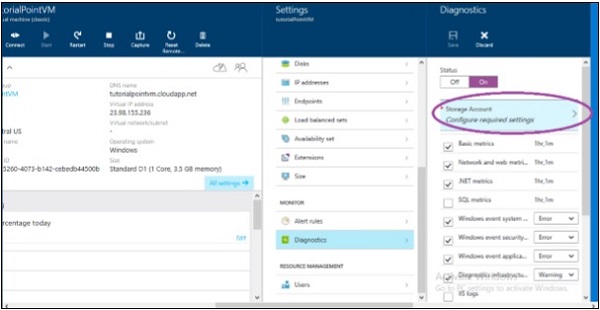
Step 7 − You can also select or deselect the type of logs you want to keep.
You will also see a panel at the bottom with the heading ‘Monitoring’. This section displays the same metrics that we discussed in the section above.
These figures help users to identify the causes of performance slide of an application. They can also generate alerts for these features; they go above the set limits.