- SAP Webi - Home
- SAP Webi - Overview
- SAP Webi - BI Launchpad
- SAP Webi - BI Preferences
- SAP Webi - Application Modes
- SAP Webi - Creating Documents
- Editing & Opening Documents
- Web Intelligence Sending Documents
- SAP Webi - Managing Reports
- SAP Webi - Using Queries
- SAP Webi - Queries Using Universe
- SAP Webi - Queries Using Bex
- Queries Using Analysis View
- SAP Webi - Query Filters
- SAP Webi - Query Filter Types
- SAP Webi - Ranking Data
- SAP Webi - Working With Reports
- SAP Webi - Breaks
- SAP Webi - Sorts
- SAP Webi - Charts
- SAP Webi - Conditional Formatting
- SAP Webi - Filtering Report Data
- SAP Webi - Input Controls
- SAP Webi - Formulas and Variables
- SAP Webi - Drill Options in Reports
- SAP Webi - Sharing Reports
- SAP Webi - Merge Dimension
- SAP Webi - Questions Answers
- SAP Webi - Quick Guide
- SAP Webi - Useful Resources
- SAP Webi - Discussion
SAP Webi - Quick Guide
SAP Webi - Overview
Web Intelligence is part of SAP BusinessObjects product suite and is used for analytical and ad hoc reporting to meet an organizations business requirements. Web Intelligence is a Business Intelligence reporting tool for business users to analyze data in Data Warehouse. It assists business managers in the decision-making process for building future strategies.
Using Web Intelligence, business users can create basic, medium, and complex reports from transactional data in database and by creating Universes using Information Design Tool/UDT. Various SAP and non-SAP data sources can be used to create reports in Web Intelligence. SAP Business Warehouse (BW) system doesnt require a Universe to connect to Web Intelligence tool.
Web Intelligence tool can work as a client tool of BusinessObjects platform and also as a standalone tool for reporting.
Versions and History
BusinessObjects was first started in 1990 with the tool name Skipper SQL 2.x, and in the year 1994 Business Objects v3.0 was launched.
In 2005, BO XI was released and later on various other versions introduced. Some of the versions are −
- BO XI R1
- BO XI R2
- BO XI R3
- BO XI R3.1
- BO XI R3.2
In 2007, SAP acquired this company for $6.8 billion and the product has been renamed as SAP BusinessObjects.
Later in the year 2011, BO XI 4.0 was introduced. The latest version of the tool is SAP BO 4.2.
Web Intelligence Architecture
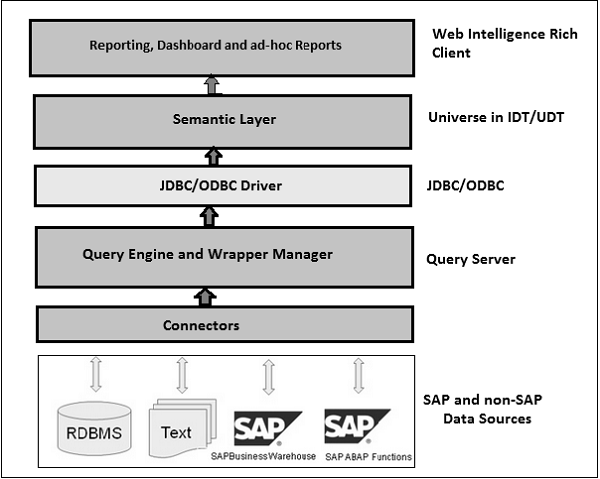
SAP Webi has a three-layered architecture −
Database Layer − This layer defines multiple SAP and non-SAP data sources.
Semantic Layer − This layer defines multidimensional data model.
Presentation Layer − This layer defines where data is presented to end-users.
Various data sources can be used to create analytical and ad hoc reports. You can pull data from SAP systems, like SAP ECC, SAP ERP, SAP SRM, and other SAP modules.
Non-SAP data sources include Oracle Database, Microsoft SQL Server, IBM DB2, and Sybase.
SAP Webi - BI Launchpad
BI Launchpad is a Java or HTML based interface of BusinessObjects tool to perform analytical reporting and data analysis. You can set the preference for your BI Launchpad that determines which tool interface is launched via Launchpad.
Using Web or Internet Application to access Webi interface via BI Launchpad, you can perform the following tasks −
Create, edit and refresh all the reports in Web Intelligence.
Create and edit all the queries in no data source (Universes) but not BEx queries in Web application.
Note − If you are using Webi 4.0 SP2, it is not possible to create queries and you can only work on documents and reports.
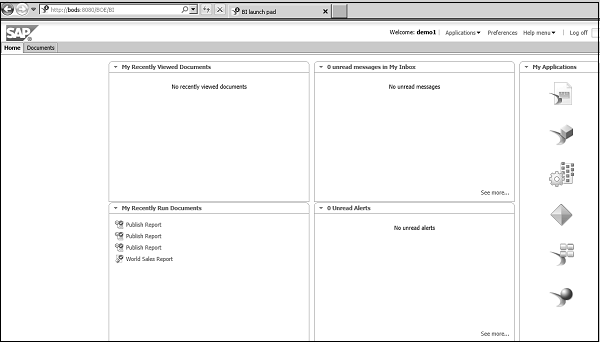
BI Launchpad has the following important tabs −
Home − Displays recent messages, alerts, documents, and applications that can be run.
Documents − Displays the available documents and folders, making it easier to view, organize, and manage the documents.
Any open Document − Displays each open document.
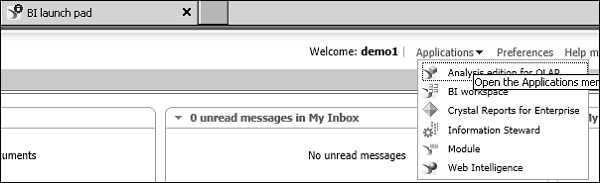
You can use the Application tab to start an application including Web Intelligence. You can use the Preference tab to define BI Launchpad preferences.
Logging to BI Launchpad
As mentioned, BI Launchpad is HTML5 or Java-based web interface to launch an application via BI Launchpad.
To access BI Launchpad, you should have a web URL, user name and password. Access profile to be set for the resources.
To get the BI Launchpad details and user credentials you can reach the BO Administrator using the link, http://BOSERVER:8080/BOE/BI
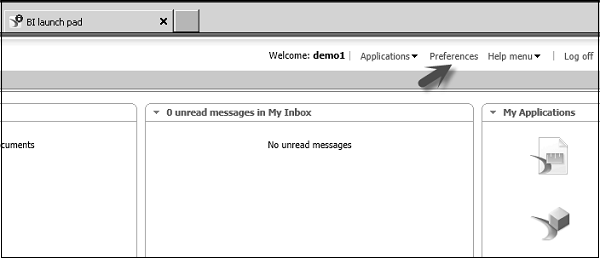
To login to BI Launchpad, open the web browser and enter the Launchpad URL provided by your administrator. The following screen pops up.
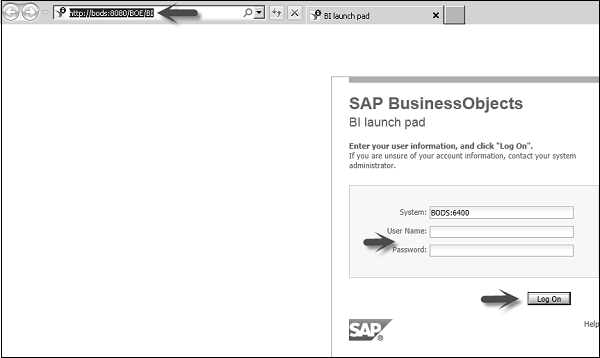
Select the system name you want to login. Enter the user name and password.
In the Authentication dropdown, select the Authentication type - Enterprise, Windows AD, etc. (In the above snapshot, this server has a single login).
Click Log On and it will open the home page for BI Launchpad.
You can use Applications tab of Launchpad to run any of the application.
SAP Webi - BI Preferences
Let us now discuss how to set BI preferences.
Setting BI Preferences
You can set BI Launchpad preferences for the following tasks.
General Preferences − These are defined by the administrator. You can reset your password. You can also set time zone, locales preferences, and Web Intelligence preferences.
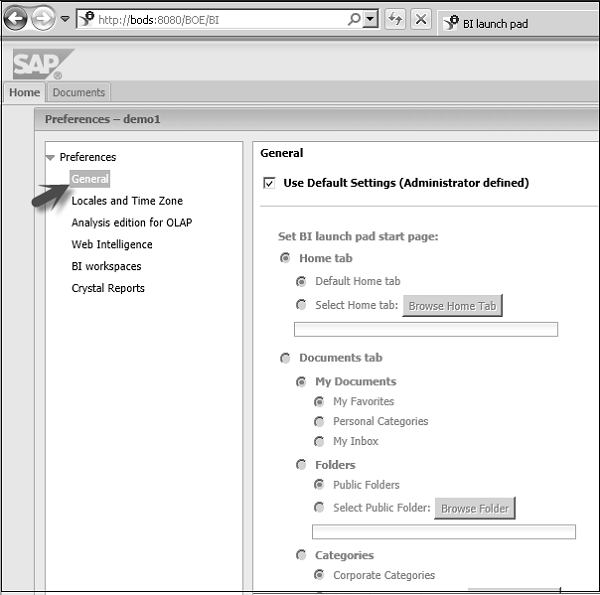
General Tab − Using this tab you can set user default settings.
Change Password − As per your user access.
Locales and Time Zone − To set product locale, preferred viewing locale, current time zone.
Analysis Edition for OLAP − To define accessibility mode.
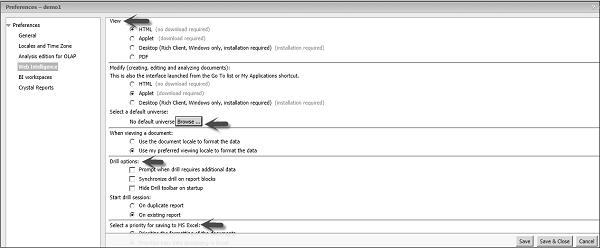
Web Intelligence − You can select the interfaces to use for view and modify modes. You can also select a Default Universe. You can set the drill options. You can also select saving priorities when saving a report in .xls format.
BI Workspaces − Used to select a default stylesheet to use when creating a new workspace.
Crystal Reports − Used to set crystal reports options like printing options, default measuring unit, etc.
SAP Webi - Application Modes
There are three different application modes that can be used to build the queries, create documents and to analyze the reports. When you open an existing report, the following modes are available −
- Data
- Reading
- Design
Data Application Mode
In this mode, you can create new data provider, change an existing data source or rename a data provider. You can also create, edit, and manage queries, which is used to pass data to reports.
In Data mode, it shows the list of all the available data providers. All the options in tool mode are disabled in this mode.
Reading Mode
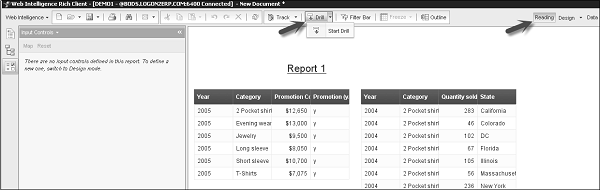
This mode allows you to display existing reports, search text, monitor changes in the reports, and drill down on the data in the report.
You can also use the left panel and tool bar in the Reading mode.
Design Mode
Design mode allows you to add, delete objects in a report, applying conditional formatting, applying formulas in report, creating variables, etc.
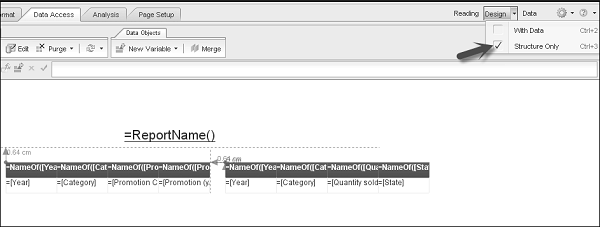
Design mode with Structure only allows you to view the structure of the report. All the changes that you make in this mode, they are not applied to the server till you populate it with data.
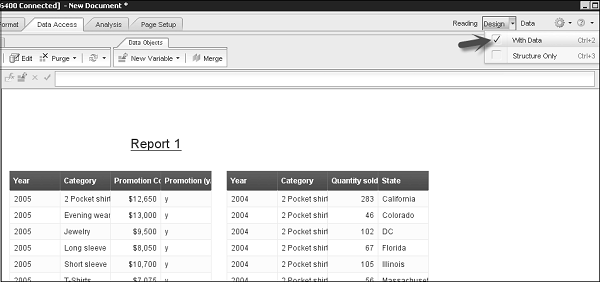
In Design mode with data, all the modifications applied in a report are on the server. In case you have to make a lot of changes in an existing report, it is recommended to make changes in structure mode and then populate the report with data.
SAP Webi - Creating Documents
In this chapter, we will learn how to create Webi documents.
Creating Documents in Webi
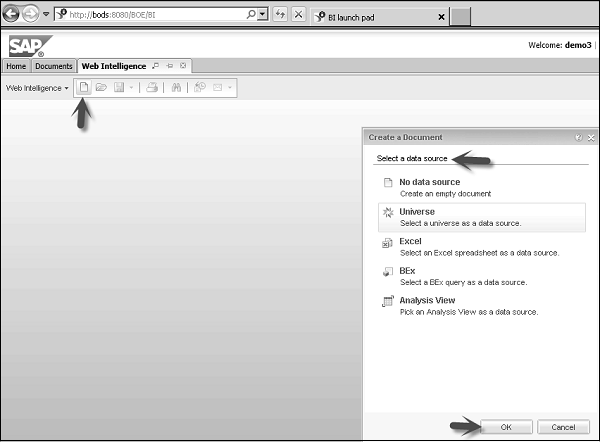
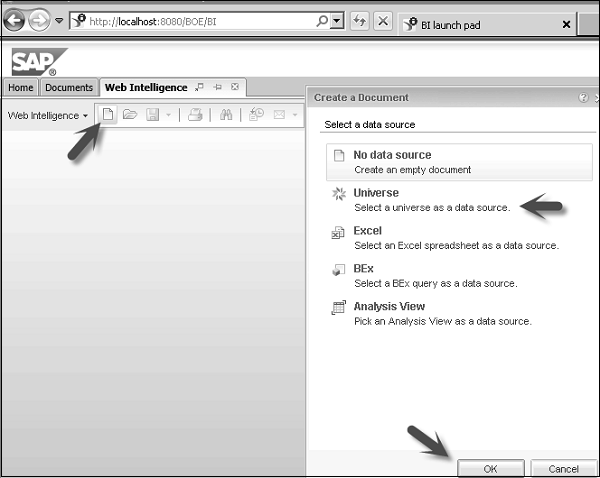
When you open Web interface via BI Launchpad or open Webi rich client, you have an option to create a new document or edit an existing one. You can create a new document as blank document or use an interface to create a document based on the following data sources −
- Universe
- Flat files in .csv or .xls format
- BEx queries
- Analysis view
Rich Internet application interface and Webi rich client allows you to use from list of available data sources; however, Web Interface supports only no data source or Universe from IDT/UDT.
| Data Source | Web Interface via BI Launchpad | Rich Internet Application Interface | Web Rich Client Tool |
|---|---|---|---|
| No Data | Yes | Yes | Yes |
| .unx or .unv Universe file | Yes | Yes | Yes |
| BW BEx Query | No | Yes | Yes |
| Analysis View | No | Yes | Yes |
| Text Files CSV and XLS | No | Yes | Yes |
To create a blank document to use later − Launch Webi Rich Client → Click New document option at the top → No Data Source → Ok.
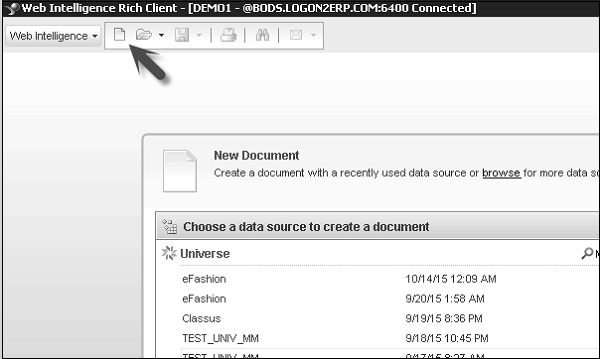
Or you can select a blank document by clicking the icon below the list of available data sources.
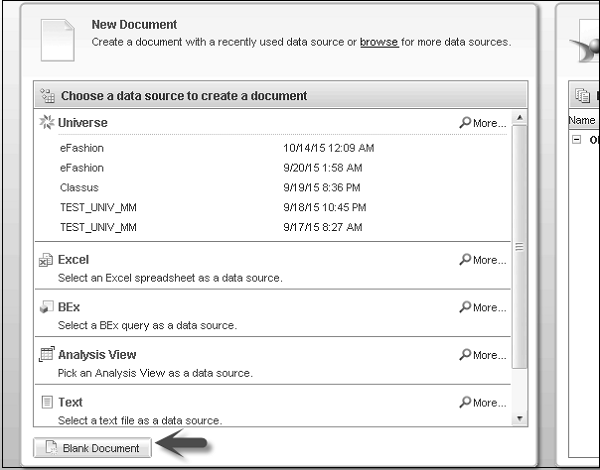
You can also use other data sources like Universe, BW BEx query, and text sources like CSV and XLS files, Analysis view or a web service as data source to create a new document.
Creating Document Based on Universe
You can create a Webi document based on Universe using Information Design Tool/Universe Design Tool.
.unx − File created with Information Design Tool
.unv − File created in Universe Design Tool
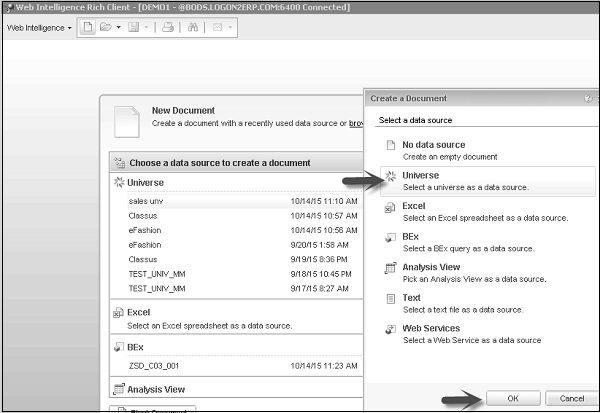
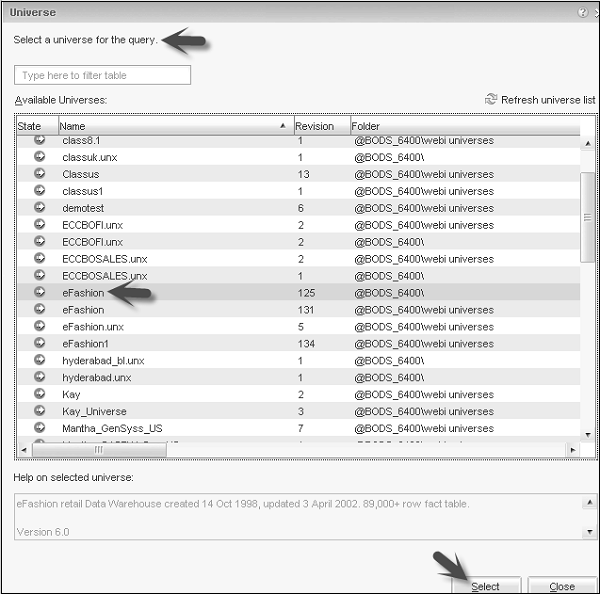
To use a Universe as data source, go to New → Select a Universe as data source and click Ok.
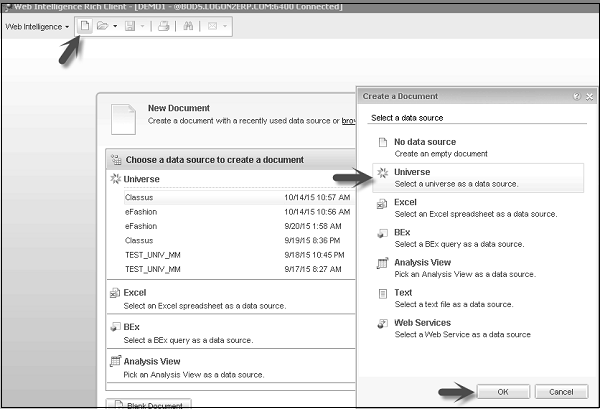
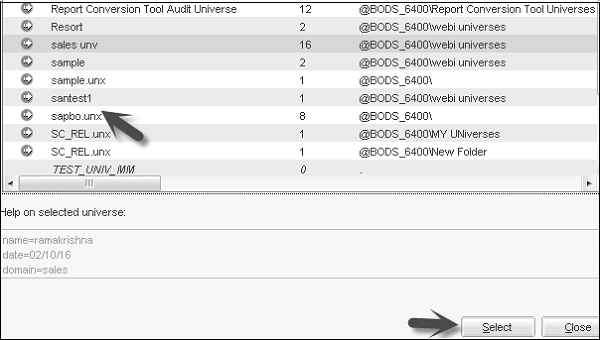
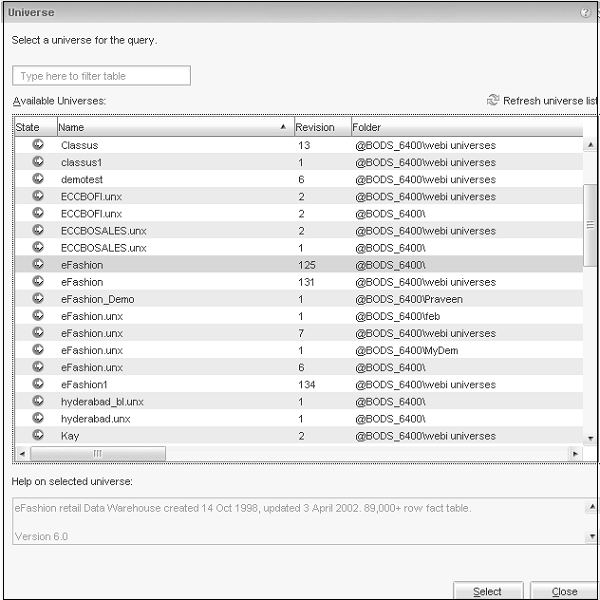
It will open a list of all Universes published to BI repository to use in a document. You can select any available universe and click Select.
It will show you all .unx and .unv files available to use in a document.
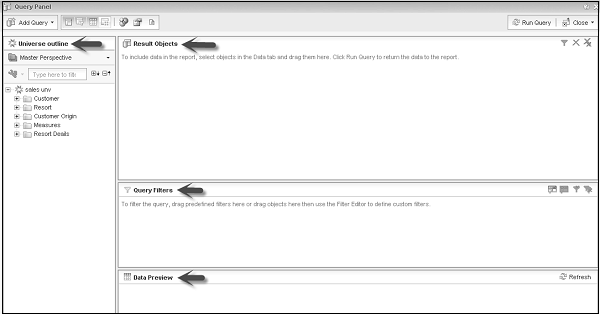
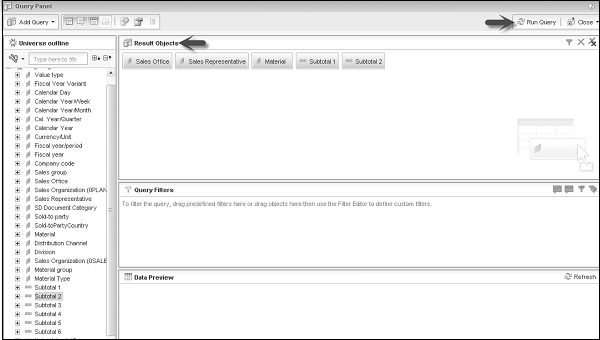
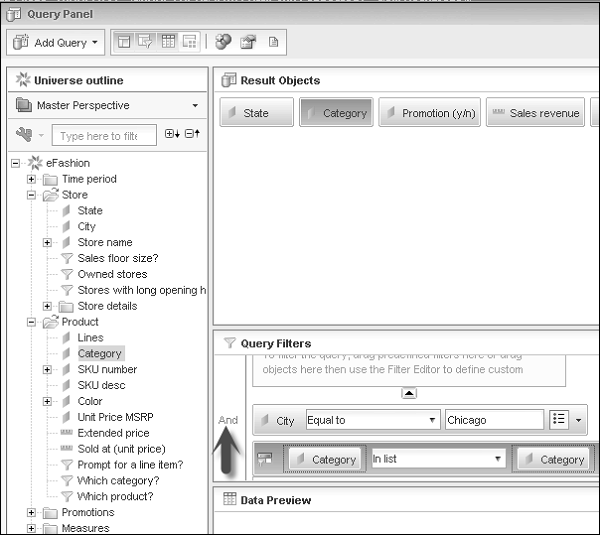
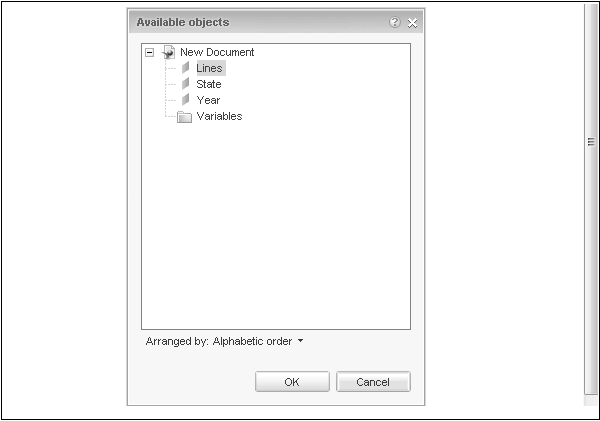
Query Panel will be open. You can select from list of available objects as per your access permissions. You may not be able to use a few of the objects because of permission issues.
In query panel, you have Universe outline in the left pane, and result objects, query filters, data preview panels in the main pane.
Creating Document based on BEx
To use BEx as data source, go to New → Select BW BEx query as data source and click Ok.
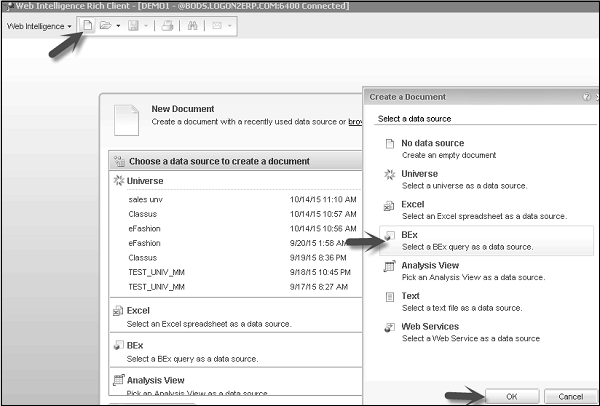
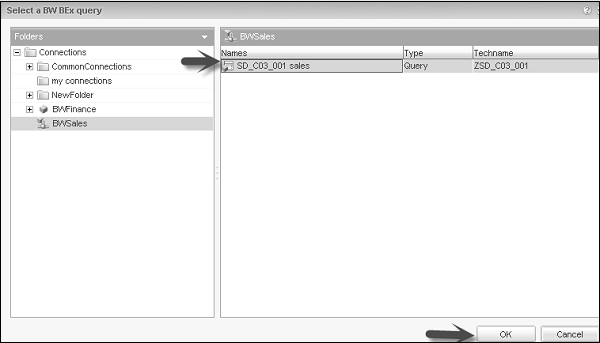
It will show you a list of all available BEx queries. You can select only those which you have permission to access. On the left side of the screen, it shows you the name of Info provider for BEx query.
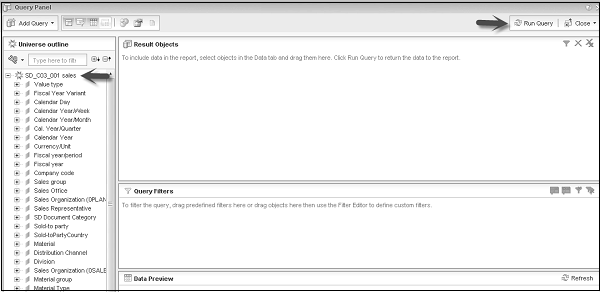
It will open the Query panel, you can select the list of available objects from Universe Outline and name of BEx query below that.
Creating Document Based on Analysis View
Click New icon → Select Universe → Ok.
Select the Analysis view you want to use and click Ok.
It will open the Query panel with a list of available objects.
SAP Webi - Editing & Opening Documents
You can edit an existing document via BI Launchpad → Web Interface or by opening a document in Webi Rich Client.
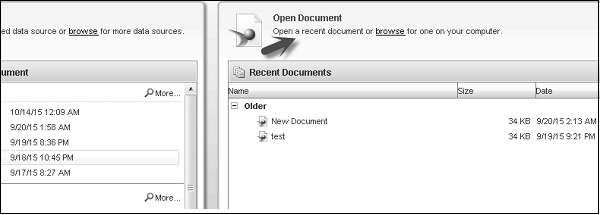
You can also open recent documents using Webi Rich client directly. Launch Webi rich client and you will get a list of recent open documents on the left side of the screen.
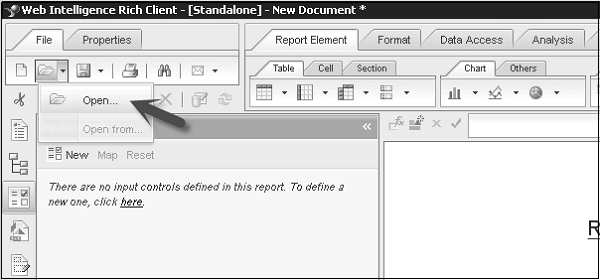
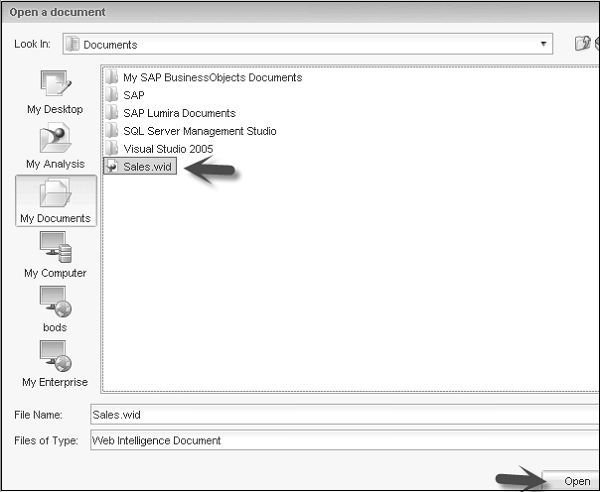
You can also select an existing report to edit in Webi. Extension of a Webi File is .wid.. To open an existing document, select a blank document. Go to File → Open.
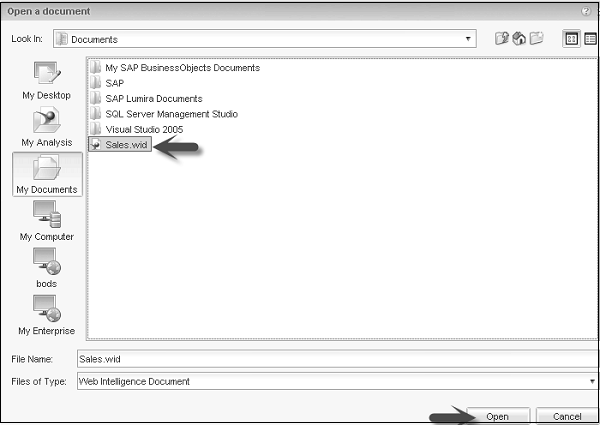
Select the path of an existing wid file and click Open.
By default, it will open the report in Design mode.
Opening a Document
To open a document, go to Webi rich client → Click Open tab.
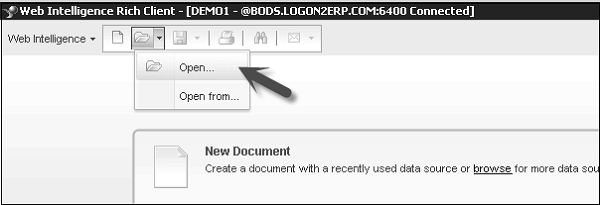
Navigate through the folder you want to open, select the file and click Open. This will open the file in Design mode.
You can select design and read mode as per your access rights.
SAP Web Intelligence - Sending Documents
In this chapter, we will get acquainted with the various ways of sending a document.
Sending a Document via E-mail
Open the document in Webi Rich client → Click Send by e-mail attachment
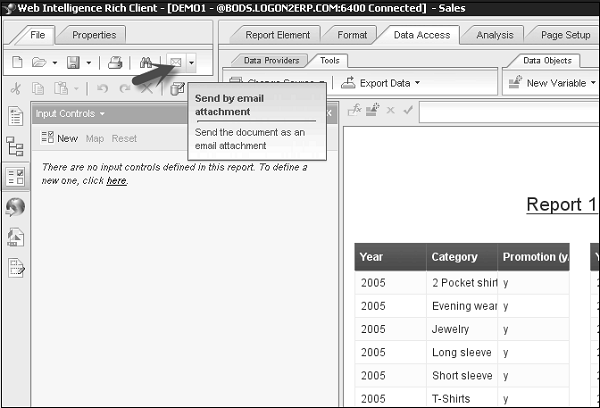
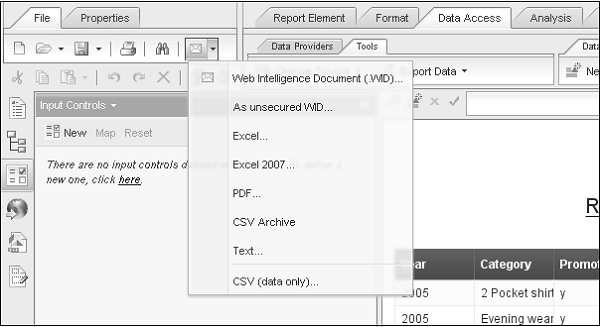
You have an option to select the different attachment formats like PDF, XLS, CSV, Text, and/or unsecured wid.
Sending Documents to Other Users
To send a document to other users/groups, open the document via BI Launchpad. Click Send on toolbar → Send to User.
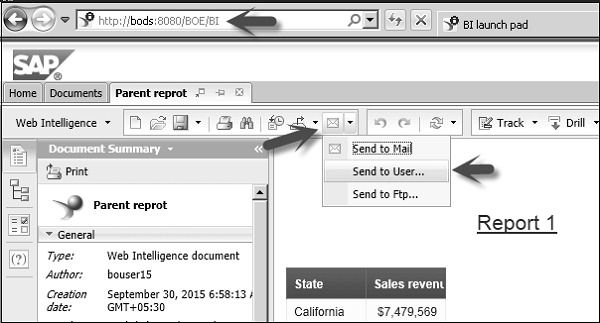
Select the users/groups to which you want to send the document to from the list of users and groups. You can select automatically generated to send the document with an auto generated name. Select the specific name and enter the name you want to send the document.
You can also select shortcut to send a shortcut or Copy option to send a copy of the document.
Sending Documents Using FTP
To send a document via ftp, login to BI Launchpad. You have to save the document first. Click Save icon at the top of the screen to save the document.
Click Mail icon in the tool bar → Select Send to Ftp.
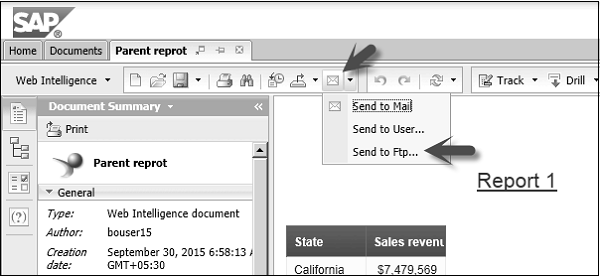
You have to enter the host name, port number, user name and password. Select the naming method for document to send. Click Send.
SAP Webi - Managing Reports
Webi documents contain at least one or more reports. You can manage multiple reports in a single Webi document. You can also add, delete, rename, and move existing reports in one Webi document.
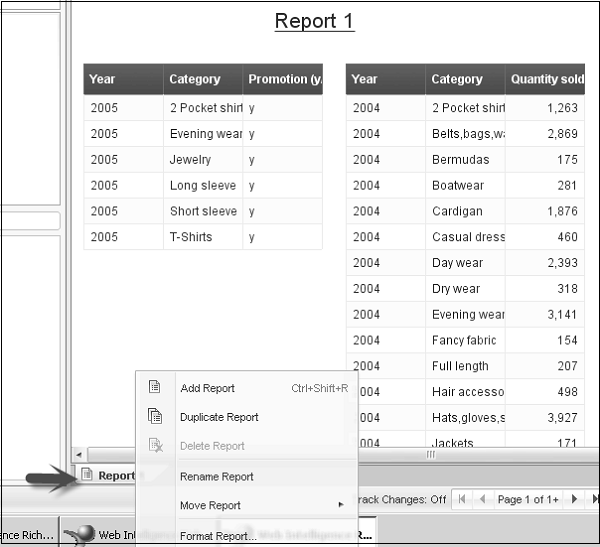
To add, delete, or move a report in a Webi document, right-click on the Report tab.
Add, Delete, Rename, Save a Report
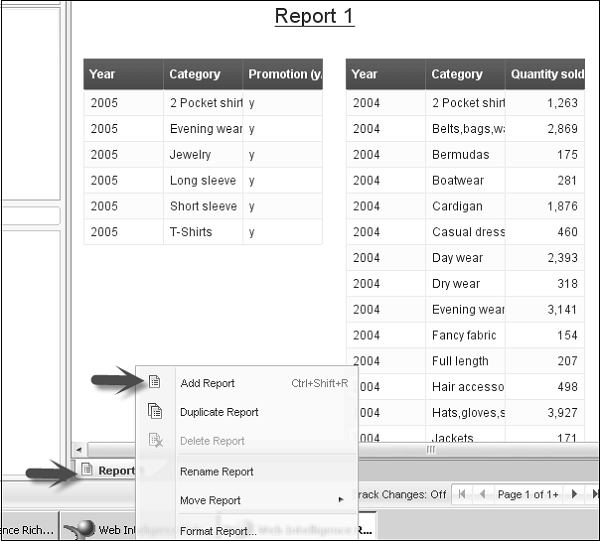
To add a report, right-click on the existing report tab and click Add Report.
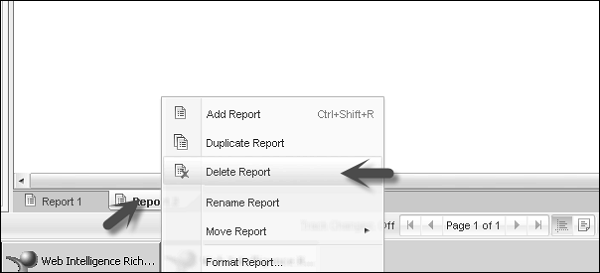
To delete a report, right-click on the report tab and click Delete. Each Webi document should have at least one report.
You can use Rename Report option to rename an existing report.
To save a document in Webi, you have options to save a report locally, save in BI repository, or export as CSV format. To do this, go to File tab and choose from the options Save/Save As/Save as Enterprise.
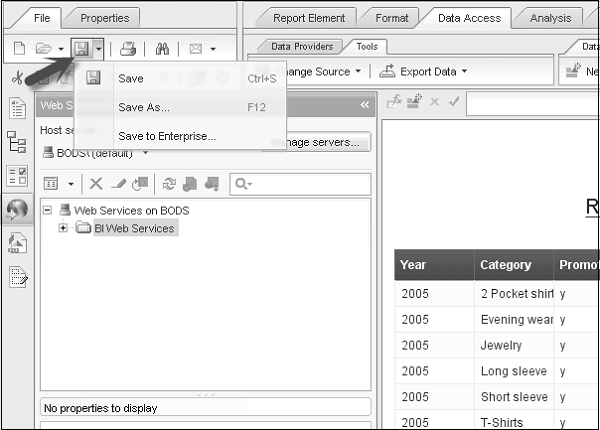
If you open a Webi document, you can click Save to keep the changes. Save as option is used to save a document in different formats such as −
- WID
- Excel
- Excel 2007
- CSV Achieve
- TXT File
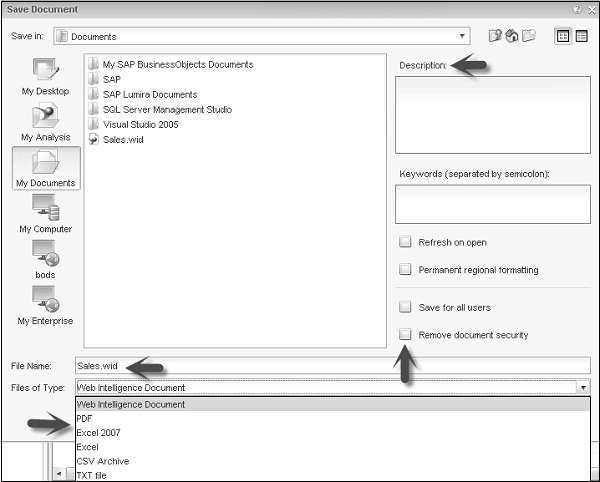
When you use the Save as option, on the right side of the screen you get many options Refresh on open, Permanent Regional formatting, Save for all users, Remove document Security.
You can enter the report name, change an existing report name and also add a description.
SAP Webi - Using Queries
Queries in Webi are managed in the Query panel. When you create a Webi report, you use queries in the query panel to get data from the data source.
Queries can be created from different interfaces like you can create queries based on Universe, represent data in OLAP database as objects, flat files like Excel and CSV files, data in SAP InfoCubes using BEx queries, Analysis view or Query as a web service.
Each query has dimensions and measures. Measures always return numeric data based on the calculation and other objects in the data source. Queries can be hierarchical or non-hierarchical in nature. Non-hierarchical queries have no relationship between the objects.
Hierarchies define relationship between the objects. For example: In a Geographical hierarchy, you have measures based on geographical hierarchies like counties, states and cities. Using hierarchies, you can drill up and down to see data at the next level.
Query panel is not available, if you use Web Interface of Webi tool.
Query Definition
In a Webi document, you retrieve data in report from the data source using the query panel. All the queries are built in the query panel and interface of query panel depends on the data source you are using to get data.
Queries can be created on Universe, which contains Relational and OLAP data models, data from flat files like CVS, XLS files, SAP BW BEx query, and Analysis view. Query is run to get data from the data source. You can apply filters and also preview data in the query panel.
To open a Query Panel − Go to Web Intelligence → New → Select Data Source → Ok.
When you click Ok, you have to select data source from the list of selected data source type.
New window will open known as Query Panel. Select the objects from Universe outline, which you want to add to the report in result objects.
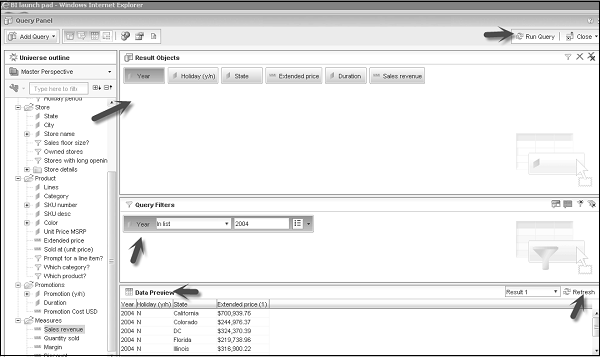
To add a filter, select the object in Query filters by dragging an object and select a value. For data preview, click Refresh tab. To add this query to the report, click Run Query option at the top of the screen to add to Webi document.
Query and Documents User Rights
You can view multiple objects in the Query panel and create, edit, and delete objects in queries as per login user access rights. Users are normally created by BusinessObjects Administrator. CMC is used to create user profiles to login to BO tools.
If you dont have enough access rights, you will not be able to access few objects of a report. Access rights are defined by the BO administrator.
Classes and Subclasses
Classes are used to group similar objects in a report. A class can contain one or more subclasses. Subclasses contains further subcategory of objects in the upper level of a class.
Classes are used to organize objects in a logical manner. While creating queries on Universe, you can find the information on objects that you have to use in query.
Dimension
Dimension lists all the objects using which we want to analyze the data. Dimension provides the basis for analysis in a report. Dimension normally contains non-hierarchical character type data like customer name, product name, customer address, sales office address, etc.
Common examples of Dimensions are - Product, Customer, Time, etc.
Analysis Dimension − An analysis dimension contains group of hierarchies related to each other. When you add an analysis dimension in a report, its default hierarchy appears in query.
 − Analysis Dimension appears as this symbol in the query panel
Attributes and Measures
Attribute provides data about dimensions or hierarchy. For example − Home address of a customer dimension. Attribute has one-to-one relationship with corresponding dimension. Each customer has only one address object.
 − Attribute appears as this symbol in the query panel
If your Universe is not designed correctly, an object returns the multiple values for a dimension and the corresponding cell in the report shows MULTIVALUE error.
Measures are defined as numerical values in the report on which analysis is performed. They are integer values, which are used to compare the performance of an organization with defined KPIs.
For example − Sales in each region, total Revenue per year, profit per product, etc.
 − Measure appears as this symbol in the query panel
Hierarchies
A hierarchy represents parent-child relationship in Universe. It allows you to drill up or down in the report to the next level. For example − Geography hierarchy contains Country, State and City. Time hierarchy contains Year, Quarter, Month and Week.
Using the member selector in defining hierarchy, you can define which member appears in the result set. In hierarchical data sources, hierarchies are associated with a dimension.
Members and Named Set in Hierarchy
Members are defined at different level of hierarchies in a data source. For example − Consider a Geography hierarchy containing members India at the country level and Haryana at the State level.
You can also include individual members in query from hierarchy, if you dont want to add all the members. Named set can be used to define a set of members.
A named set is defined as named expression and results a set of members. You can define named set at Universe level or a relational or OLAP database level.
SAP Webi - Queries using Universe
You can build queries in the Query panel using various data sources like Universe, BEx from SAP BW or an Analysis view.
Using Universe for Building Queries
Universe contains data from OLAP and Relational data sources. Data in Universe can be a relational data or hierarchical data.
Open Web Intelligence via BI Launchpad → New (Create a new Webi document). You will be prompted to select a Data Source.
Select a Universe as data source and click Ok. You will get a list of all available Universe. Select a Universe, which you want to use to create a Webi document.
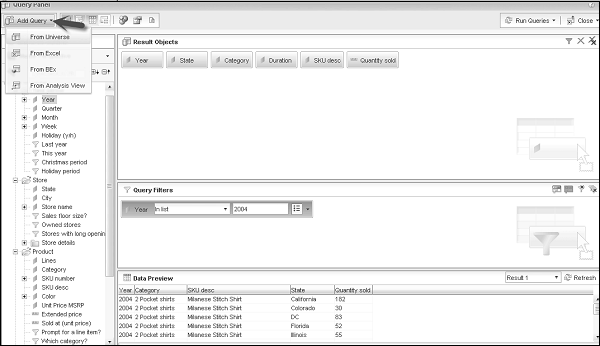
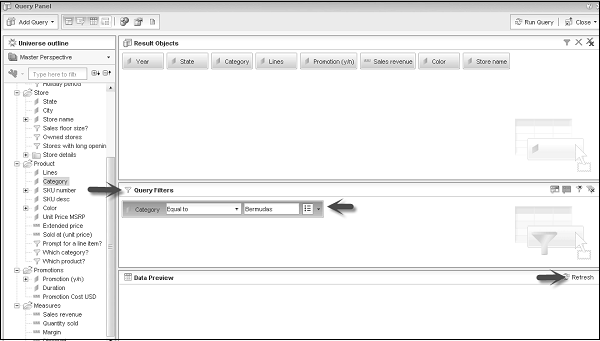
A new window will open with the name Query Panel. In the query panel, on the left side of the screen, you have a list of available objects. You have Result Objects where you drag objects from the left panel, which you want to add in a Webi document.
You have Query Filter using which you can add different filters. Data Preview can be used to view data before it is added to Webi document. Run query tab at the top of the screen is used to run the query.
In the Query panel, you have an option using which you can add data from multiple sources in a single Webi document by creating multiple queries.
To add a Query, go to Add query option at the top of the screen. You can select different data sources to add a second query.
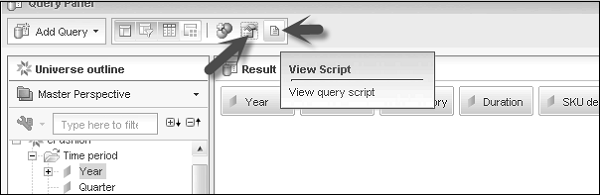
You can also edit the properties of Query, like the name of the query, number of records, etc. View Script option allows you to check the script of the query.
Following functions can be set using Query Properties −
| Sr.No. | Function & Properties |
|---|---|
| 1. | Retrieving duplicate rows Relational .unx, OLAP, but not available in BEx queries. |
| 2. | Returning sample result sets Available in relational .unx, but not available in OLAP .unx or BEx queries. |
| 3. | Retrieving/excluding empty rows Available in OLAP .unx only. Not available in BEx queries. |
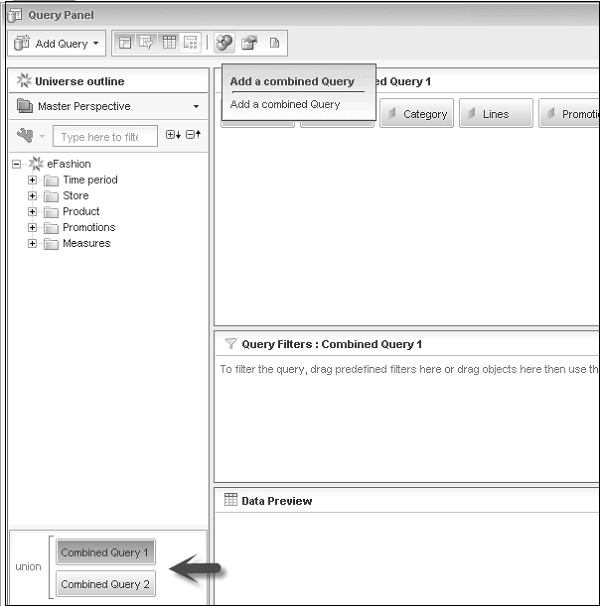
In this case, you have an option to run multiple queries separately. You can go to Run queries and select the query you want to run. You can also combine queries using the Query Panel.
SAP Webi - Queries using BEx
You can create Webi documents based on BEx (Business Exchange Queries) created by BEx Query Designer, which is based on InfoCube in SAP BW system. You can connect to a BEx query in Webi with the use of BI Consumer Service (BICS) connection. You need not create Universe for BEx queries, and all attributes, hierarchies, dimensions and measures are automatically mapped in Webi document.
You can edit, create, and refresh documents based on BEx using Web Intelligence Rich Internet Application Interface (Applet based) or Webi Rich Client. If you are using Webi DHTML web interface, you can only view or refresh a Webi document based on BEx but you cannot edit them.
Following important points about BEx should be considered −
You can only use BEx queries, which are flagged with Allow External Access to the Query.
To manage object mapping, refer to restriction and equivalent pages to ensure correct use of queries.
Following metadata objects are supported from BEx in Webi −
- Hierarchies
- Characteristics
- Navigation Attributes
- Display Attributes
- Basic Key Figures
- Calculation figures and formulas
- Restricted Key figures
- Variables
- Customized Structure
How to Enable Access to BEx Query?
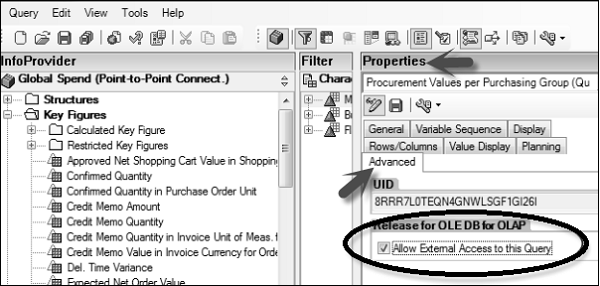
Open BEx Query Designer and select the query you want to use in BO tool. Go to Properties → Advanced tab and select Allow External access to Query. Save the query.
BICS Connection in CMC
You can create a BICS connection in CMC or also in Information Design Tool. A connection can be created to a single BEx query or to an Info Provider.
Login to CMC console → Select OLAP connection from the dropdown list.
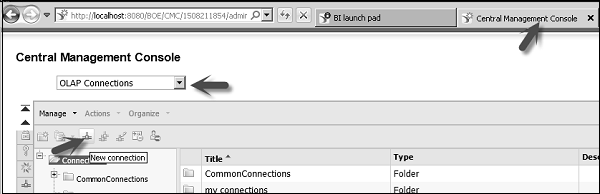
Click on a New Connection → In Provider list, select SAP NetWeaver Business Warehouse.
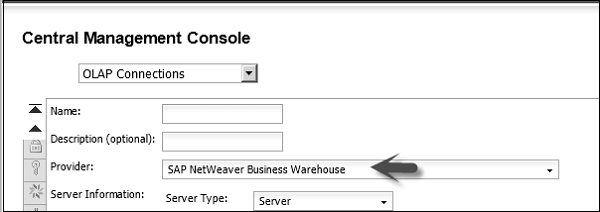
Similarly, you can define a BICS connection in IDT. Select an OLAP connection and choose SAP NetWeaver Business Warehouse → SAP BICS Client Middleware driver.
How to Use BEx as Data Source in WebI Rich Client?
Open Webi Rich Client → New Document.
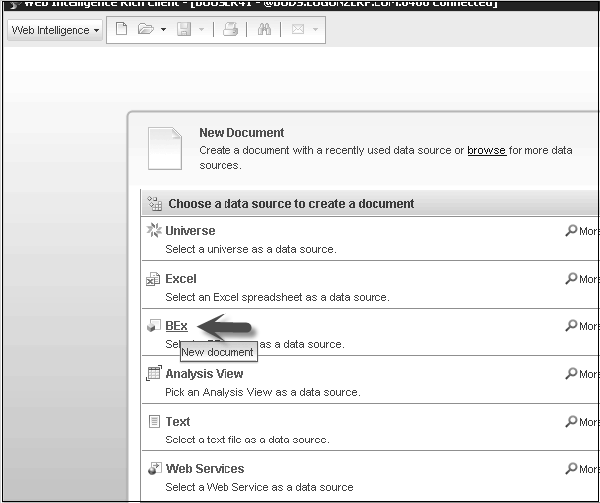
Click on select a BEx query as data source. In the new window, select BICS connection in the right pane and corresponding BEx query → Ok.
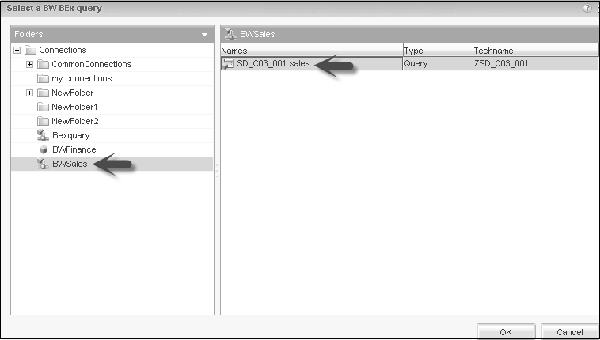
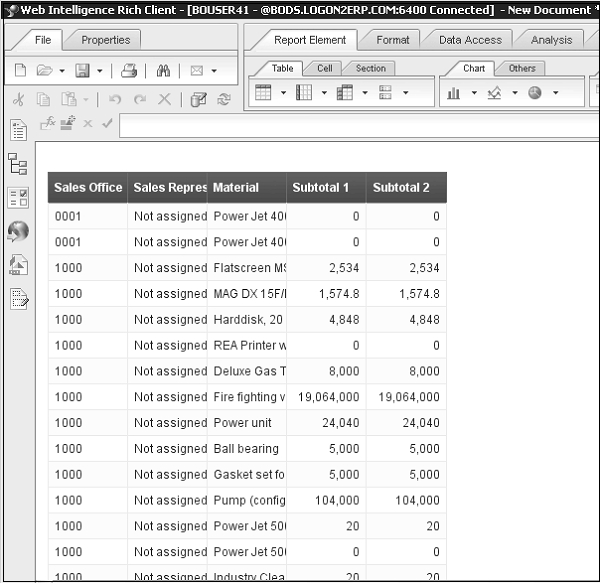
All the objects from BEx will be added to Query Panel on the left side. You can drag the objects to Result Objects.
Once you click on Run query, all the result objects will be added to a new Webi document as shown in the following snapshot.
SAP Webi - Queries using Analysis View
Analysis view is created in BI workspace. Analysis views with custom objects are not supported and it only supports Analysis view coming from SAP NetWeaver BW.
Open Webi Rich Client → New Document → Select Analysis view as Data source.
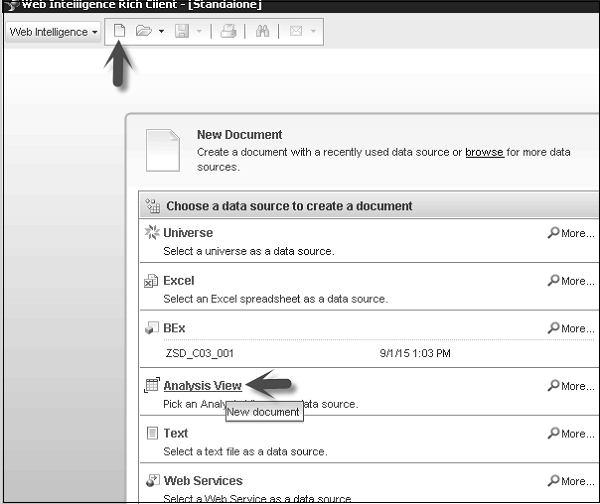
Select an Analysis View, and click Ok.
Managing Queries
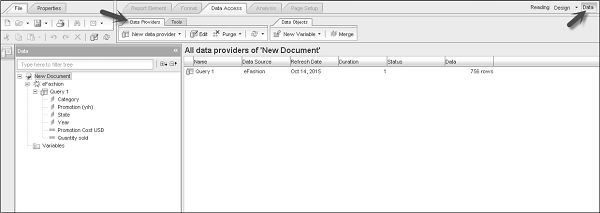
To manage multiple queries, you have an option of Data at the top right corner. This option is not available in Webi DHTML interface.
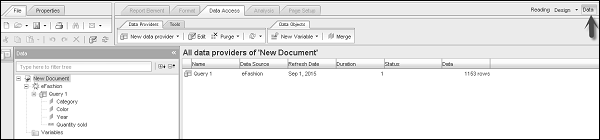
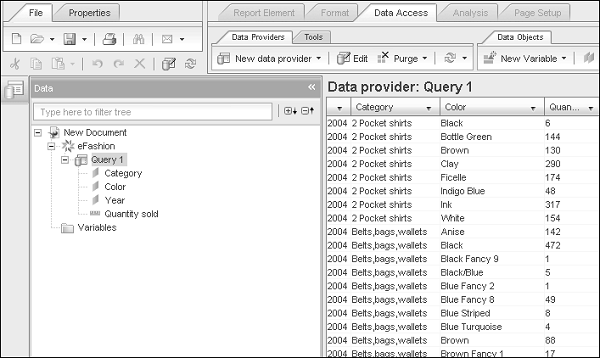
All the data providers appear in the list to the right side of the data pane. It also tells you the Data Source, Refresh date, Duration, status, etc.
To see the details of data, double-click on the Query. It will open the details of data added in Query.
To edit a query, right-click on query in Data mode. Select edit or you can also select an option of Edit in the tool menu.
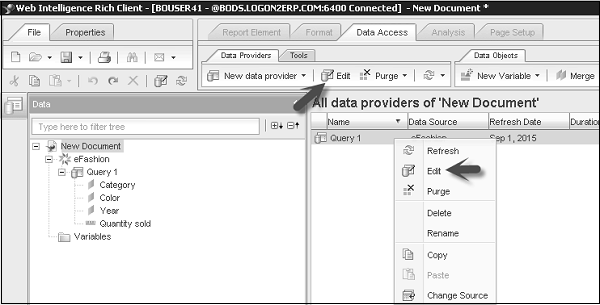
You can also Rename, Delete, Copy or Purge a query using this Data Manager option.
SAP Webi - Query Filters
Query filters are used to limit the rows returned in a Webi document. Query filters allow you to hide the data that you dont want to show to specific people and also limit the size of .wid document. When you run a query, it only returns the rows that meet the query filter definition.
Following are the key features used in Query filter −
You can retrieve data as per specific business requirement.
You can hide the data that you dont want specific users to see in a Webi document.
Limit the size of Webi document of the network and hence provides performance optimization.
Example − Being an Area Sales Manager for NY, you want to see the margin values for your region. Sales universe contains data from all the regions in United States. Also you only want to see data from the stores in NY where the sales margin is greater than 100K USD in the second Quarter (Q2) 2015.
Now to create a Webi document with this information, you have to apply filters on these dimensions - State, Year, and Quarter and Filter on sales margin.
Filter Operator AND |
| Filter Condition |
| Year = 2015 |
| Quarter = Q2 |
| State = NY |
| Sales Margin >= 100000 |
Difference between Query Filters and Report Filters
Query filters are applied in Query Panel and they are used to limit the number of rows from data sources and to return the same in the document.
Report filters are applied at the report level on reports, tables, charts, etc. These filters are not used to limit the data retrieval from the data source and only hide certain values at the report level.
Query Filter Structure
Query filter is applied in this format −
Object (On which filter is applied), Operator (You can use various comparison operators), and Operand.
Operand − You can select from the following list of Operands −
- Constant
- List of Values (LOVs)
- Prompt
- Universe Object
- Result from Other Query
Operators − You can select from the following operators −
- Equal to (=)
- Not Equal to
- Greater than
- Less than
- Greater than Equal to
- Less than Equal to
- Between
SAP Webi - Query Filter Types
Following types of query filters are normally used −
- Predefined Filters
- Custom Filters
- Quick Filters
- Prompts
You can add multiple filter types on a single query.
Predefined Query Filters
These filters are normally Administrators and saved at the Universe level. They are used to populate data that is permanently available.
These filters require some good knowledge of database design and complex expressions. Using predefined filters on Universe means you dont need to create custom filter every time when a new Webi document is created.
Also note that you cant access the components of Predefined filters and it is also not possible to edit them.
To add a Predefined filter, you can drag or double-click this filter to Query Panel → Filters Pane.
When you run the query, corresponding data w.r.t filters will be added to the report.
How to Use a Predefined filter?
You can use a Predefined filter by a double-click or just by dragging the filter to Query Filter.
Quick Filters
Quick filters are used to quickly retrieve the values you want without the use of filter editor. Quick filters use equal to operator while using a single value or list in operator when you use multiple values.
Quick filters cant be used with BEx queries.
How to Use a Quick Filter?
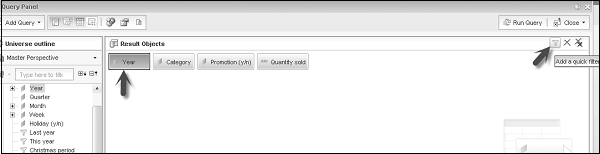
Quick filters are used in Query panel. To apply a Quick Filter, select the object you want to filter.
Select Add Quick Filter at the top right corner of Result Object Pane.
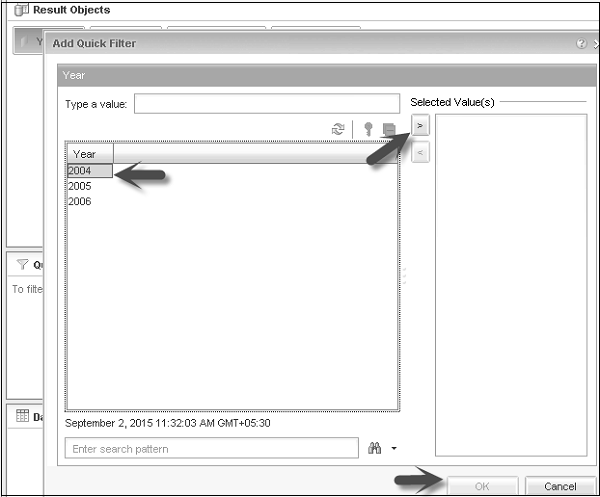
New dialog box will open. You have to select the value you want to use in the Quick filter from LOVs.
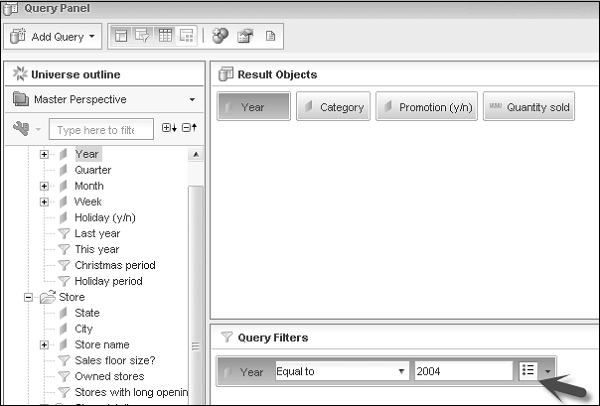
That filter will be added Query Filters pane. To delete this filter, select the filter in Query filter pane and press Delete button.
Custom Query Filters
You can also create custom query filters to meet the business requirement or to hide the data from specific users.
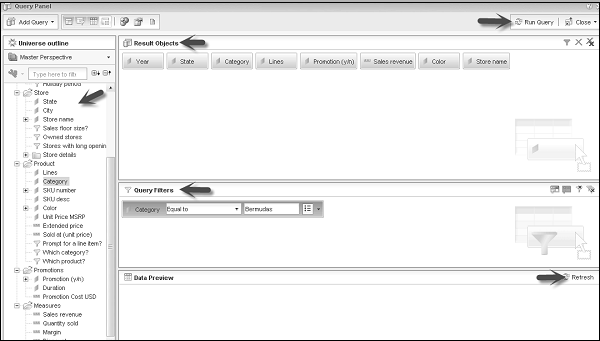
To create custom query filter, add the object you want to use in the filter. Drag it to Query filter pane. Click the arrow next to default operator and select the operator.
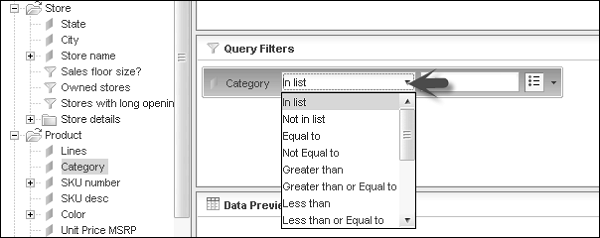
Click on the arrow to select the filter type.
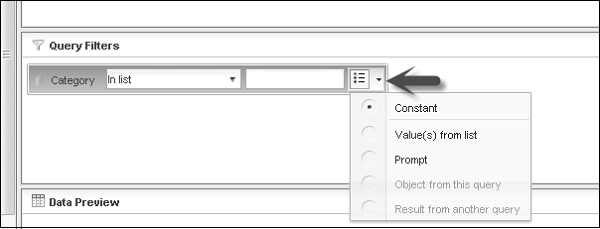
You can select the following filter type −
- Constant
- Value from list
- Prompt
- Object from this query
- Result from another query
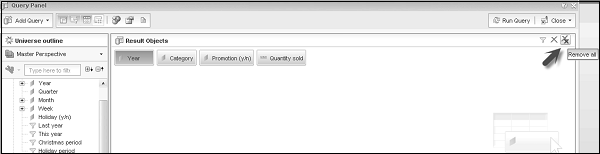
Select the value from this that you want to include in the filter. To remove a filter, select the filter and press Delete button. To remove all the filters, use Remove All option at the top right corner of the screen.
Prompts
Prompt is defined as a special filter for users, which allows them to enter a value every time data is refreshed in the document.
Using prompts, you have multiple users viewing one document to display different sub set of data in database. Prompts allow you to retrieve the data from database and reduce the time.
Following are the elements of a Prompt −
- An Object
- An Operator
- Message
Example − Current Year Equal to (Enter the Year). In this Prompt, Current Year is the object, Equal to is the Operator and prompt message is Enter the Year.
A Prompt can be applied to Dimension, Measures, attributes, hierarchies, etc.
You can use AND, OR operators to create multiple prompts in the same query. While using BEx and .unx Universe, you can only use AND operator with prompts.
Merged Prompts
When you use multiple data providers in a single document, you can merge multiple prompts with same data type, same operator types and same prompt text are merged. While refreshing all the data providers, one prompt appears for all multiple prompts.
LOVs displayed by merged prompt is the list associated with the object in prompt with the most displayed property constraints.
Hierarchical Prompts
You can also create hierarchical prompts where the following objects display their LOVs hierarchically in a Prompt −
- Hierarchies
- Levels
- Dimensions associated with hierarchical LOVs
Hierarchical prompts are displayed in a tree form and you can navigate up and down the tree. As per the filters in Prompt, you can select items from different levels of LOVs.
Building Prompts
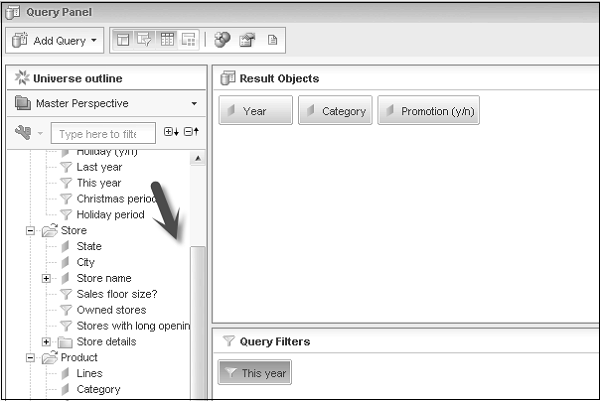
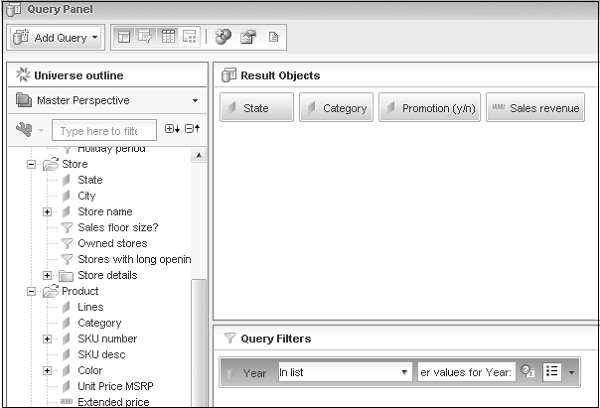
To build a prompt, add the object you want to filter with a prompt to Query Filter pane.
Select the filter operator from the list and click on the last arrow mark to select a prompt.
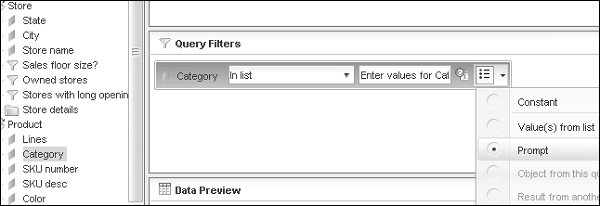
You can add the text message for Prompt value and run the query.
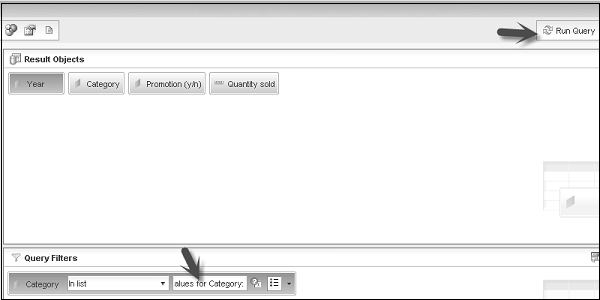
When you run the query, Prompt dialog box will allow you to enter the values as per the selected operator.
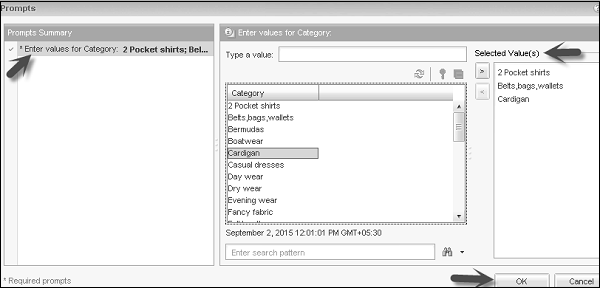
When the values are selected and you click Ok, and the data for selected values in the document will be reflected.
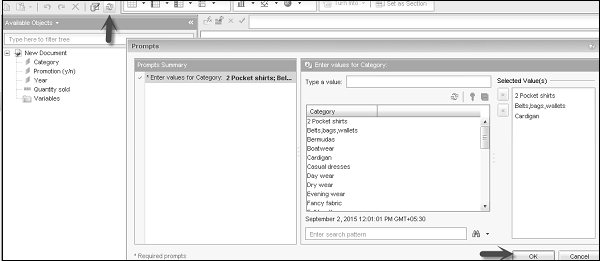
When you refresh the document in Webi, prompt will appear every time to select the values.
Select an Existing Prompt
You can also select from existing prompts to add to the query in query panel.
To use an existing prompt, drag the object on which prompt has to be applied to query filter pane.
Select from Universe, select an existing Prompt → Ok. It will display the list of all prompts that are compatible with the object in Query filter.
Deleting a Prompt
To delete a prompt, select the prompt in Query filter pane and press the Delete button. You can also select Remove or Remove all option.
Combining Prompts with Query Filter
You can also combine prompts with query filters to limit the data in the document and to select a specific record from the filtered data.
Example − You can apply Query filters for Department and Year and Prompt for a specific Employee name input.
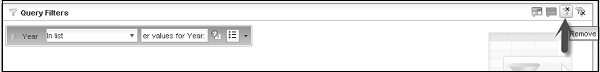
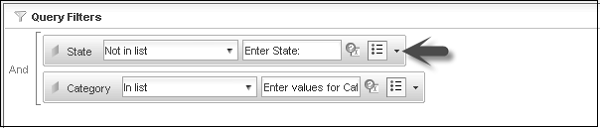
State Not Equal to Florida
Year 2005
Which Category
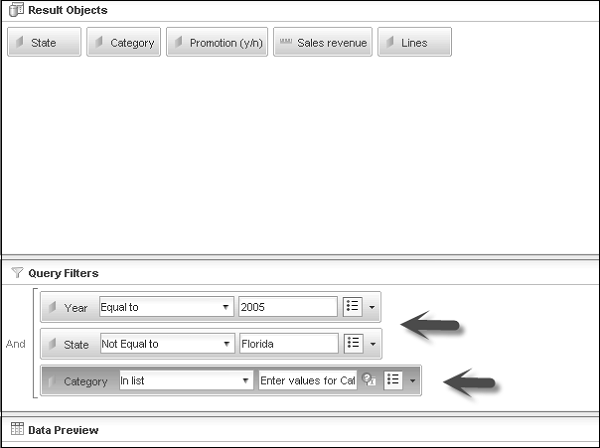
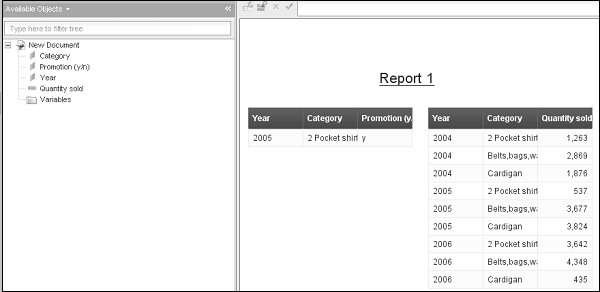
When you run the query, it will ask you to enter the value for Category.
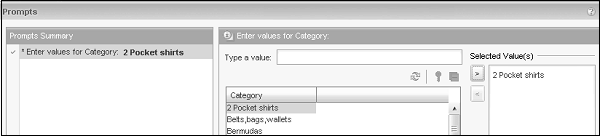
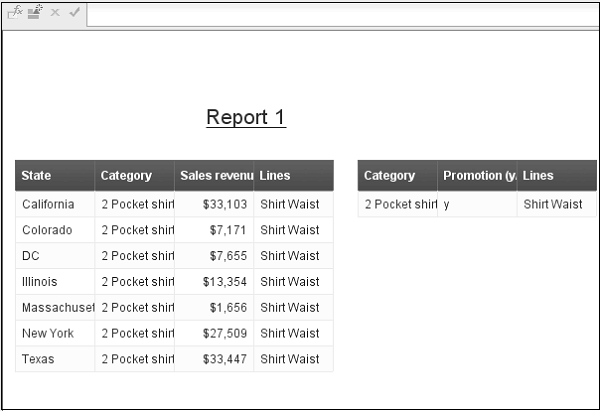
In Webi document, it will filter the data as per filters in the query panel and display the result according to Prompt value.
Order of Prompts
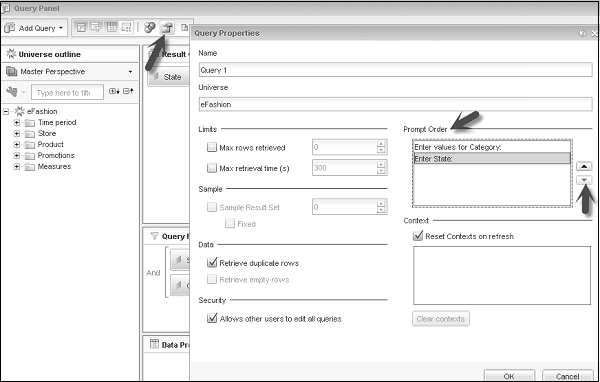
You can also use multiple prompts in a single query. To add multiple prompts, drag all the objects on which you want to apply prompts. Select prompt by clicking on Arrow mark in the end of query.
To define the order of Prompts, you have to go to Query properties at the top. From there, you can select the order of prompts as per requirement. You can move up/down a prompt from the list.
Subqueries for Data Filtering
Subqueries provides a more flexible option to filter the data as compared to an ordinary query filter. Using subqueries, you can limit the values returned with a WHERE clause. You can also compare the values of objects in a subquery with the other objects.
Using subqueries, you can implement complex logic to limit the size of data, which is not possible to apply with simple query filters.
Subqueries work on SQL which is used to retrieve the query data. SQL is supported by most of RDBMS and each database uses its own syntax. If any database doesnt support SQL, an option to create a subquery will not highlight in the query panel.
Subqueries can be built on dimensions, measures and attributes and not on the hierarchical objects.
Building a Subquery
Select the object in the result pane on which you want to build a subquery.
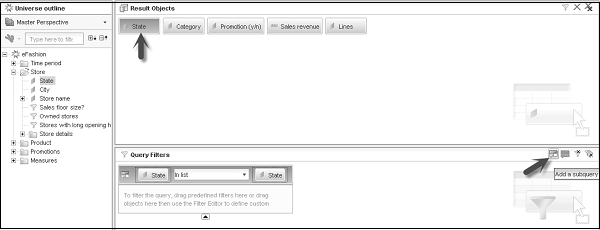
It will add a subquery outline in the Query filter pane. Now if you want to add a WHERE condition, drag an object to the area of subquery.
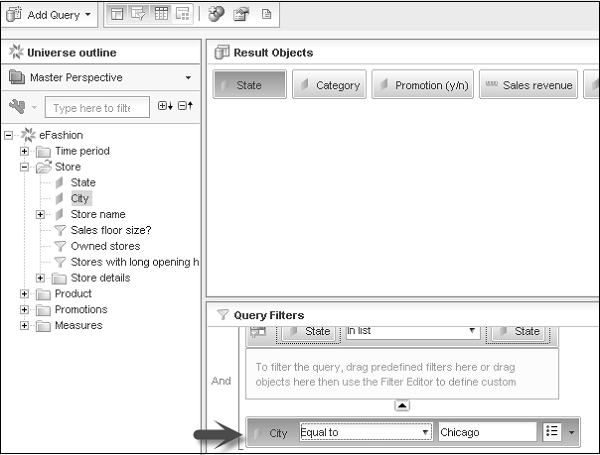
Select the Operator and Value used to filter object in WHERE condition. You can add multiple subqueries to query panel. You can use AND or OR relationship between subqueries. To change the relationship, you can click on AND to change it to OR.
By default, two subqueries are linked with an AND relationship. You can also nest a subquery. Drag a subquery to the area and drop an object.
Parameters − You can use the following parameters while passing a subquery to Query filter pane.
Filter Objects − These are the objects whose values are used to filter result objects.
Filter By Objects − The object that determines which filter value subquery returns.
Operator − This operator defines the relationship between the filter object and the filter by object.
WHERE Condition − This is used to constraint the list of values of the filter by object.
Relationship Operator − AND, OR
SAP Webi - Ranking Data
You can rank the unranked data from the database in your report. Database ranking allows you to rank the data at database level so when you run a query, data returned by query is already ranked.
Database ranking is done by editing the script generated by query. If your database doesnt support ranking, then the option to create ranking will not highlight in query panel.
Also note that Ranking cant be created on hierarchical data.
Creating Database Ranking
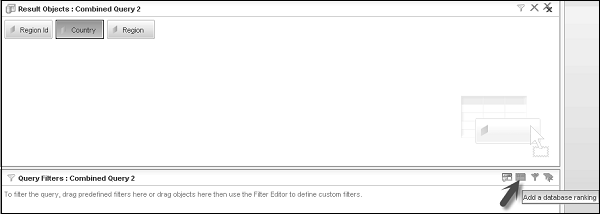
First add the objects to Result Objects in Query panel. Select Add Ranking at the top of Query filter pane.
Select the ranking dimension and type - top, bottom, top %, and bottom %.
You can select the number of records or % of records you want the rank to return in the next box. Drag the ranking dimensions, measures, to based-on box. You can also drag dimensions to provide a calculation context to Ranked by box. You can also add WHERE condition by dragging a dimension to the bottom of ranking.
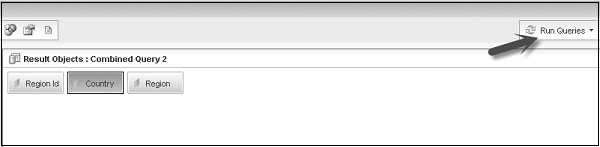
Click Run Query.
SAP Webi - Working with Reports
Webi Report can contain hierarchical and non-hierarchical data according to data source used to create the report. Hierarchical and non-hierarchical data works in different way in the report. A non-hierarchical data contains no parent-child relationship. Hierarchical data contains parent-child relationship between objects and you can use them to analyze and navigate data in a report.
Working with Non Hierarchical Data
Non-hierarchical data is defined as data with no parent-child relationship. A simple example of non-hierarchical data is Dimension.
A non-hierarchical data can be analyzed using various parameters like sorts, filters, etc.
Example − Customer, Product
Working with Hierarchical Data
Hierarchical data is defined as data with Parent-child relationship and you can analyze the data at different levels of hierarchy.
All the measures that are associated with hierarchical data are aggregated as per object level in hierarchy.
Example − Consider a Geography hierarchy; you have Country India and State defined as Delhi. Now if you use this geographical hierarchy in report and want to analyze Number of Units sold at each level for different categories, then hierarchies allow you to use Aggregation at country level and if you drill down to state level, for each state too.
Hierarchical Data in Tables
Hierarchical data is presented in columns in hierarchical tables. Below table shows the hierarchal data in parent-child relation and aggregated on Quantity sold as measure.
| India | 1200 |
| Delhi | 600 |
| Kerala | 200 |
| Haryana | 400 |
If you see the above table, the number of units sold for corresponding country India is 1200 and corresponding value at each hierarchy level is also shown.
Organizing Data with Sections, Breaks, Sorts
You can use sections to divide the information into smaller part for better analysis. Section allows business managers to analyze the data in a more effective manner.
Example − You are an area manager in a multinational company and you have received Sales report showing total revenue for each city and quarter as shown in the following table for the year 2015 −
| City | Quarter | Total Revenue (USD) |
|---|---|---|
| Delhi | Q1 | 50000 |
| Delhi | Q2 | 40000 |
| Bangalore | Q1 | 30000 |
| Bangalore | Q2 | 40000 |
| Mumbai | Q1 | 50000 |
| Mumbai | Q2 | 40000 |
Now if you want to apply Section on Quarter column, you can compare the Total Revenue in each city compared on the basis of Quarter.
Q1
| Delhi | 50000 |
| Bangalore | 30000 |
| Mumbai | 50000 |
Q2
| Delhi | 40000 |
| Bangalore | 40000 |
| Mumbai | 40000 |
Creating a Section from a Column
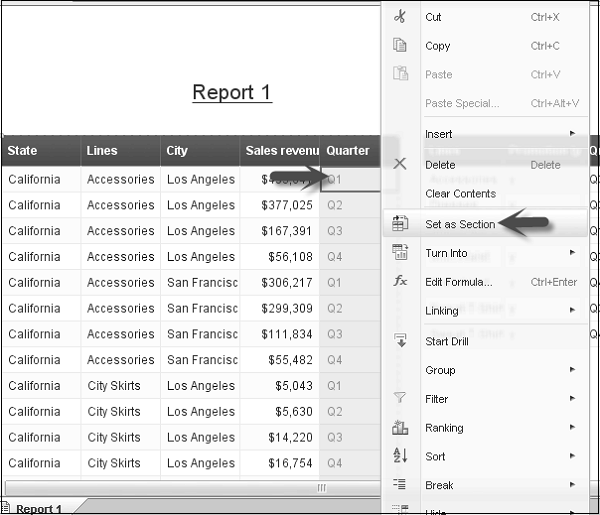
To create a section on a column, Select the data and column, right-click on the column and select set as Section.
Creating a Section from a Dimension
To create a section from a Dimension, Go to Report Elements → Section → Insert Section.
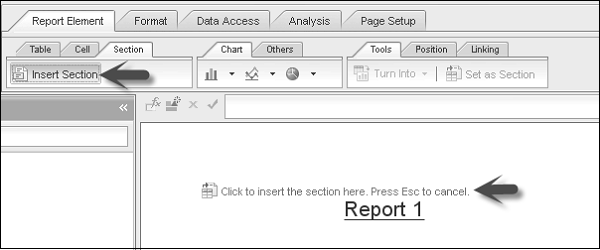
Click on the report area where you want to insert a Section. Choose the Dimension on which Section has to be created.
Creating Sections from Hierarchy
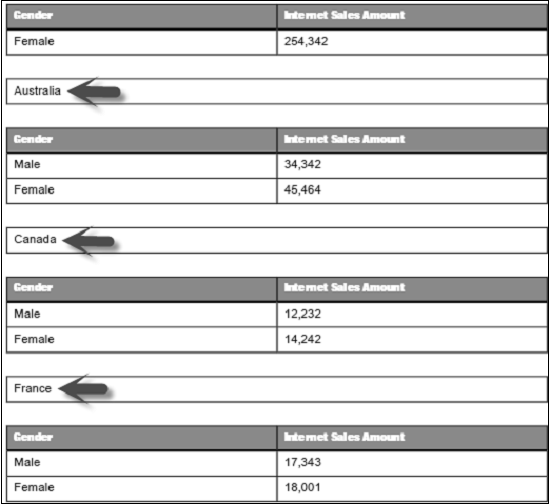
You can also create Section on Hierarchies in the report. When a section is created on a hierarchy, each member of hierarchy becomes a section header.
Let us understand this with the help of an Example −
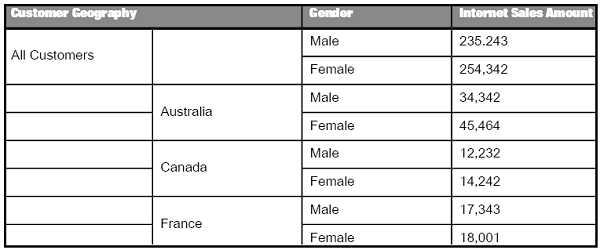
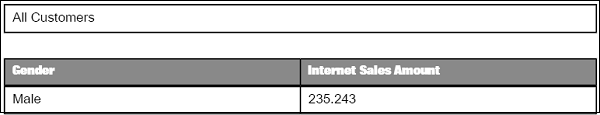
If you create a section on Customer Geography, you will get the following report.
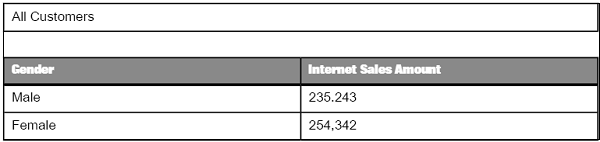
By expanding the Section header, you will get the following report.
Removing or Hiding a Section
To delete a Section, right-click on the section Select → Delete.
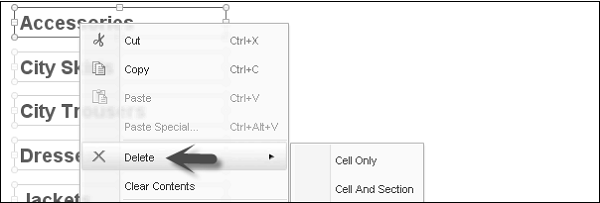
If you select Cell Only, it will delete Section Cell only and if you select Cell and Section, it will remove Section and Cell both.
To Hide Sections − Select Section. Go to Report Elements → Behaviors → Hide to hide the section.
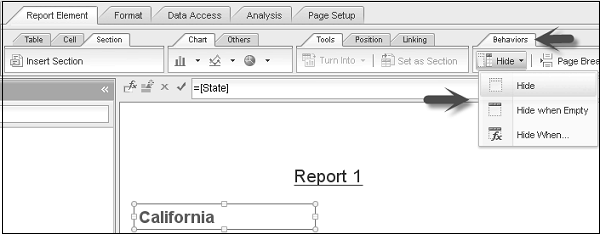
Hide When Empty is used to hide the section when empty.
Hide When-Enter the formula is used to hide the Section. If formula is true, it will hide the section.
SAP Webi - Breaks
Breaks are used to define all data for every unique value of an object in separate parts. Using Breaks you can apply −
- Subtotals and Sub aggregations
- Display data in more effective manner
Break vs Sections
Section breaks up the data into multiple cells that are called section headers and each section header contains a value for dimension and data corresponding to dimension value.
Break is used to divide the data into one block and each column carries dimension, attributes and measures. These values are repeated for each row value in the block.
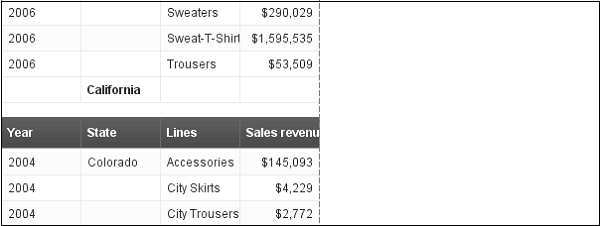
How to Insert a Break?
Select the column in which you want to insert a Break. Go to Analysis → Display → Break → Add Break.
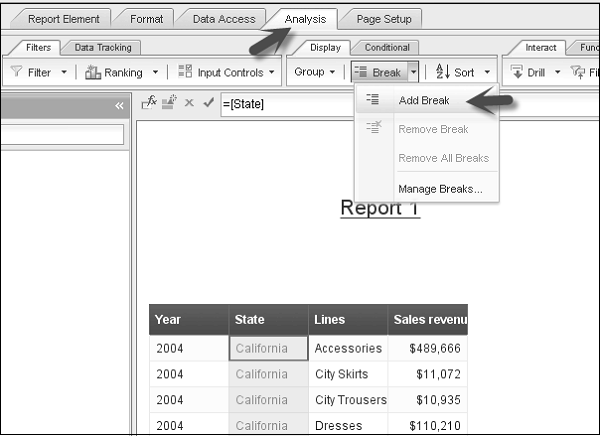
This will divide the table into many mini tables as there are unique values in the column.
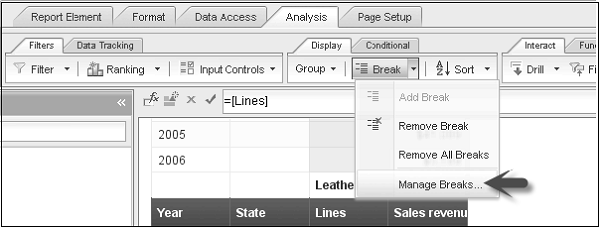
Manage Breaks
To manage a break, you should use Design mode.
Go to Analysis → Display → Break → Manage Break. It will open a new window and show all the breaks in the table.
You can define the following properties about Break in this dialog box. You can prioritize Break using up-down arrows.
- Display Properties
- Page Layout
- Duplicate Values
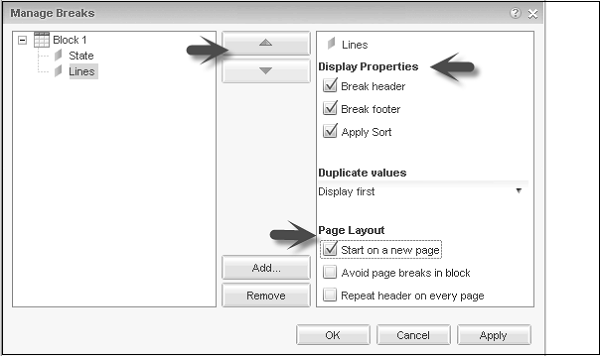
You can also Add or Remove a Break using Break Properties.
SAP Webi - Sorts
Sorting can be applied in table on sections, charts to organize the data in a specific order in a Webi report. Default sorting that is applied in a report is from left to right order of objects in Result object of Query Panel.
You have the following Sorting Orders −
Default − This is default order where data is sorted as −
Ascending numeric order for numeric data
Ascending chronological order on date
Chronological order for months
Alphabetical order for alphanumeric data
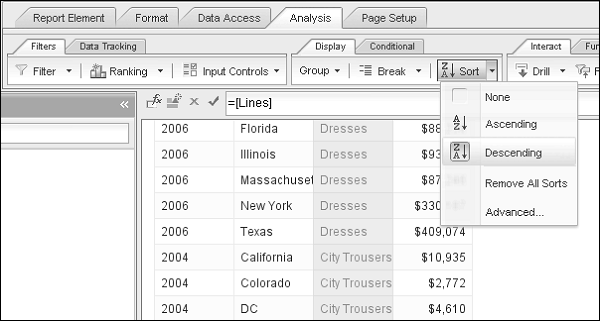
Ascending − In this, smallest value at the top to highest value at the bottom. Example − 1000, 2000, 3000, or Delhi, Kolkata, Mumbai
Descending − In this, highest value at the top to smallest value at the bottom
Custom − Using this, you can define your own sort order. Custom orders are available on dimensions and attributes and not on hierarchies, measures and level.
How to Insert a Sort?
To insert a sort, open report in Design mode. Select the Column you want to sort.
Go to Analysis → Display → Sort → Ascending/Descending
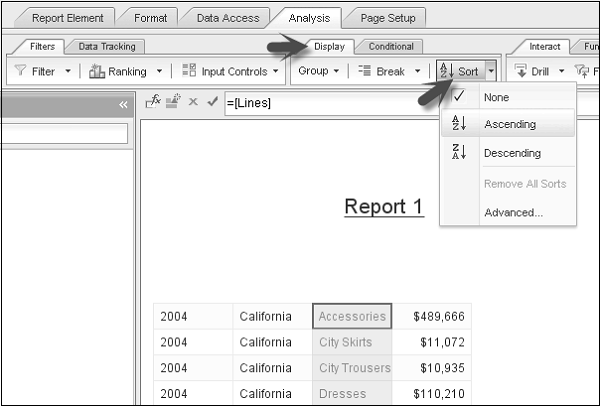
You can apply multiple sorts in a single table on different columns. You can use Remove All Sorts option to delete all the sorts.
To manage the Order of Sorts, go to Advance tab. You can define order for all sorts using up and down arrows. You can define Custom Sorts here if no other sort is applied.
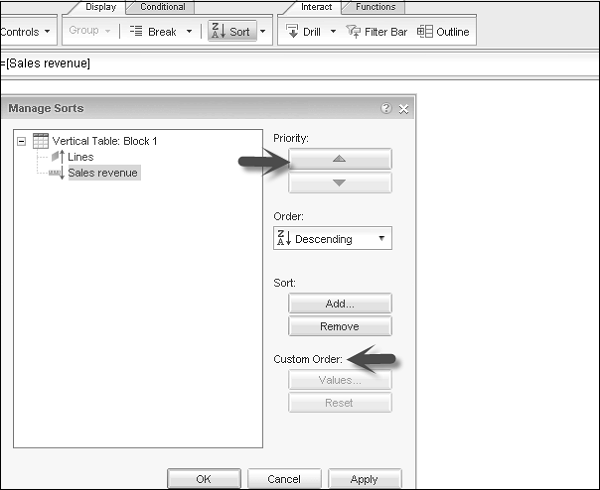
This can also be used to Add/Remove Sorts.
SAP Webi - Charts
In a Webi document, you can include one or more charts. You can insert charts in an existing document or in a new document.
When a Webi document containing chart is exported into an Excel or PDF format, the chart is converted into an image.
Chart Types
You can convert the tables in a Webi report into different chart types. There are different Chart types available in Webi.
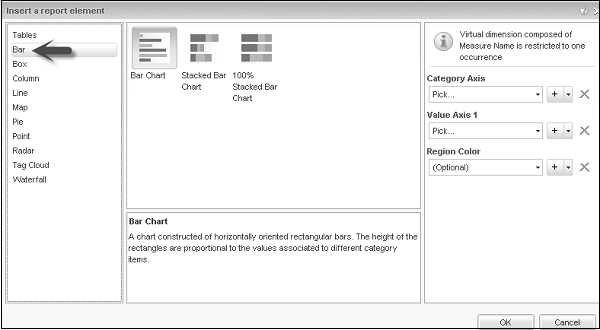
Bar Charts
Bar charts are used to compare similar groups of data and they display data in rectangular form horizontally. Following are the different types of Bar Chart −
- Bar Chart
- Stacked Bar Chart
- 100% Stacked Bar Chart
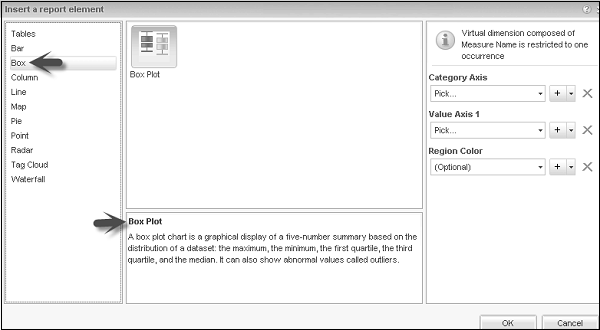
Box Plot Charts
As mentioned in description of box charts, it is a graphical display of a five number summary based on distribution of a dataset: the maximum, the minimum, the first quartile, the third quartile, and the median. It can also show abnormal values called outliers.
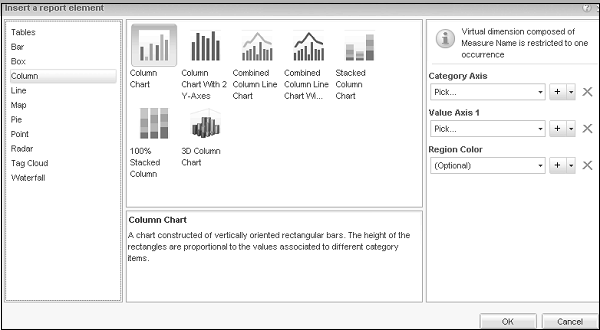
Column Charts
Column charts are constructed of vertically-oriented rectangular bars. The height of the rectangles are proportional to the values associated with different category items.
Following are the different types of Column charts −
- Column Chart
- Column Chart with 2 Y-axes
- Combined column Line Chart
- Stacked Column Chart
- 100% Stacked Column Chart
- 3D Column Chart
Line Charts
An XY chart that displays lines connecting plots. Value axis plot positions are expressed by analysis category items. The second value axis plot positions represent the associated values.
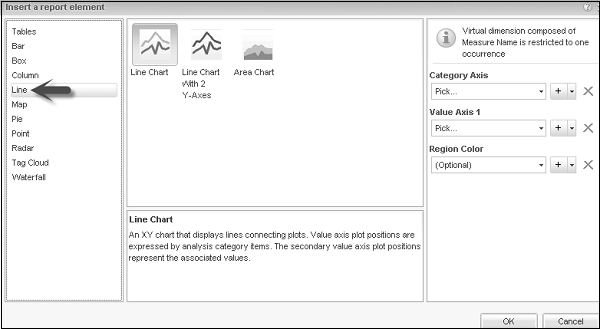
Following are the different types of Line Chart −
- Line Chart
- Line Chart with 2 Y Axes
- Area Chart
Map Charts
This chart displays values within nested rectangles that can be colored. The levels of nesting correspond to the levels of hierarchy breakdown. The size of rectangles and their color both express a set of values.
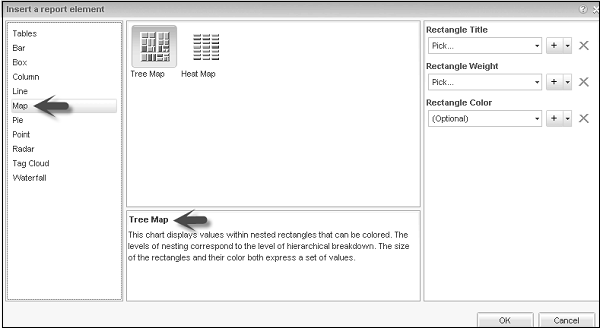
Following are the different types of Map Charts −
- Tree Map
- Heat Map
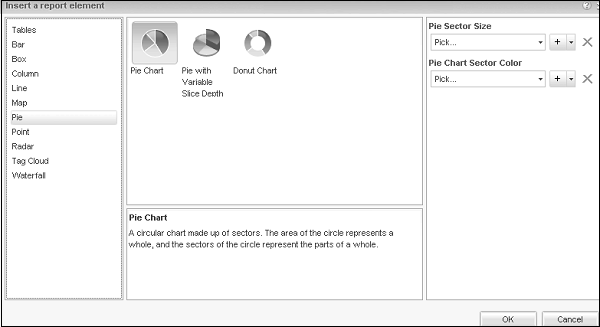
Pie Charts
A circular chart made up of sectors. The area of circle represents a whole, and the sectors of circle represent the parts of a whole.
Different types of Pie Charts −
- Pie Chart
- Pie Chart with Variable Slice Depth
- Donut Chart
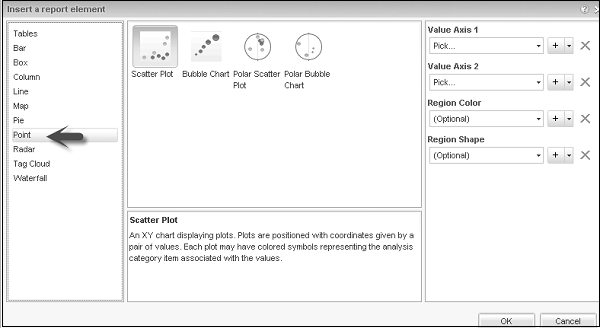
Point Charts
Point chart is an XY chart displaying plots. Plots are positioned with coordinates represented by a pair of values.
Following are the different type of Point Charts −
- Scatter Plot
- Bubble Chart
- Polar Scatter Chart
- Polar Bubble Chart
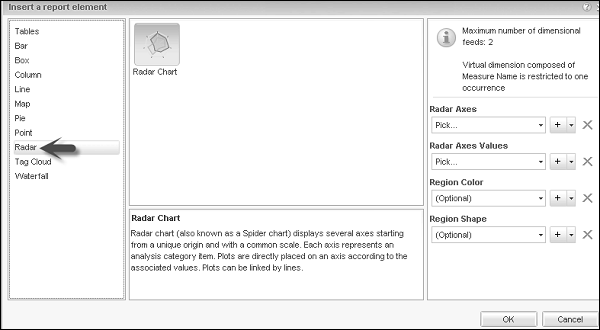
Radar Chart
It is also known as Spider chart and displays several axes starting from unique origin with a common scale.
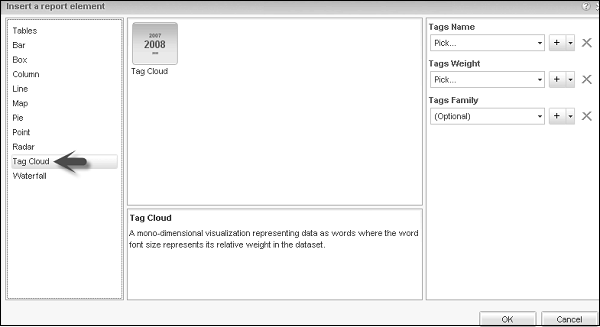
Tag Cloud
A mono dimensional visualization representing data as words where the word font size represents its relative weight in dataset.
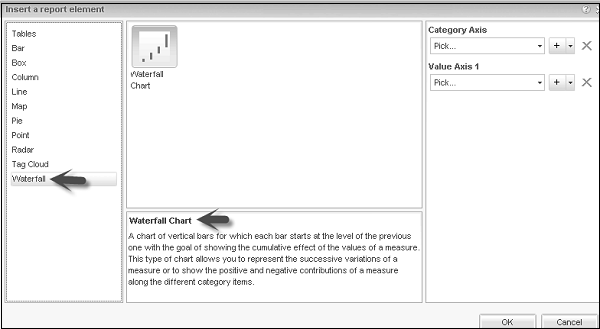
Waterfall
It is used to show the cumulative effect of values of a measure and each bar starts with the level of previous one.
Add a Chart to Report
You should be in Design mode to add a chart. There are different ways to add a chart to a Webi Report.
Method 1
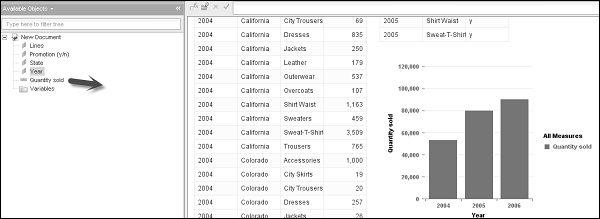
Go to Report Element → Chart → Select a Chart and click on the report area where you want to insert a chart.
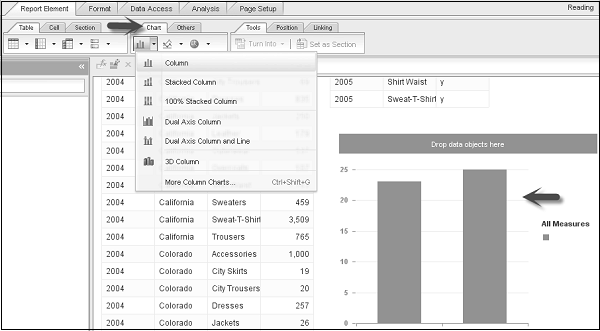
Chart is greyed when there is no data assigned to it. To assign data, you can drag the object from the list of available objects to chart axes.
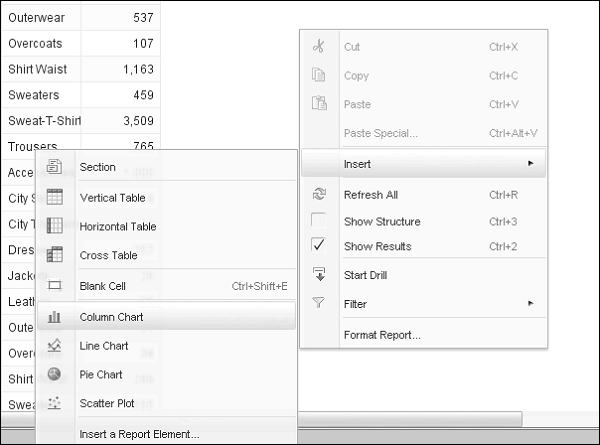
Method 2
Right-click → Insert → Select the Chart type as shown in the following screenshot. Click the report to add a blank chart and then assign data by dragging objects from the list of available objects.
Method 3
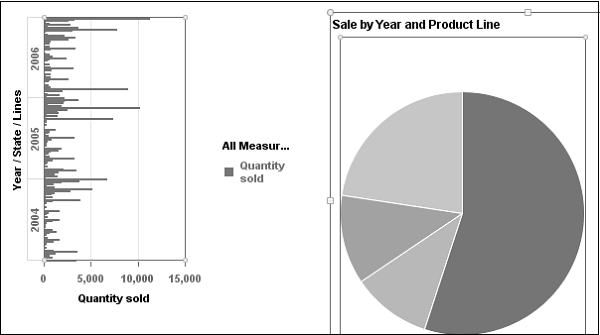
Another method is by converting a table into chart. You can do this by selecting a table in a Webi report. Right-click on a column → Turn Into → Select a Chart.
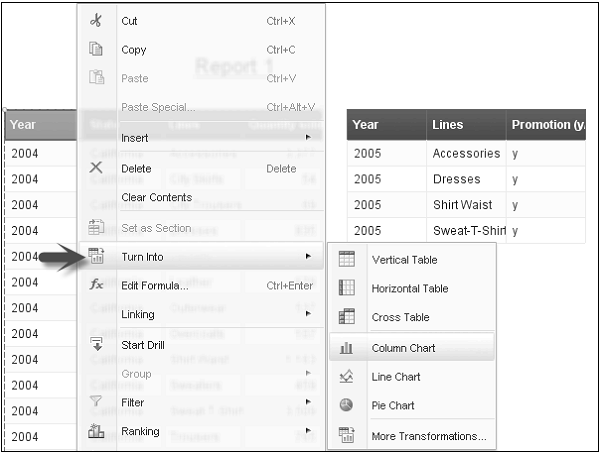
The table will be converted into a column chart.
Copy Chart
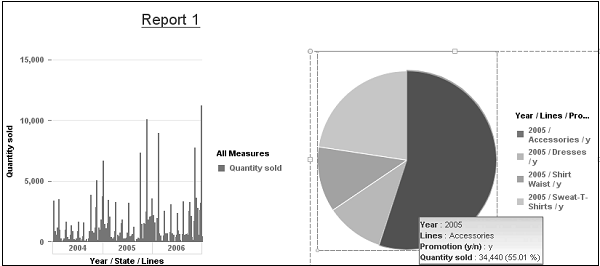
You can also copy a chart from a Webi report to the same report or to an application. To copy a chart, you have to first select the chart.
To copy a Chart, right-click on the chart and select copy.
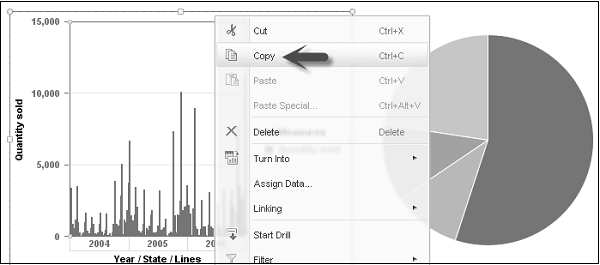
Now to paste this chart in the same report, select an area in the report. Right-click and Paste.
To copy this chart to an application, you can drag the chart directly to an open application or this can be done by copying the chart to the clipboard and pasting it in the application.
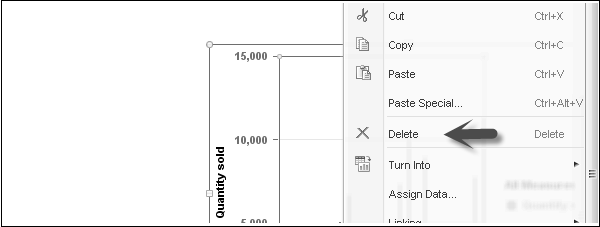
Delete a Chart
To delete a chart, you can select a chart. Right-click → press Delete or select delete option.
Changing a Chart Type
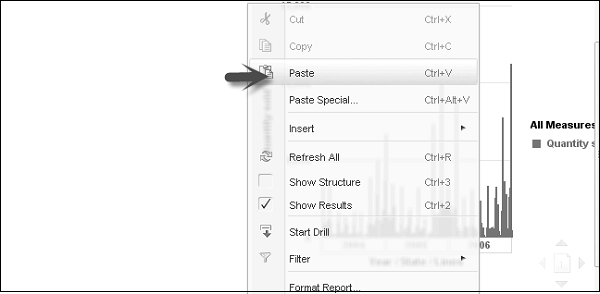
Select the table or Chart → Right-click → Turn into → More Transformations.
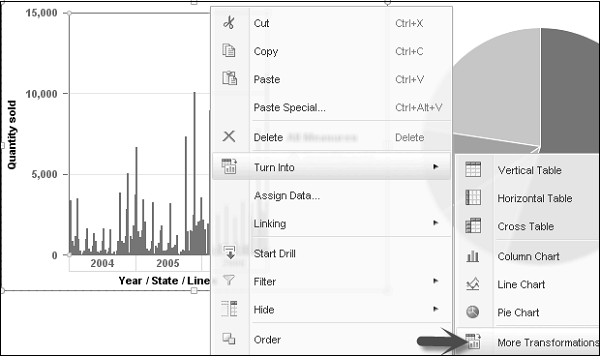
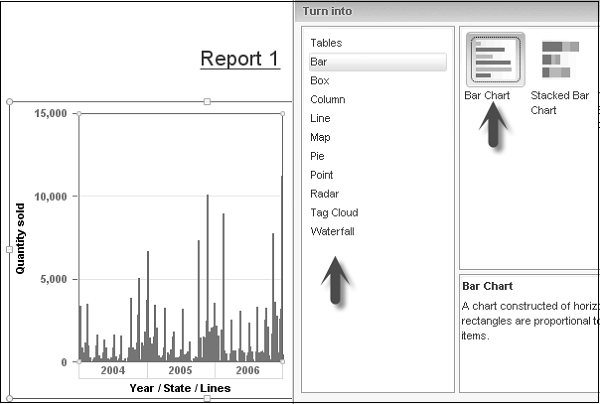
Once you click on More Transformation, it will open a window with different Chart options. You can select any chart type and the chart will be changed in the report.
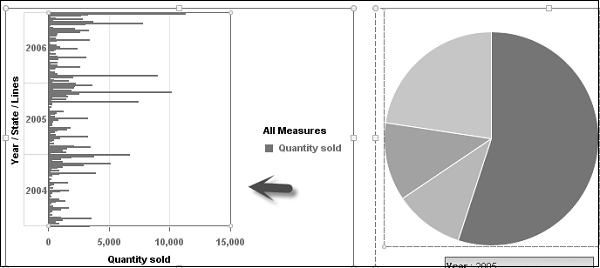
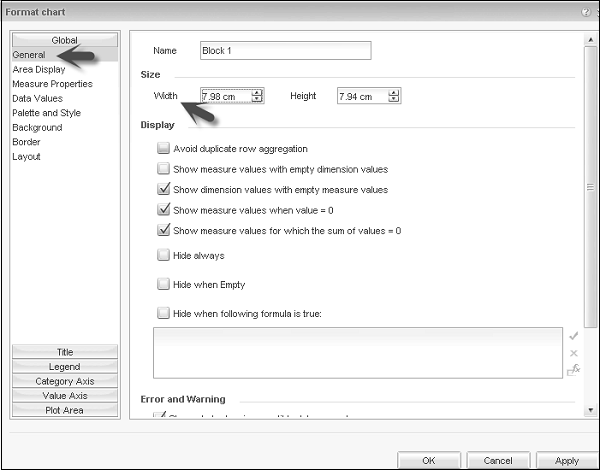
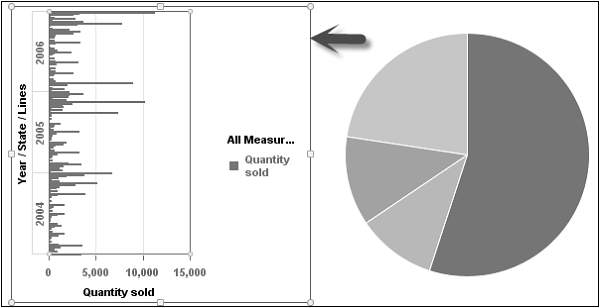
Resize Charts
You can also resize the chart by using the mouse option. Right-click the chart and select format chart option. It will open a new window. Go to General tab → Width and Height option → Select the chart parameters. Click Apply and then Ok.
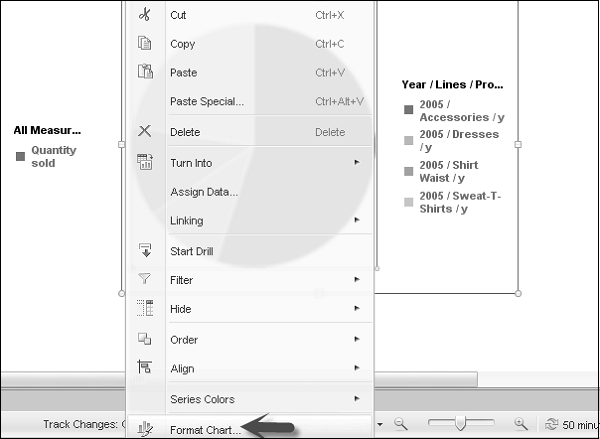
Formatting a Chart
To format a chart → Select the chart → Right-click → Format Chart.
Following are the various chart properties you can choose from −
- Area Display
- Data Value
- Background
- Border
- Layout, etc.
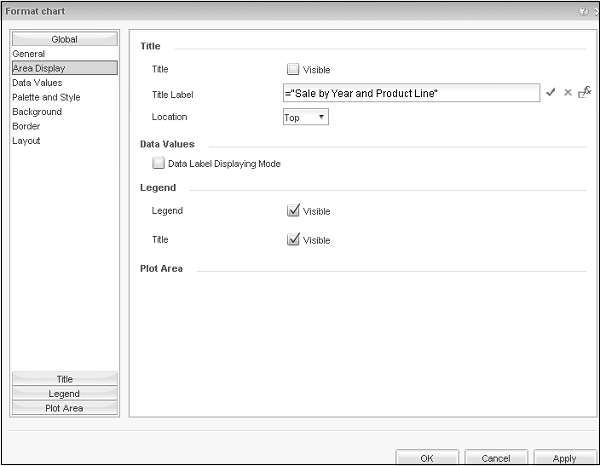
Once you make Title label visible, it will be displayed at the top of Chart.
SAP Webi - Conditional Formatting
Conditional Formatting is used to highlight some specific values in the report. If you want you can show specific low or high values with some specific colors. Conditional formatting can be applied to the following elements −
- Rows in horizon tables
- Columns in vertical tables
- Cells in forms and cross-tables
- Sections
- Free holding cells
Condition formatting can be used to make the following formatting changes − Text color, size and style, cell border, color, size and style, and cell backgrounds.
You can add up to 30 conditional formatting formulas in a Webi document.
Creating a Conditional Formatting Formula
To create a conditional formula, open the report in Design mode. You must be using Rich client or App Interface and shouldnt work in Web mode.
Go to Analysis → Conditional → New Rule. It will open formatting rule editor.
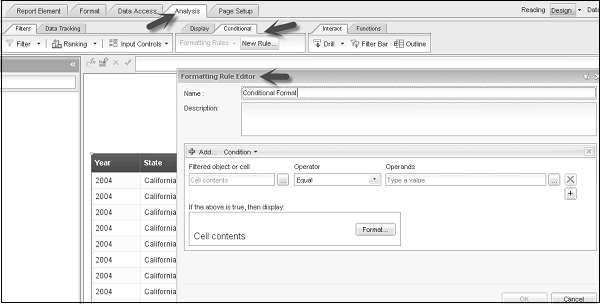
Enter the rule name and description. Select the cell contents in filtered object or cell box.
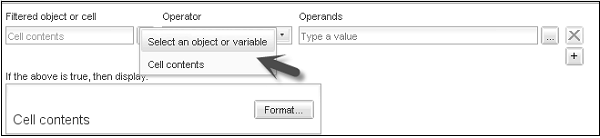
You can select Operator and Operands value. You have to define text formatting in Format tab. Click on Format to set the formatting of the tab.
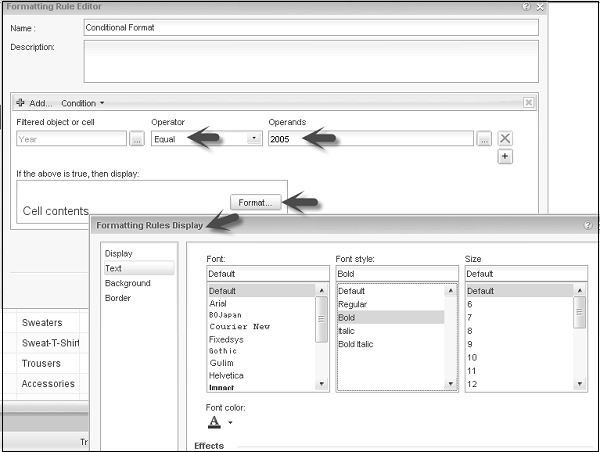
You can select the font, font style, size, effects (underline, etc.) and alignment. Once formatting is defined for condition, you have to click Ok.
Now to apply conditional formatting to the object, select the column in the report. Go to formatting rules dropdown → Select the conditional formatting rules checkbox you have created.
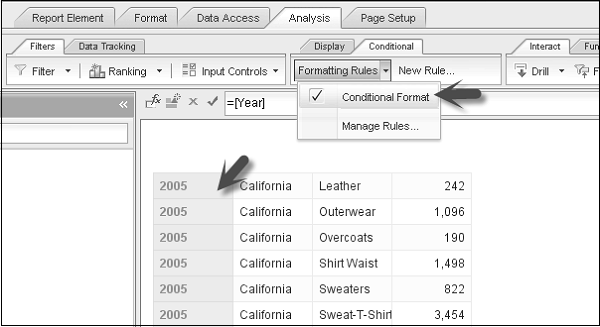
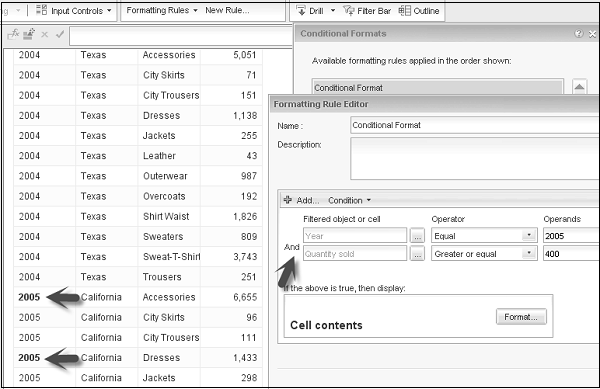
Conditional formatting will be applied to the desired cells. You can add multiple conditions in a single formatting rule on multiple objects.
Manage Conditional Formatting Rules
Go to Analysis tab → Conditional → Manage Rules.
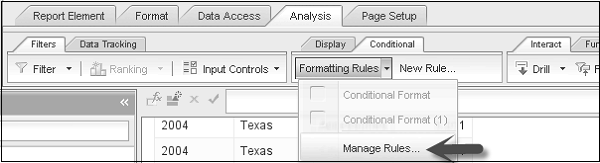
Once you click Manage Rules, it will open window for Conditional Formats. To edit a rule, select the rule and click on Edit. You can also change the order of Conditional Formatting rules.
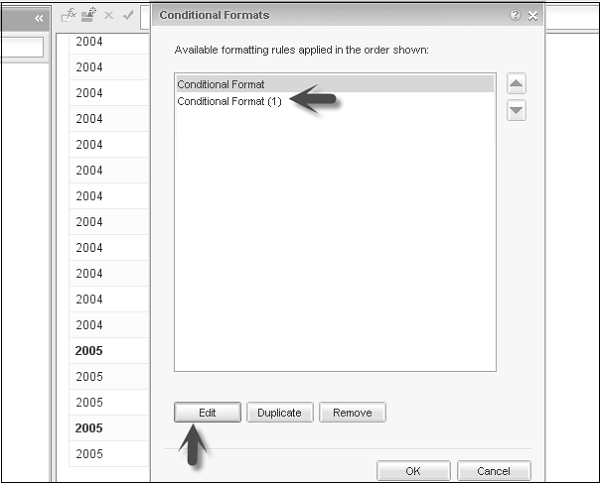
You can also duplicate/remove conditional formatting rules using Manage option.
SAP Webi - Filtering Report Data
You can filter the data in a report to limit the data displayed in a Webi document. You can select filter condition to present the data that is of your interest.
Data filtered using Report filters remain in the document and any time you can remove the filters to check hidden data.
You have to mention the following elements to create report filters −
- Filtered object
- Operator
- Filter value
- Report element where filter has to be applied
Example − You can apply a filter to see data related to a specific customer or sales region.
Query Filters vs Report Filters
Query filters are defined at query level in query panel and they are used to limit the data retrieved from the data source and return to a Webi document.
Report filters are used to hide the data in a table, report, chart, section in a Webi document. Report filters dont edit the data that is retrieved from the data source.
Report Filter Operators
You can use various operators to filter the data at the report level. Following are some of the common report filter operators −
- Equal To
- Not Equal To
- Different From Operator
- Greater Than
- Greater Than or Equal To
- Less Than
- Less Than or Equal To
- Between
- Not Between
- In List
- Not In List
- Is Null
- Is Not Null
Types of Report Filters
You can create the following types of report filters −
Standard Report Filters − These filters are used to filter on a single value or lists of values. These are most flexible type of report filters.
Simple Report Filters− They provide an easy way to create filters using Equal to operator. These filters apply on single value.
Create, Edit, Delete Standard Report Filters
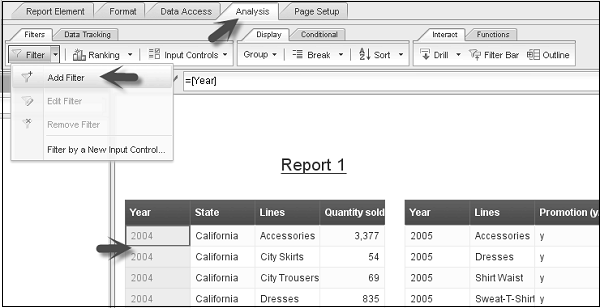
Select the Report Element you want to apply a filter. Go to Filter → Add Filter.
It will open the Report Filter dialog box. You can add objects, operand and value to apply filter at the report level.
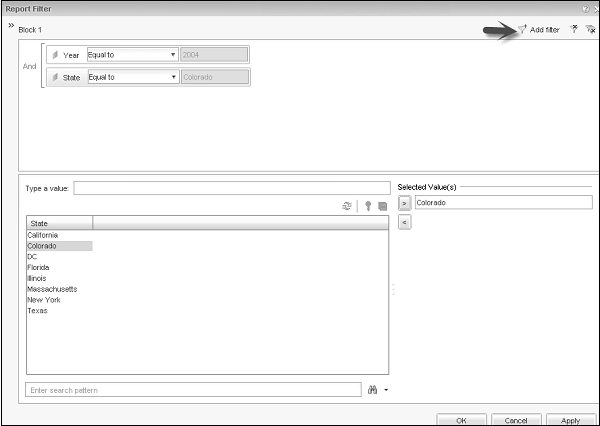
Using the functions − Add Filter, Remove or Remove All − you can add or delete filters accordingly.
To Edit a Filter → Go to Analysis Tab → Filter → Edit Filter.
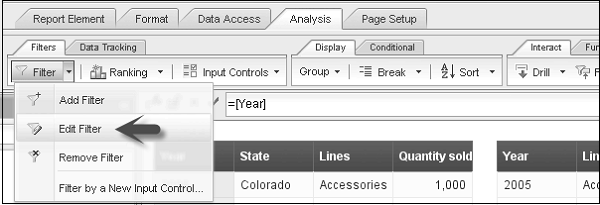
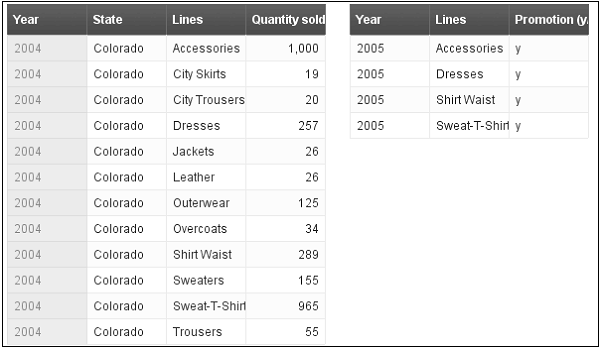
You can make changes to filters in Report Filter Dialog box. Click Ok to apply.
To Delete a Filter, Go to Analysis → Filter → Remove Filter. Click Yes to remove the filter.
SAP Webi - Input Controls
Input controls are used to filter and analyze the report data. You define input controls using text boxes and radio buttons. Input controls are associated with report elements, like tables and section headers, and use control to apply filter on report elements.
When you select a value for input control, it filters the values in the report element that is associated with input control by selected value.
Input controls can also be used on hierarchical data.
Defining Input Controls in Webi
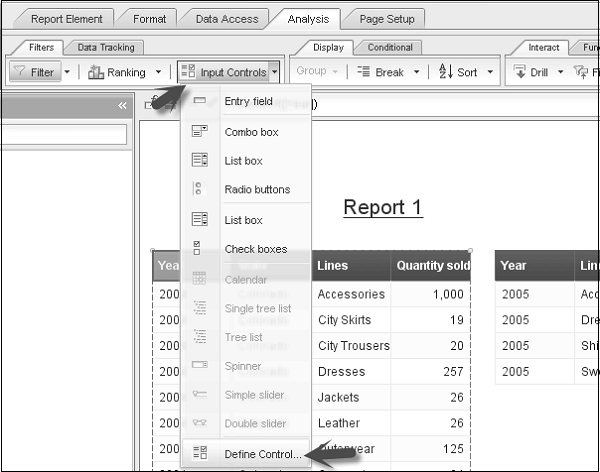
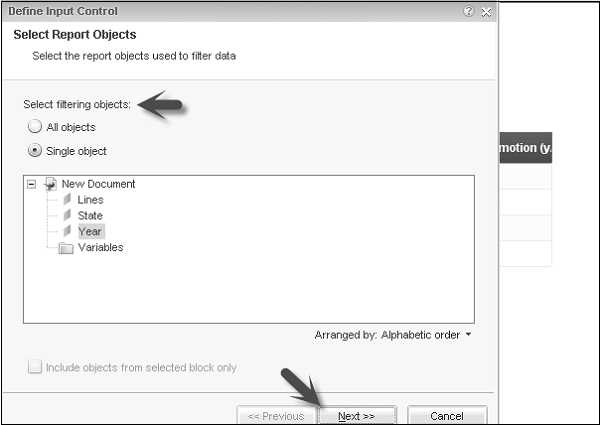
You should be in Design mode to use input controls. Go to Analysis → Filters → Input Controls → Define Control.
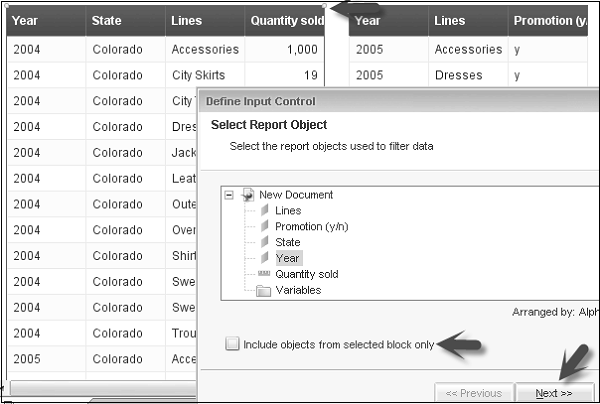
It will open Define Input Control dialog. Select the report object used to filter data and click Next.
Note that if you select a Report element and then you select Define Control, you will get an option to include objects from selected block only. If you select this checkbox, it will show you objects only from the selected report element.
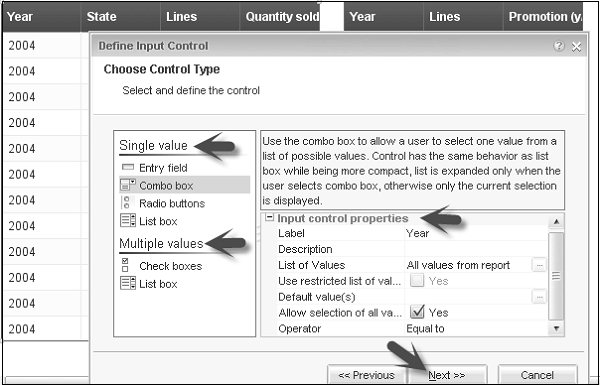
You will get an option to choose and define control. Choose control allows you to select different control types like single value or multiple values. Define control allows you to select the name of control, description, values in control to select, operator and number of lines displayed in input control, etc.
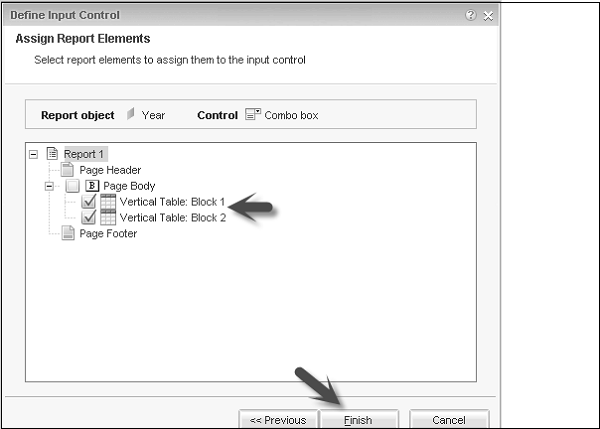
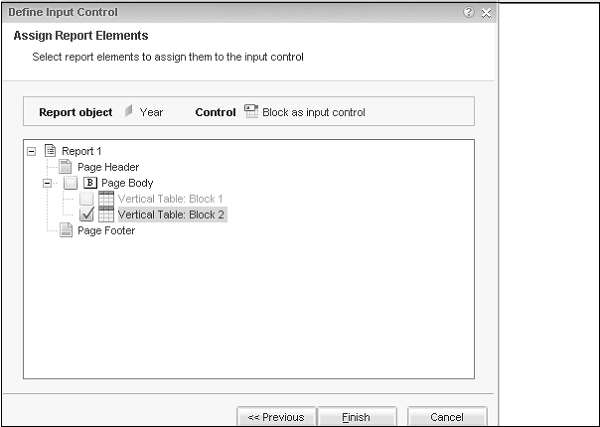
In the next window, you have to assign Report Elements. It will allow you to choose from report elements. You can assign report elements to input controls. (Example − I have selected as input control from both the blocks as shown below).
Click Finish and input controls will be added to the left pane under Input Control tab.
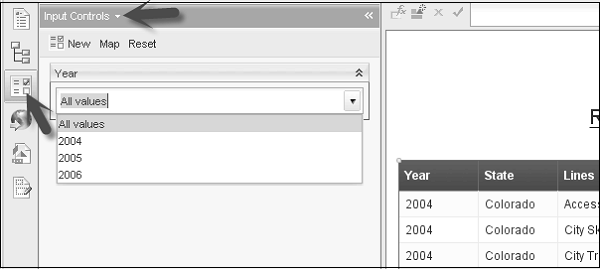
Now as per your selection of input control and type of input control, data will be reflected in the report.
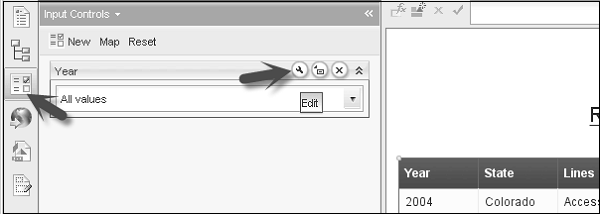
Edit an Input Control
To edit an input control → Select Input control from the left pane → Click Edit icon.
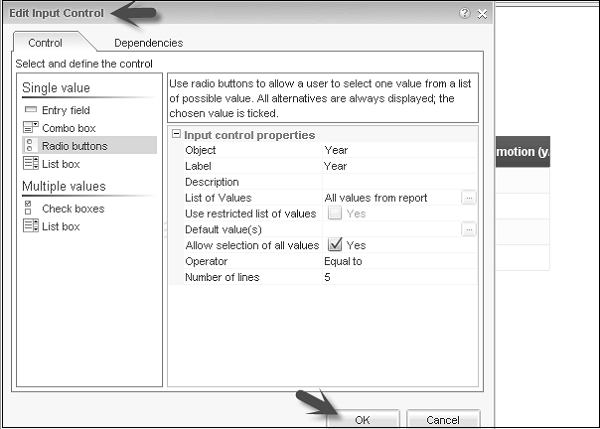
It will open Edit Input Control dialog box. Make changes to Input Control and click Ok.
Organize Input Controls
To organize input controls, go to Input control tab on the left pane.
Drag and drop input controls to move them up/down on input controls pane. Just hold the input control dialog box and move it up and down.
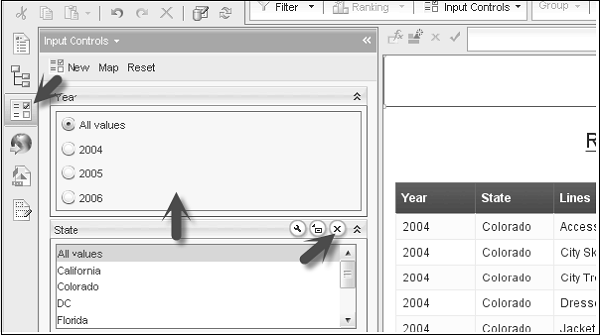
Use the x mark to remove the input control.
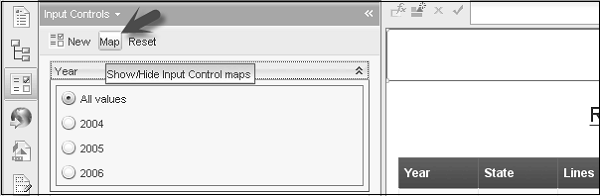
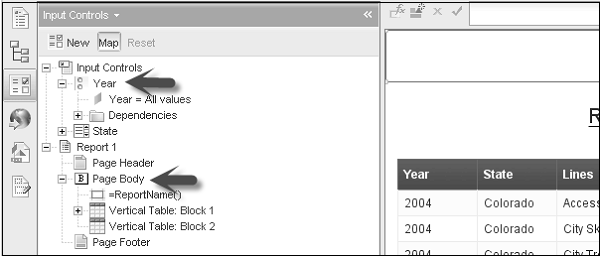
View Input Controls Map
To view map of input control, select the input control → Click Map at the top.
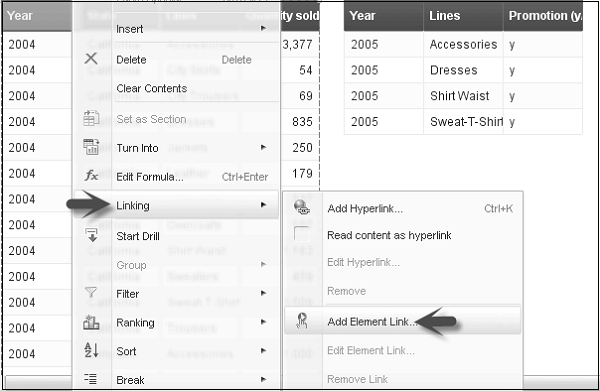
Define Table and Charts as Input Controls
You can also use a table or chart to define input control. Select the table → Right-click and select linking → Add Element Linking.
You can select a single object or all objects to define as filtering objects. Click Next.
You can enter the name and description of input control. Click Next. Once you click Next, you can select any other block to use this object as input control. Click Finish.
Similarly, you can use charts as input control for other Report elements.
SAP Webi - Formulas and Variables
You can also insert formulas and variables in a Webi report.
How to Enter a Formula?
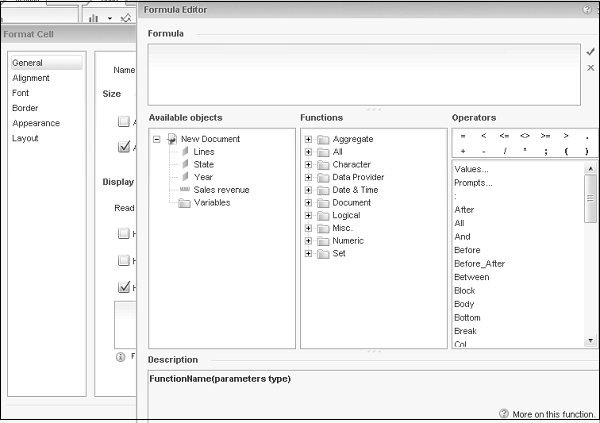
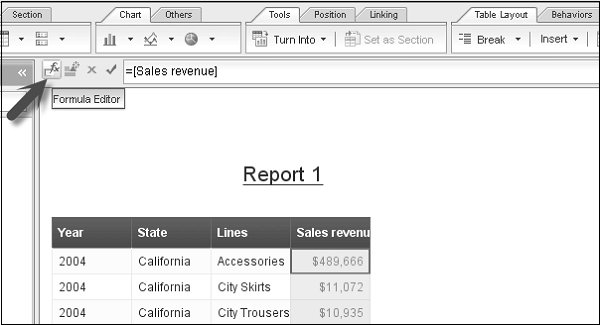
To enter a formula in Webi report, the report should be opened in Design mode. Click the formula editor to enter a formula.
Once the formula editor is open, build the formula. If the formula editor is not visible, go to Properties tab → View → Formula Bar.
How to Create a Variable?
The report should be in Design mode to create a Variable in formula.
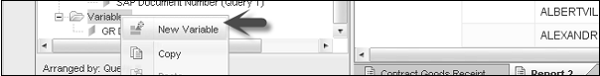
To create a variable, click on Create Variable icon in formula bar to display variable editor.
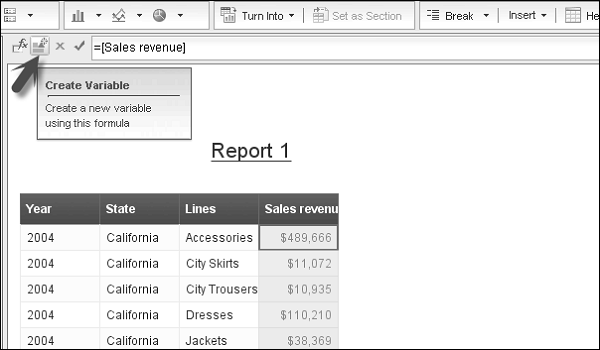
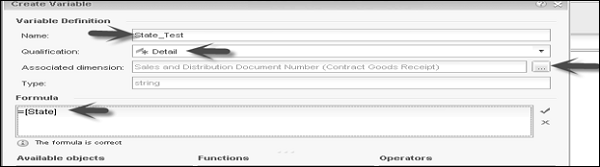
Enter the name of Variable, Qualification - Dimension, Measure, and Detail. If you select Detail, it opens a new field - Associate dimension.
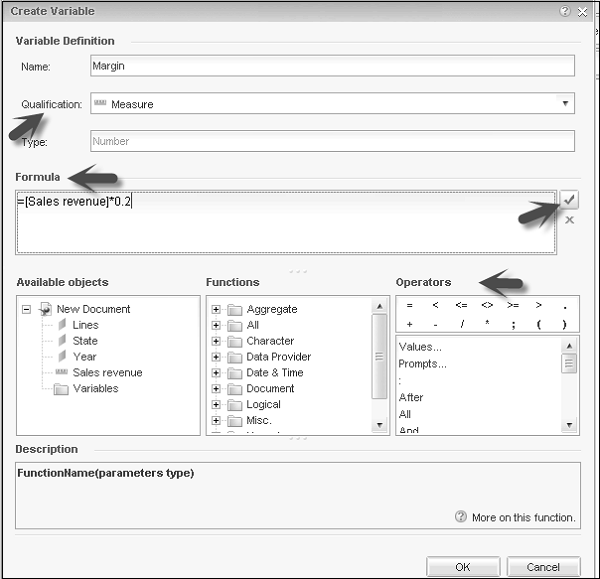
Enter the formula for variable, you can select from the list of available objects, functions and operators to create a formula. You can click on the tick mark to validate the formula. Once the formula is defined, click Ok.
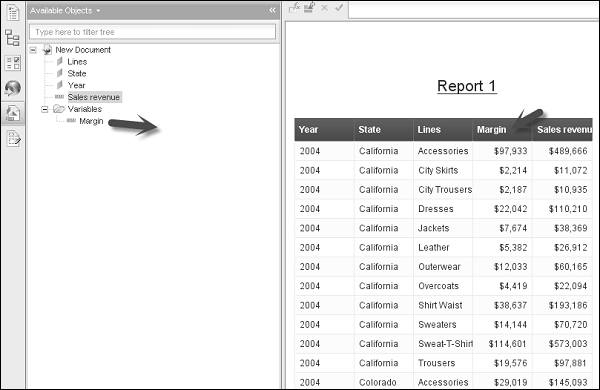
On the left side, you can see this new variable in the list of available objects. To use this variable, you can drag this to Webi report.
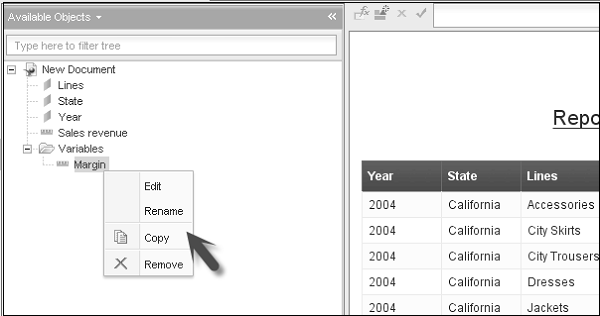
You can also edit or delete the variable. To edit/delete a variable, select the variable from the list of available objects → right-click → Edit/Remove.
SAP Webi - Drill Options in Reports
The drill option is used to analyze data at different levels. With drilling you can go to the next levels to analyze data in tables, charts, and sections.
You can also specify how drill options will make changes to reports when you perform drilling in Webi. Setting drill options depends on the Web Intelligence interface used.
- BI Launchpad
- Webi Rich Client
Setting Drill Option
Note that to use drill option, you should have hierarchy defined at Universe level. Once you have hierarchy at Universe, you can add that object to Result objects in Query panel. Once you run the query, the object will be added to the list of available objects in a Webi document.
Drill allows you to move to level up or level down as per the hierarchy in Universe.
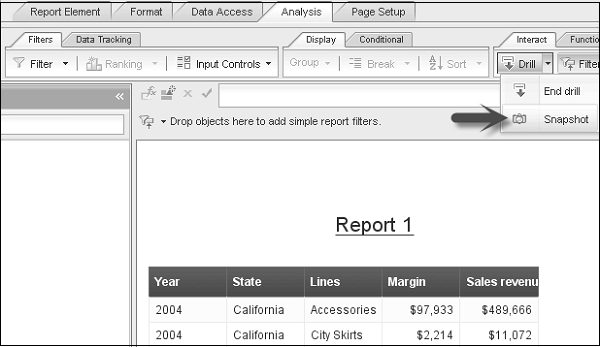
To set drill option in a Webi report, go to Analysis tab → Interact → Drill → Start Drill.
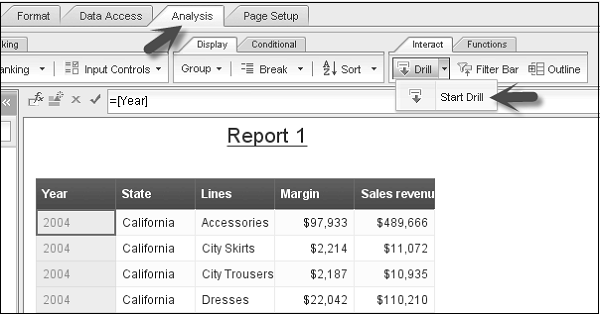
Once you start drill, you can move to the next levels or end drill using the option in the same tab.
Example − Drill on 2015 - the results displayed on the drilled table are Q1, Q2, Q3, and Q4 for the year 2015. This means that the quarterly values you drilled are filtered by 2015.
You can also take a snapshot of Drill result in a separate report. Use the snapshot option to add a new report with drilled data.
SAP Webi - Sharing Reports
You can publish a Webi content outside Webi documents by publishing report elements like charts and tables as web services. This is called BI services.
Publishing as Web Services
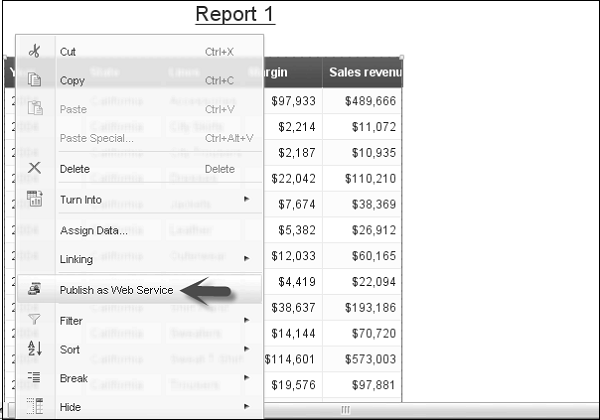
To publish a Webi document as web services, open the report in Design mode. You can use Publish Content Wizard to publish Webi document. The report should be saved in BI repository to publish as web services.
Select the Report Element you want to publish, right-click and click Publish as Web Service.
This will open the Publish Content Wizard → Click Next.
Publishing Prompts
For web services, you should reproduce prompts multiple times to produce different responses. Select the prompts you want to Publish and click Next.
If you dont select any prompts for publishing, web services uses prompt value that was supplied when the document was last refreshed.
Defining Web Services
Before publishing a block as a web service, you use the Define Published Content screen in the publish content wizard to name the table, make filters available on the block data, and select the server where the block will be published.
Save and Publish as Web Services
You use the Publish new content or Re-publish Existing Content as Web Service screen in the Publish Content wizard to save and publish the web service to a host server.
To re-publish an existing web service, select the web service, click Publish.
To publish a new web service, select the folder where you want to publish the content and click Create to display the Publish Web Service dialog box.
Enter the name of the web service in the web service box and add the description → Select Authentication method for the web service from the Authentication list.
Click Ok and it will save and publish the web service.
Choose the web service where you want to publish → Click Finish.
SAP Webi - Merge Dimension
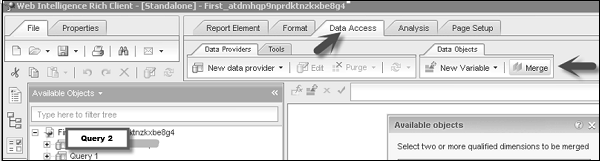
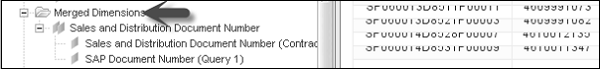
This option allows you to merge the data from different data sources. Assume that you have created Query 1 and Query 2 in Query Panel. When you combine both the queries in a single Webi report, objects from both the queries are shown in the list of available objects.
Select the unique object from both the queries and click Ok as shown in the following screenshot.
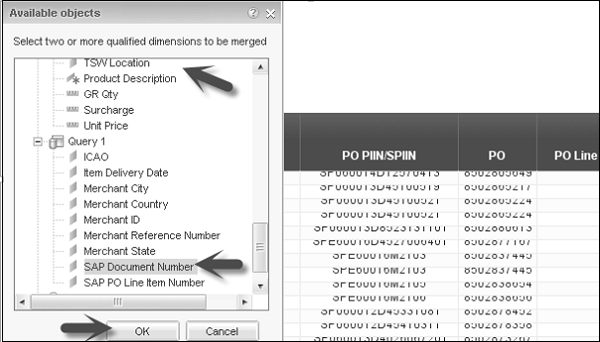
It will create a Merge Dimension under the list of available objects.
It allows you to synch both the queries and you can add the objects from both the queries in a single report. Sometimes it doesnt allow you to add objects in the report from either of the queries because of sync issues. In such a case, you can create a new variable for that object.
Enter the variable name, qualification as Detail and it will add a new field Associate Dimension. In Associate dimension, select the unique object from the same query.
In the Formula tab, select the object from the list of available objects for which you want to create a new variable and click Validate.
Once the variable is created for that object, you can drag that object to the report.
