- Bokeh - Home
- Bokeh - Introduction
- Bokeh - Environment Setup
- Bokeh - Getting Started
- Bokeh - Jupyter Notebook
- Bokeh - Basic Concepts
- Bokeh - Plots with Glyphs
- Bokeh - Area Plots
- Bokeh - Circle Glyphs
- Bokeh - Rectangle, Oval and Polygon
- Bokeh - Wedges and Arcs
- Bokeh - Specialized Curves
- Bokeh - Setting Ranges
- Bokeh - Axes
- Bokeh - Annotations and Legends
- Bokeh - Pandas
- Bokeh - ColumnDataSource
- Bokeh - Filtering Data
- Bokeh - Layouts
- Bokeh - Plot Tools
- Bokeh - Styling Visual Attributes
- Bokeh - Customising legends
- Bokeh - Adding Widgets
- Bokeh - Server
- Bokeh - Using Bokeh Subcommands
- Bokeh - Exporting Plots
- Bokeh - Embedding Plots and Apps
- Bokeh - Extending Bokeh
- Bokeh - WebGL
- Bokeh - Developing with JavaScript
Bokeh Resources
Bokeh - Specialized Curves
The bokeh.plotting API supports methods for rendering following specialised curves −
beizer()
This method adds a Bzier curve to the figure object. A Bzier curve is a parametric curve used in computer graphics. Other uses include the design of computer fonts and animation, user interface design and for smoothing cursor trajectory.
In vector graphics, Bzier curves are used to model smooth curves that can be scaled indefinitely. A "Path" is combination of linked Bzier curves.
The beizer() method has following parameters which are defined −
| 1 | x0 | The x-coordinates of the starting points. |
| 2 | y0 | The y-coordinates of the starting points.. |
| 3 | x1 | The x-coordinates of the ending points. |
| 4 | y1 | The y-coordinates of the ending points. |
| 5 | cx0 | The x-coordinates of first control points. |
| 6 | cy0 | The y-coordinates of first control points. |
| 7 | cx1 | The x-coordinates of second control points. |
| 8 | cy1 | The y-coordinates of second control points. |
Default value for all parameters is None.
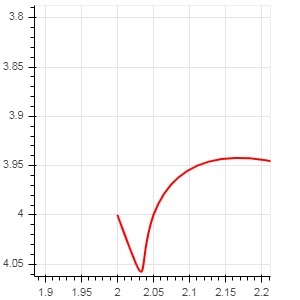
Example - Plotting of Bezier Curve (main.py)
Following code generates a HTML page showing a Bzier curve and parabola in Bokeh plot −
from bokeh.plotting import figure, output_file, show

x = 2
y = 4
xp02 = x+0.4
xp01 = x+0.1
xm01 = x-0.1
yp01 = y+0.2
ym01 = y-0.2
fig = figure(width = 300, height = 300)
fig.bezier(x0 = x, y0 = y, x1 = xp02, y1 = y, cx0 = xp01, cy0 = yp01,
cx1 = xm01, cy1 = ym01, line_color = "red", line_width = 2)

show(fig)
Output
Run the code and verify the output in the browser.
(myenv) D:\bokeh\myenv>py main.py
quadratic()
This method adds a parabola glyph to bokeh figure. The function has same parameters as beizer(), except cx0 and cx1.
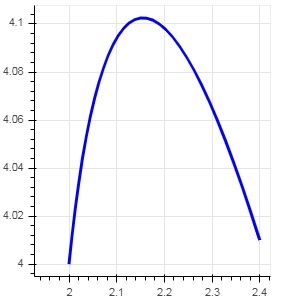
Example - Plotting of quadratic curve (main.py)
The code given below generates a quadratic curve.
from bokeh.plotting import figure, output_file, show

x = 2
y = 4
xp01 = x + 0.4
yp01 = y + 0.01
cx01 = x + 0.1
cy01 = y + 0.2

fig = figure(width = 300, height = 300)
fig.quadratic(x0 = x, y0 = y, x1 = xp01, y1 = yp01, cx = cx01,
cy = cy01, line_color = "blue", line_width = 3)

show(fig)
Output
Run the code and verify the output in the browser.
(myenv) D:\bokeh\myenv>py main.py