- Bokeh - Home
- Bokeh - Introduction
- Bokeh - Environment Setup
- Bokeh - Getting Started
- Bokeh - Jupyter Notebook
- Bokeh - Basic Concepts
- Bokeh - Plots with Glyphs
- Bokeh - Area Plots
- Bokeh - Circle Glyphs
- Bokeh - Rectangle, Oval and Polygon
- Bokeh - Wedges and Arcs
- Bokeh - Specialized Curves
- Bokeh - Setting Ranges
- Bokeh - Axes
- Bokeh - Annotations and Legends
- Bokeh - Pandas
- Bokeh - ColumnDataSource
- Bokeh - Filtering Data
- Bokeh - Layouts
- Bokeh - Plot Tools
- Bokeh - Styling Visual Attributes
- Bokeh - Customising legends
- Bokeh - Adding Widgets
- Bokeh - Server
- Bokeh - Using Bokeh Subcommands
- Bokeh - Exporting Plots
- Bokeh - Embedding Plots and Apps
- Bokeh - Extending Bokeh
- Bokeh - WebGL
- Bokeh - Developing with JavaScript
Bokeh Resources
Bokeh - Server
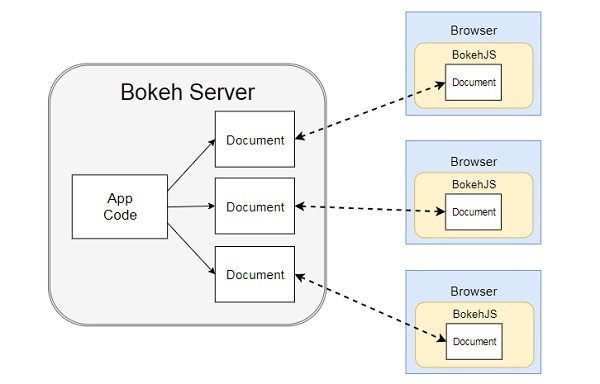
Bokeh architecture has a decouple design in which objects such as plots and glyphs are created using Python and converted in JSON to be consumed by BokehJS client library.
However, it is possible to keep the objects in python and in the browser in sync with one another with the help of Bokeh Server. It enables response to User Interface (UI) events generated in a browser with the full power of python. It also helps automatically push server-side updates to the widgets or plots in a browser.
A Bokeh server uses Application code written in Python to create Bokeh Documents. Every new connection from a client browser results in the Bokeh server creating a new document, just for that session.
Example - Creating a Server Application
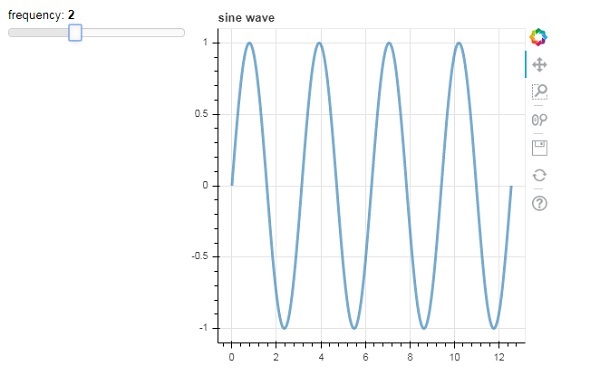
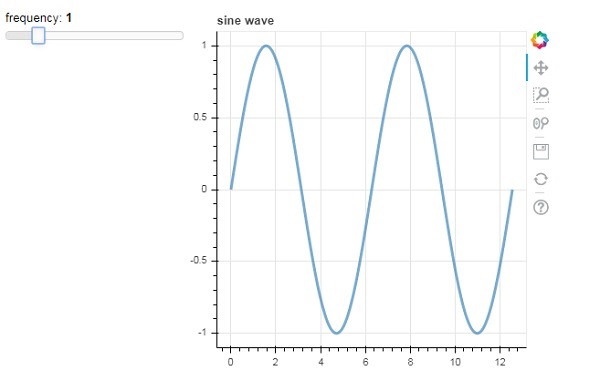
First, we have to develop an application code to be served to client browser. Following code renders a sine wave line glyph. Along with the plot, a slider control is also rendered to control the frequency of sine wave. The callback function update_data() updates ColumnDataSource data taking the instantaneous value of slider as current frequency.
main.py
import numpy as np

from bokeh.io import curdoc
from bokeh.layouts import row, column
from bokeh.models import ColumnDataSource
from bokeh.models.widgets import Slider, TextInput
from bokeh.plotting import figure

N = 200
x = np.linspace(0, 4*np.pi, N)
y = np.sin(x)
source = ColumnDataSource(data = dict(x = x, y = y))
plot = figure(height = 400, width = 400, title = "sine wave")
plot.line('x', 'y', source = source, line_width = 3, line_alpha = 0.6)
freq = Slider(title = "frequency", value = 1.0, start = 0.1, end = 5.1, step = 0.1)
def update_data(attrname, old, new):
   a = 1
   b = 0
   w = 0
   k = freq.value
   x = np.linspace(0, 4*np.pi, N)
   y = a*np.sin(k*x + w) + b
   source.data = dict(x = x, y = y)
freq.on_change('value', update_data)
curdoc().add_root(row(freq, plot, width = 500))
curdoc().title = "Sliders"
Output
Next, start Bokeh server by following command line −
bokeh serve --show main.py
Bokeh server starts running and serving the application at localhost:5006/sliders. The console log shows the following display −
(myenv) D:\bokeh\myenv>bokeh serve --show main.py
2025-12-18 19:50:34,896 Starting Bokeh server version 3.8.1 (running on Tornado 6.5.4)
2025-12-18 19:50:34,896 User authentication hooks NOT provided (default user enabled)
2025-12-18 19:50:34,906 Bokeh app running at: http://localhost:5006/main
2025-12-18 19:50:34,906 Starting Bokeh server with process id: 20600
2025-12-18 19:50:35,945 WebSocket connection opened
2025-12-18 19:50:35,945 ServerConnection created
2025-12-18 19:50:36,732 WebSocket connection opened
2025-12-18 19:50:36,775 ServerConnection created
BokehUserWarning: reference already known 'p1115'
2025-12-18 19:50:46,098 WebSocket connection closed: code=1001, reason=None
2025-12-18 19:50:47,897 WebSocket connection closed: code=1001, reason=None
Open your favourite browser and enter above address. The Sine wave plot is displayed as follows −
You can try and change the frequency to 2 by rolling the slider.