- Bokeh - Home
- Bokeh - Introduction
- Bokeh - Environment Setup
- Bokeh - Getting Started
- Bokeh - Jupyter Notebook
- Bokeh - Basic Concepts
- Bokeh - Plots with Glyphs
- Bokeh - Area Plots
- Bokeh - Circle Glyphs
- Bokeh - Rectangle, Oval and Polygon
- Bokeh - Wedges and Arcs
- Bokeh - Specialized Curves
- Bokeh - Setting Ranges
- Bokeh - Axes
- Bokeh - Annotations and Legends
- Bokeh - Pandas
- Bokeh - ColumnDataSource
- Bokeh - Filtering Data
- Bokeh - Layouts
- Bokeh - Plot Tools
- Bokeh - Styling Visual Attributes
- Bokeh - Customising legends
- Bokeh - Adding Widgets
- Bokeh - Server
- Bokeh - Using Bokeh Subcommands
- Bokeh - Exporting Plots
- Bokeh - Embedding Plots and Apps
- Bokeh - Extending Bokeh
- Bokeh - WebGL
- Bokeh - Developing with JavaScript
Bokeh Resources
Bokeh - Pandas
In all the examples earlier, the data to be plotted has been provided in the form of Python lists or numpy arrays. It is also possible to provide the data source in the form of pandas DataFrame object.
DataFrame is a two-dimensional data structure. Columns in the dataframe can be of different data types. The Pandas library has functions to create dataframe from various sources such as CSV file, Excel worksheet, SQL table, etc.
For the purpose of following example, we are using a CSV file consisting of two columns representing a number x and 10x. The test.csv file is as below −
test.csv
x,pow
0.0,1.0
0.5263157894736842,3.3598182862837818
1.0526315789473684,11.28837891684689
1.5789473684210527,37.926901907322495
2.1052631578947367,127.42749857031335
2.631578947368421,428.1332398719391
3.1578947368421053,1438.449888287663
3.6842105263157894,4832.930238571752
4.2105263157894735,16237.76739188721
4.7368421052631575,54555.947811685146
We shall read this file in a dataframe object using read_csv() function in pandas.
Example - Reading CSV using Pandas
main.py
import pandas as pd

df = pd.read_csv('test.csv')
print (df)
Output
Run the code and verify the output in the browser.
(myenv) D:\bokeh\myenv>py main.py
The dataframe appears as below −
          x           pow
0  0.000000      1.000000
1  0.526316      3.359818
2  1.052632     11.288379
3  1.578947     37.926902
4  2.105263    127.427499
5  2.631579    428.133240
6  3.157895   1438.449888
7  3.684211   4832.930239
8  4.210526  16237.767392
9  4.736842  54555.947812
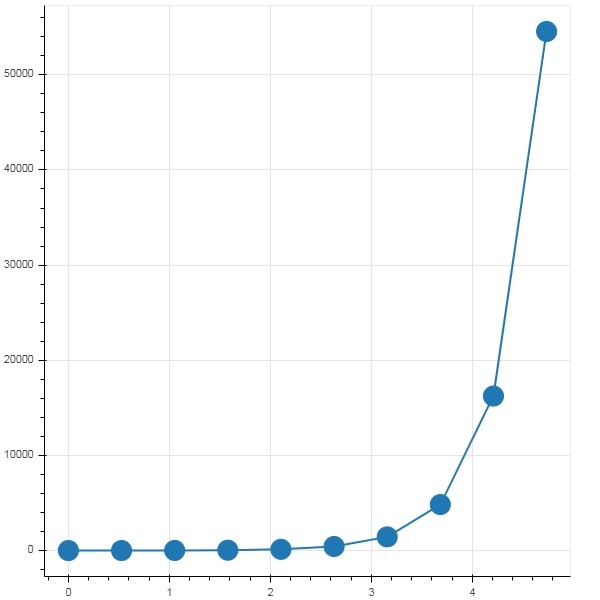
Example - Plotting Panda Data Series
The x and pow columns are used as data series for line glyph in bokeh plot figure.
main.py
import pandas as pd
from bokeh.plotting import figure, output_file, show

df = pd.read_csv('test.csv')

p = figure()
x = df['x']
y = df['pow']
p.line(x,y,line_width = 2)
p.circle(x, y,size = 20)
show(p)
Output
Run the code and verify the output in the browser.
(myenv) D:\bokeh\myenv>py main.py