- Bokeh - Home
- Bokeh - Introduction
- Bokeh - Environment Setup
- Bokeh - Getting Started
- Bokeh - Jupyter Notebook
- Bokeh - Basic Concepts
- Bokeh - Plots with Glyphs
- Bokeh - Area Plots
- Bokeh - Circle Glyphs
- Bokeh - Rectangle, Oval and Polygon
- Bokeh - Wedges and Arcs
- Bokeh - Specialized Curves
- Bokeh - Setting Ranges
- Bokeh - Axes
- Bokeh - Annotations and Legends
- Bokeh - Pandas
- Bokeh - ColumnDataSource
- Bokeh - Filtering Data
- Bokeh - Layouts
- Bokeh - Plot Tools
- Bokeh - Styling Visual Attributes
- Bokeh - Customising legends
- Bokeh - Adding Widgets
- Bokeh - Server
- Bokeh - Using Bokeh Subcommands
- Bokeh - Exporting Plots
- Bokeh - Embedding Plots and Apps
- Bokeh - Extending Bokeh
- Bokeh - WebGL
- Bokeh - Developing with JavaScript
Bokeh Resources
Bokeh - ColumnDataSource
Most of the plotting methods in Bokeh API are able to receive data source parameters through ColumnDatasource object. It makes sharing data between plots and DataTables.
A ColumnDatasource can be considered as a mapping between column name and list of data. A Python dict object with one or more string keys and lists or numpy arrays as values is passed to ColumnDataSource constructor.
Example - Creating a ColumnDataSource
Syntax
from bokeh.models import ColumnDataSource

data = {'x':[1, 4, 3, 2, 5],
   'y':[6, 5, 2, 4, 7]}
cds = ColumnDataSource(data = data)
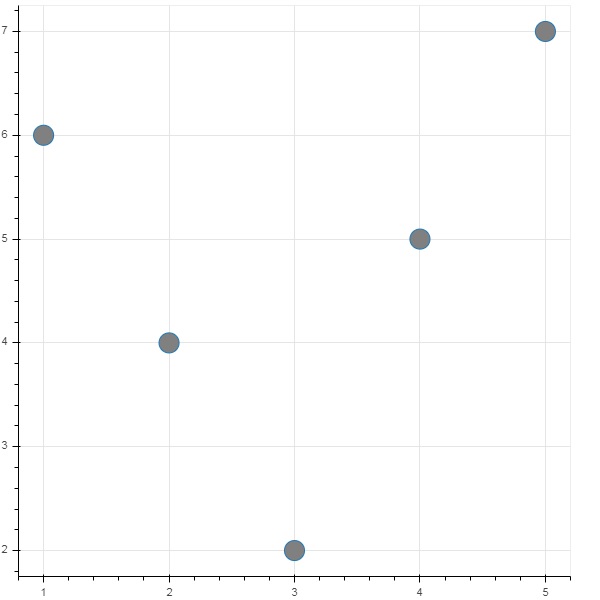
This object is then used as value of source property in a glyph method. Following code generates a scatter plot using ColumnDataSource.
main.py
from bokeh.plotting import figure, output_file, show
from bokeh.models import ColumnDataSource

data = {'x':[1, 4, 3, 2, 5],
   'y':[6, 5, 2, 4, 7]}

cds = ColumnDataSource(data = data)

fig = figure()
fig.scatter(x = 'x', y = 'y',source = cds, marker = "circle", size = 20, fill_color = "grey")

show(fig)
Output
Run the code and verify the output in the browser.
(myenv) D:\bokeh\myenv>py main.py
Using Panda DataFrame to create a ColumnDataSource
Instead of assigning a Python dictionary to ColumnDataSource, we can use a Pandas DataFrame for it.
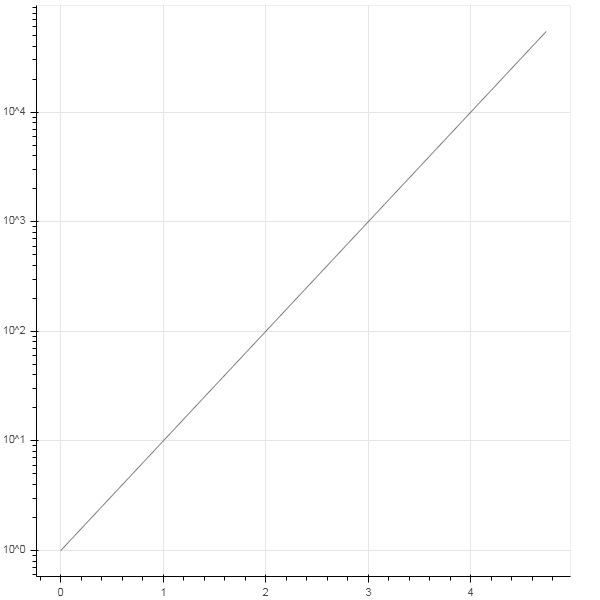
Let us use test.csv (used earlier in this section) to obtain a DataFrame and use it for getting ColumnDataSource and rendering line plot.
main.csv
from bokeh.plotting import figure, output_file, show
import pandas as pd
from bokeh.models import ColumnDataSource

df = pd.read_csv('test.csv')
cds = ColumnDataSource(df)
fig = figure(y_axis_type = 'log')
fig.line(x = 'x', y = 'pow',source = cds, line_color = "grey")

show(fig)
Output
Run the code and verify the output in the browser.
(myenv) D:\bokeh\myenv>py main.py