- Bokeh - Home
- Bokeh - Introduction
- Bokeh - Environment Setup
- Bokeh - Getting Started
- Bokeh - Jupyter Notebook
- Bokeh - Basic Concepts
- Bokeh - Plots with Glyphs
- Bokeh - Area Plots
- Bokeh - Circle Glyphs
- Bokeh - Rectangle, Oval and Polygon
- Bokeh - Wedges and Arcs
- Bokeh - Specialized Curves
- Bokeh - Setting Ranges
- Bokeh - Axes
- Bokeh - Annotations and Legends
- Bokeh - Pandas
- Bokeh - ColumnDataSource
- Bokeh - Filtering Data
- Bokeh - Layouts
- Bokeh - Plot Tools
- Bokeh - Styling Visual Attributes
- Bokeh - Customising legends
- Bokeh - Adding Widgets
- Bokeh - Server
- Bokeh - Using Bokeh Subcommands
- Bokeh - Exporting Plots
- Bokeh - Embedding Plots and Apps
- Bokeh - Extending Bokeh
- Bokeh - WebGL
- Bokeh - Developing with JavaScript
Bokeh Resources
Selected Reading
Bokeh - Setting Ranges
Numeric ranges of data axes of a plot are automatically set by Bokeh taking into consideration the dataset under process. However, sometimes you may want to define the range of values on x and y axis explicitly. This is done by assigning x_range and y_range properties to a figure() function.
These ranges are defined with the help of range1d() function.
Example
xrange = Range1d(0,10)
To use this range object as x_range property, use the below code −
fig = figure(x,y,x_range = xrange)
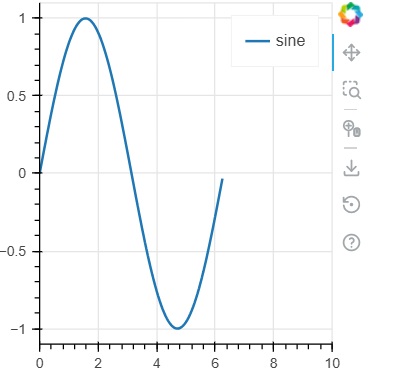
Example - Usage of Range1d
main.py
from bokeh.plotting import figure, output_file, show
import numpy as np
import math
from bokeh.models import Range1d

x = np.arange(0, math.pi*2, 0.05)
y = np.sin(x)

output_file("sine.html")

xrange = Range1d(0,10)
fig = figure(width = 300, height = 300, x_range = xrange)
fig.line(x, y, legend_label = "sine", line_width = 2)

show(fig)
Output
Run the code and verify the output
(myenv) D:\bokeh\myenv>py main.py

Advertisements