- Bokeh - Home
- Bokeh - Introduction
- Bokeh - Environment Setup
- Bokeh - Getting Started
- Bokeh - Jupyter Notebook
- Bokeh - Basic Concepts
- Bokeh - Plots with Glyphs
- Bokeh - Area Plots
- Bokeh - Circle Glyphs
- Bokeh - Rectangle, Oval and Polygon
- Bokeh - Wedges and Arcs
- Bokeh - Specialized Curves
- Bokeh - Setting Ranges
- Bokeh - Axes
- Bokeh - Annotations and Legends
- Bokeh - Pandas
- Bokeh - ColumnDataSource
- Bokeh - Filtering Data
- Bokeh - Layouts
- Bokeh - Plot Tools
- Bokeh - Styling Visual Attributes
- Bokeh - Customising legends
- Bokeh - Adding Widgets
- Bokeh - Server
- Bokeh - Using Bokeh Subcommands
- Bokeh - Exporting Plots
- Bokeh - Embedding Plots and Apps
- Bokeh - Extending Bokeh
- Bokeh - WebGL
- Bokeh - Developing with JavaScript
Bokeh Resources
Selected Reading
Bokeh - Developing with JavaScript
When one has to use large datasets for creating visualizations with the help of Bokeh, the interaction can be very slow. For that purpose, one can enable Web Graphics Library (WebGL) support.
WebGL is a JavaScript API that renders content in the browser using GPU (graphics processing unit). This standardized plugin is available in all modern browsers.
To enable WebGL, all you have to do is set output_backend property of Bokeh Figure object to webgl.
fig = figure(output_backend="webgl")
Example - Using WebGL
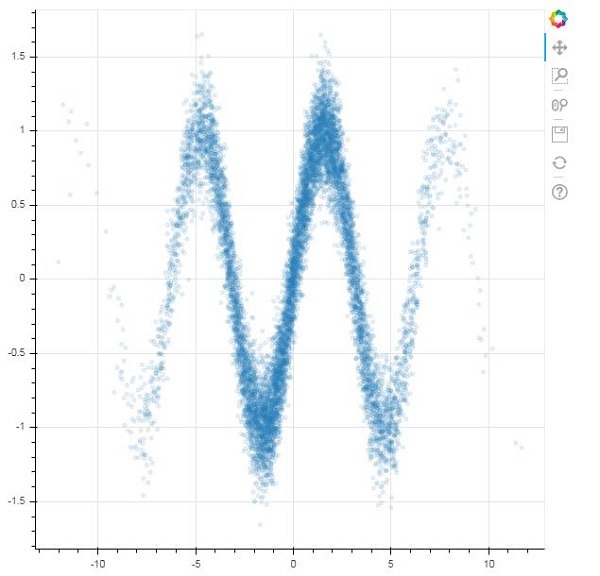
In the following example, we plot a scatter glyph consisting of 10,000 points with the help of WebGL support.
main.py
import numpy as np
from bokeh.plotting import figure, show, output_file

N = 10000
x = np.random.normal(0, np.pi, N)
y = np.sin(x) + np.random.normal(0, 0.2, N)
output_file("scatterWebGL.html")
p = figure(output_backend="webgl")
p.scatter(x, y, alpha=0.1)

show(p)
Output
Run the code and verify the output in the browser.
(myenv) D:\bokeh\myenv>py main.py

Advertisements