- Bokeh - Home
- Bokeh - Introduction
- Bokeh - Environment Setup
- Bokeh - Getting Started
- Bokeh - Jupyter Notebook
- Bokeh - Basic Concepts
- Bokeh - Plots with Glyphs
- Bokeh - Area Plots
- Bokeh - Circle Glyphs
- Bokeh - Rectangle, Oval and Polygon
- Bokeh - Wedges and Arcs
- Bokeh - Specialized Curves
- Bokeh - Setting Ranges
- Bokeh - Axes
- Bokeh - Annotations and Legends
- Bokeh - Pandas
- Bokeh - ColumnDataSource
- Bokeh - Filtering Data
- Bokeh - Layouts
- Bokeh - Plot Tools
- Bokeh - Styling Visual Attributes
- Bokeh - Customising legends
- Bokeh - Adding Widgets
- Bokeh - Server
- Bokeh - Using Bokeh Subcommands
- Bokeh - Exporting Plots
- Bokeh - Embedding Plots and Apps
- Bokeh - Extending Bokeh
- Bokeh - WebGL
- Bokeh - Developing with JavaScript
Bokeh Resources
Bokeh - Adding Widgets
The bokeh.models.widgets module contains definitions of GUI objects similar to HTML form elements, such as button, slider, checkbox, radio button, etc. These controls provide interactive interface to a plot. Invoking processing such as modifying plot data, changing plot parameters, etc., can be performed by custom JavaScript functions executed on corresponding events.
Bokeh allows call back functionality to be defined with two methods −
Use the CustomJS callback so that the interactivity will work in standalone HTML documents.
Use Bokeh server and set up event handlers.
In this section, we shall see how to add Bokeh widgets and assign JavaScript callbacks.
Button
This widget is a clickable button generally used to invoke a user defined call back handler. The constructor takes following parameters −
Button(label, icon, callback)
The label parameter is a string used as buttons caption and callback is the custom JavaScript function to be called when clicked.
In the following example, a plot and Button widget are displayed in Column layout. The plot itself renders a line glyph between x and y data series.
A custom JavaScript function named callback has been defined using CutomJS() function. It receives reference to the object that triggered callback (in this case the button) in the form variable cb_obj.
This function alters the source ColumnDataSource data and finally emits this update in source data.
main.py
from bokeh.layouts import column
from bokeh.models import CustomJS, ColumnDataSource
from bokeh.plotting import figure, output_file, show
from bokeh.models.widgets import Button
from bokeh import events

x = [x*0.05 for x in range(0, 200)]
y = x

source = ColumnDataSource(data=dict(x=x, y=y))
plot = figure(width=400, height=400)
plot.line('x', 'y', source=source, line_width=3, line_alpha=0.6)

def display_event(source):
   return CustomJS(args=dict(source=source), code="""
   var data = source.data;
   var x = data['x']
   var y = data['y']
   for (var i = 0; i < x.length; i++) {
      y[i] = Math.pow(x[i], 4)
   }
   source.change.emit()
""")

btn = Button(label="click here", name="1")

btn.js_on_event(events.ButtonClick, display_event(source))

layout = column(btn , plot)
show(layout)
Output
Run the code and verify the output in the browser.
(myenv) D:\bokeh\myenv>py main.py
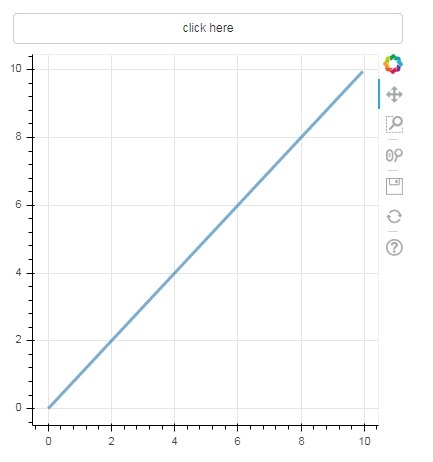
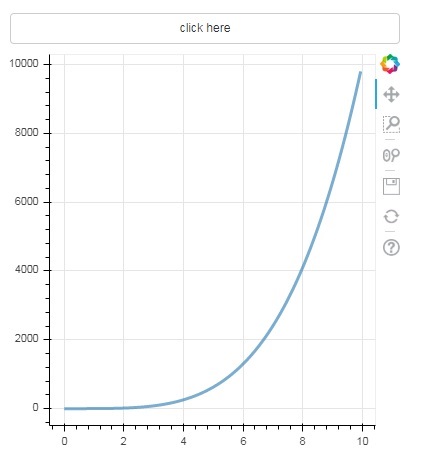
Click on the button on top of the plot and see the updated plot figure which looks as follows −
Output (after click)
Slider
With the help of a slider control it is possible to select a number between start and end properties assigned to it.
Slider(start, end, step, value)
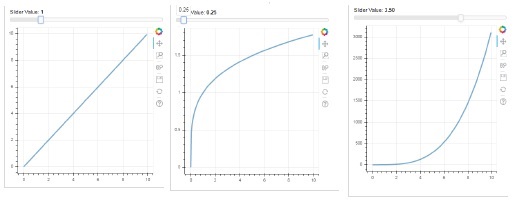
In the following example, we register a callback function on sliders on_change event. Sliders instantaneous numeric value is available to the handler in the form of cb_obj.value which is used to modify the ColumnDatasource data. The plot figure continuously updates as you slide the position.
main.py
from bokeh.layouts import column
from bokeh.models import CustomJS, ColumnDataSource
from bokeh.plotting import Figure, output_file, show
from bokeh.models.widgets import Slider

x = [x*0.05 for x in range(0, 200)]
y = x

source = ColumnDataSource(data=dict(x=x, y=y))
plot = Figure(width=400, height=400)
plot.line('x', 'y', source=source, line_width=3, line_alpha=0.6)

handler = CustomJS(args=dict(source=source), code="""
   var data = source.data;
   var f = cb_obj.value
   var x = data['x']
   var y = data['y']
   for (var i = 0; i < x.length; i++) {
      y[i] = Math.pow(x[i], f)
   }
   source.change.emit();
""")

slider = Slider(start=0.0, end=5, value=1, step=.25, title="Slider Value")

slider.js_on_change('value', handler)
layout = column(slider, plot)
show(layout)
Output
Run the code and verify the output in the browser.
(myenv) D:\bokeh\myenv>py main.py
RadioGroup
This widget presents a collection of mutually exclusive toggle buttons showing circular buttons to the left of caption.
RadioGroup(labels, active)
Where, labels is a list of captions and active is the index of selected option.
Select
This widget is a simple dropdown list of string items, one of which can be selected. Selected string appears at the top window and it is the value parameter.
Select(options, value)
The list of string elements in the dropdown is given in the form of options list object.
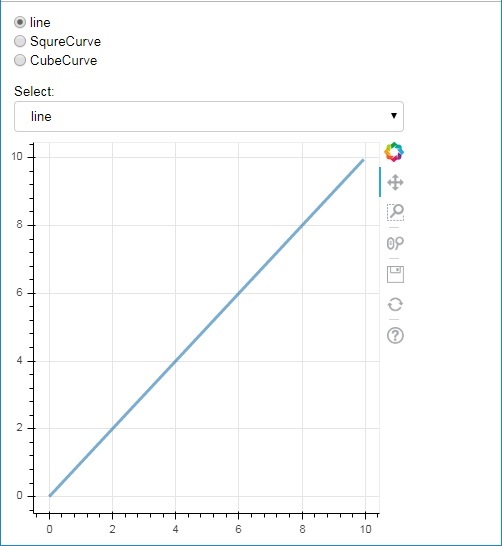
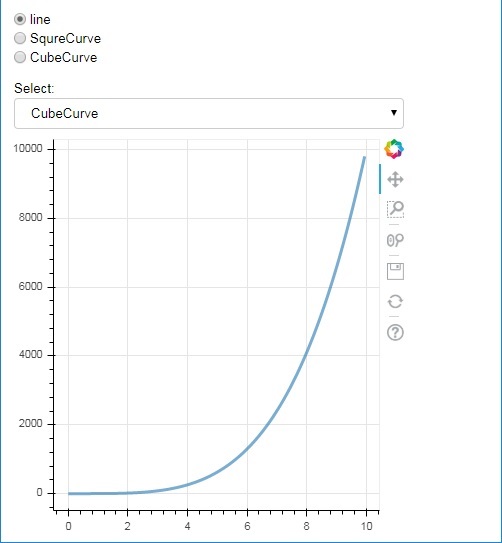
Following is a combined example of radio button and select widgets, both providing three different relationships between x and y data series. The RadioGroup and Select widgets are registered with respective handlers through on_change() method.
main.py
from bokeh.layouts import column
from bokeh.models import CustomJS, ColumnDataSource
from bokeh.plotting import figure, output_file, show
from bokeh.models.widgets import RadioGroup, Select

x = [x*0.05 for x in range(0, 200)]
y = x

source = ColumnDataSource(data=dict(x=x, y=y))

plot = figure(width=400, height=400)
plot.line('x', 'y', source=source, line_width=3, line_alpha=0.6)

radiohandler = CustomJS(args=dict(source=source), code="""
   var data = source.data;
   console.log('Tap event occurred at x-position: ' + cb_obj.active);
   //plot.title.text=cb_obj.value;
   var x = data['x']
   var y = data['y']
   if (cb_obj.active==0){
      for (var i = 0; i < x.length; i++) {
         y[i] = x[i];
      }
   }
   if (cb_obj.active==1){
      for (var i = 0; i < x.length; i++) {
         y[i] = Math.pow(x[i], 2)
      }
   }
   if (cb_obj.active==2){
      for (var i = 0; i < x.length; i++) {
         y[i] = Math.pow(x[i], 4)
      }
   }
   source.change.emit();
""")

selecthandler = CustomJS(args=dict(source=source), code="""
   var data = source.data;
   console.log('Tap event occurred at x-position: ' + cb_obj.value);
   //plot.title.text=cb_obj.value;
   var x = data['x']
   var y = data['y']
   if (cb_obj.value=="line"){
      for (var i = 0; i < x.length; i++) {
         y[i] = x[i];
      }
   }
   if (cb_obj.value=="SquareCurve"){
      for (var i = 0; i < x.length; i++) {
         y[i] = Math.pow(x[i], 2)
      }
   }
   if (cb_obj.value=="CubeCurve"){
      for (var i = 0; i < x.length; i++) {
         y[i] = Math.pow(x[i], 4)
      }
   }
   source.change.emit();
""")

radio = RadioGroup(labels=["line", "SqureCurve", "CubeCurve"], active=0)
radio.js_on_change('active', radiohandler)
select = Select(title="Select:", value='line', options=["line", "SquareCurve", "CubeCurve"])
select.js_on_change('value', selecthandler)

layout = column(radio, select, plot)
show(layout)
Output
Run the code and verify the output in the browser.
(myenv) D:\bokeh\myenv>py main.py
Tab widget
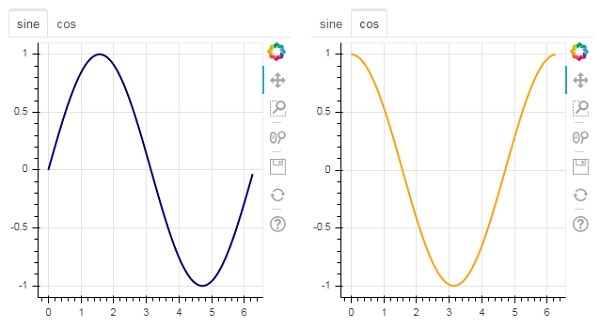
Just as in a browser, each tab can show different web page, the Tab widget is Bokeh model providing different view to each figure. In the following example, two plot figures of sine and cosine curves are rendered in two different tabs −
main.py
from bokeh.plotting import figure, output_file, show
from bokeh.models import TabPanel, Tabs
import numpy as np
import math

x=np.arange(0, math.pi*2, 0.05)
fig1=figure(width=300, height=300)

fig1.line(x, np.sin(x),line_width=2, line_color='navy')

tab1 = TabPanel(child=fig1, title="sine")
fig2=figure(width=300, height=300)
fig2.line(x,np.cos(x), line_width=2, line_color='orange')
tab2 = TabPanel(child=fig2, title="cos")

tabs = Tabs(tabs=[ tab1, tab2 ])

show(tabs)
Output
Run the code and verify the output in the browser.
(myenv) D:\bokeh\myenv>py main.py