- Bokeh - Home
- Bokeh - Introduction
- Bokeh - Environment Setup
- Bokeh - Getting Started
- Bokeh - Jupyter Notebook
- Bokeh - Basic Concepts
- Bokeh - Plots with Glyphs
- Bokeh - Area Plots
- Bokeh - Circle Glyphs
- Bokeh - Rectangle, Oval and Polygon
- Bokeh - Wedges and Arcs
- Bokeh - Specialized Curves
- Bokeh - Setting Ranges
- Bokeh - Axes
- Bokeh - Annotations and Legends
- Bokeh - Pandas
- Bokeh - ColumnDataSource
- Bokeh - Filtering Data
- Bokeh - Layouts
- Bokeh - Plot Tools
- Bokeh - Styling Visual Attributes
- Bokeh - Customising legends
- Bokeh - Adding Widgets
- Bokeh - Server
- Bokeh - Using Bokeh Subcommands
- Bokeh - Exporting Plots
- Bokeh - Embedding Plots and Apps
- Bokeh - Extending Bokeh
- Bokeh - WebGL
- Bokeh - Developing with JavaScript
Bokeh Resources
Selected Reading
Bokeh - Customising legends
Various glyphs in a plot can be identified by legend property appear as a label by default at top-right position of the plot area. This legend can be customised by following attributes −
| 1 | legend.label_text_font | change default label font to specified font name | |
| 2 | legend.label_text_font_size | font size in points | |
| 3 | legend.location | set the label at specified location. | |
| 4 | legend.title | set title for legend label | |
| 5 | legend.orientation | set to horizontal (default) or vertical | |
| 6 | legend.clicking_policy | specify what should happen when legend is clicked hide: hides the glyph corresponding to legend mute: mutes the glyph corresponding to legendtd> |
Example - Customizing Legend
Example code for legend customisation is as follows −
main.py
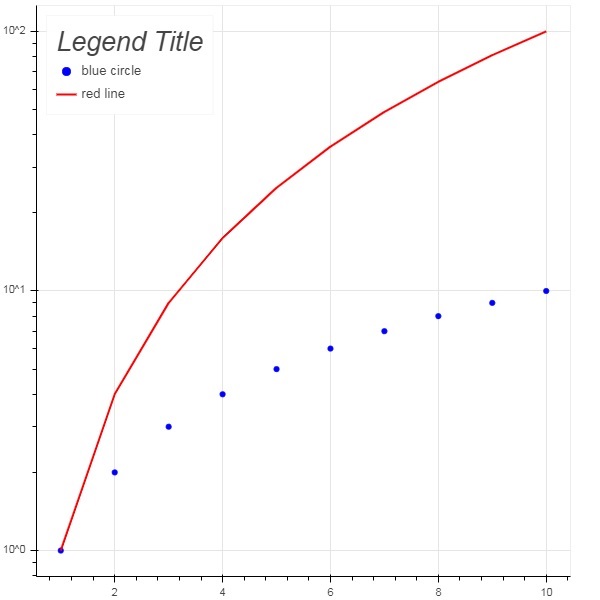
from bokeh.plotting import figure, output_file, show
import math

x2 = list(range(1,11))
y4 = [math.pow(i,2) for i in x2]
y2 = [math.log10(pow(10,i)) for i in x2]
fig = figure(y_axis_type = 'log')
fig.scatter(x2, y2,size = 5, color = 'blue', legend_label = 'blue circle')
fig.line(x2,y4, line_width = 2, line_color = 'red', legend_label = 'red line')
fig.legend.location = 'top_left'
fig.legend.title = 'Legend Title'
fig.legend.title_text_font = 'Arial'
fig.legend.title_text_font_size = '20pt'
show(fig)
Output
Run the code and verify the output in the browser.
(myenv) D:\bokeh\myenv>py main.py

Advertisements