- Bokeh - Home
- Bokeh - Introduction
- Bokeh - Environment Setup
- Bokeh - Getting Started
- Bokeh - Jupyter Notebook
- Bokeh - Basic Concepts
- Bokeh - Plots with Glyphs
- Bokeh - Area Plots
- Bokeh - Circle Glyphs
- Bokeh - Rectangle, Oval and Polygon
- Bokeh - Wedges and Arcs
- Bokeh - Specialized Curves
- Bokeh - Setting Ranges
- Bokeh - Axes
- Bokeh - Annotations and Legends
- Bokeh - Pandas
- Bokeh - ColumnDataSource
- Bokeh - Filtering Data
- Bokeh - Layouts
- Bokeh - Plot Tools
- Bokeh - Styling Visual Attributes
- Bokeh - Customising legends
- Bokeh - Adding Widgets
- Bokeh - Server
- Bokeh - Using Bokeh Subcommands
- Bokeh - Exporting Plots
- Bokeh - Embedding Plots and Apps
- Bokeh - Extending Bokeh
- Bokeh - WebGL
- Bokeh - Developing with JavaScript
Bokeh Resources
Selected Reading
Bokeh - Rectangle, Ellipse and Polygon
It is possible to render rectangle, ellipse and polygons in a Bokeh figure. The rect() method of Figure class adds a rectangle glyph based on x and y coordinates of center, width and height. The scatter(marker="square") method on the other hand has size parameter to decide dimensions.
The ellipse() method adds an ellipse glyph. They use similar signature to that of rect() having x, y,w and h parameters. Additionally, angle parameter determines rotation from horizontal.
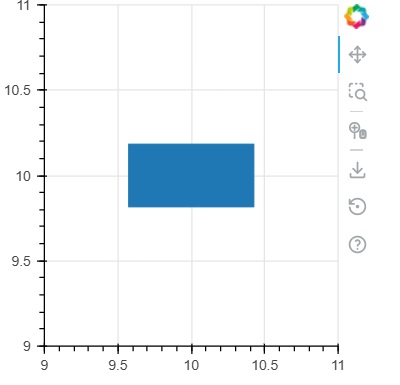
Example - Usage of rect glyph
main.py
from bokeh.plotting import figure, output_file, show

fig = figure(width = 300, height = 300)
fig.rect(x = 10,y = 10,width = 100, height = 50, width_units = 'screen', height_units = 'screen')

show(fig)
Output
Run the code and verify the output in the browser.
(myenv) D:\bokeh\myenv>py main.py
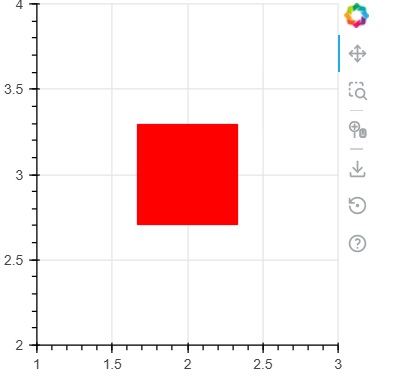
Example - Usage of square glyph
main.py
from bokeh.plotting import figure, output_file, show

fig = figure(width = 300, height = 300)
fig.scatter(marker='square',x = 2,y = 3,size = 80, color = 'red')

show(fig)
Output
Run the code and verify the output in the browser.
(myenv) D:\bokeh\myenv>py main.py
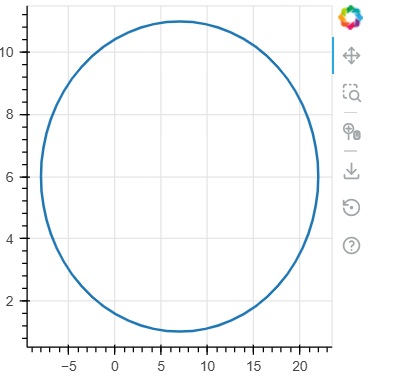
Example - Usage of ellipse glyph
main.py
from bokeh.plotting import figure, output_file, show

fig = figure(width = 300, height = 300)
fig.ellipse(x = 7,y = 6, width = 30, height = 10, fill_color = None, line_width = 2)

show(fig)
Output
Run the code and verify the output in the browser.
(myenv) D:\bokeh\myenv>py main.py

Advertisements