- Bokeh - Home
- Bokeh - Introduction
- Bokeh - Environment Setup
- Bokeh - Getting Started
- Bokeh - Jupyter Notebook
- Bokeh - Basic Concepts
- Bokeh - Plots with Glyphs
- Bokeh - Area Plots
- Bokeh - Circle Glyphs
- Bokeh - Rectangle, Oval and Polygon
- Bokeh - Wedges and Arcs
- Bokeh - Specialized Curves
- Bokeh - Setting Ranges
- Bokeh - Axes
- Bokeh - Annotations and Legends
- Bokeh - Pandas
- Bokeh - ColumnDataSource
- Bokeh - Filtering Data
- Bokeh - Layouts
- Bokeh - Plot Tools
- Bokeh - Styling Visual Attributes
- Bokeh - Customising legends
- Bokeh - Adding Widgets
- Bokeh - Server
- Bokeh - Using Bokeh Subcommands
- Bokeh - Exporting Plots
- Bokeh - Embedding Plots and Apps
- Bokeh - Extending Bokeh
- Bokeh - WebGL
- Bokeh - Developing with JavaScript
Bokeh Resources
Bokeh - Circle Glyphs
The figure object has many methods using which vectorised glyphs of different shapes such as circle, rectangle, polygon, etc. can, be drawn.
Following methods are available for drawing circle glyphs −
scatter()
The scatter() method adds a circle glyph to the figure and needs x and y coordinates of its center. Additionally, it can be configured with the help of parameters such as fill_color, line-color, line_width etc.
scatter(marker='circle_cross')
The scatter() method with marker as 'circle_cross' adds circle glyph with a + cross through the center.
scatter(marker='circle_x')
The scatter() method with marker as 'circle_x' adds circle with an X cross through the center.
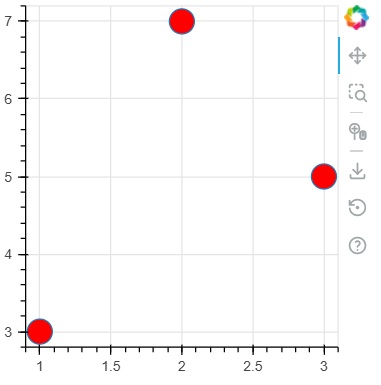
Example - Usage of circle glyph
main.py
from bokeh.plotting import figure, output_file, show

plot = figure(width = 300, height = 300)

plot.scatter(x = [1, 2, 3], y = [3,7,5], size = 20, fill_color = 'red')

show(plot)
Output
Run the code and verify the output in the browser.
(myenv) D:\bokeh\myenv>py main.py
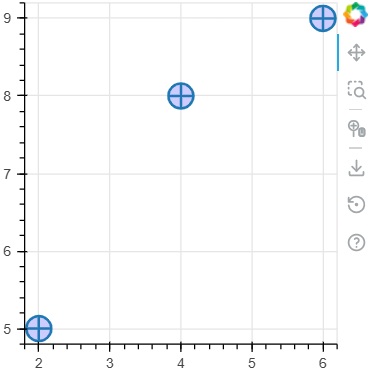
Example - Usage of circle_cross glyph
main.py
from bokeh.plotting import figure, output_file, show

plot = figure(width = 300, height = 300)
plot.scatter(marker='circle_cross', x = [2,4,6], y = [5,8,9], size = 20, fill_color = 'blue',fill_alpha = 0.2, line_width = 2)

show(plot)
Output
Run the code and verify the output in the browser.
(myenv) D:\bokeh\myenv>py main.py
Example - Usage of circle_x glyph
main.py
from bokeh.plotting import figure, output_file, show

plot = figure(width = 300, height = 300)
plot.scatter(marker='circle_x', x = [5,7,2], y = [2,4,9], size = 20, fill_color = 'green',fill_alpha = 0.6, line_width = 2)

show(plot)
Output
Run the code and verify the output in the browser.
(myenv) D:\bokeh\myenv>py main.py

