- Bokeh - Home
- Bokeh - Introduction
- Bokeh - Environment Setup
- Bokeh - Getting Started
- Bokeh - Jupyter Notebook
- Bokeh - Basic Concepts
- Bokeh - Plots with Glyphs
- Bokeh - Area Plots
- Bokeh - Circle Glyphs
- Bokeh - Rectangle, Oval and Polygon
- Bokeh - Wedges and Arcs
- Bokeh - Specialized Curves
- Bokeh - Setting Ranges
- Bokeh - Axes
- Bokeh - Annotations and Legends
- Bokeh - Pandas
- Bokeh - ColumnDataSource
- Bokeh - Filtering Data
- Bokeh - Layouts
- Bokeh - Plot Tools
- Bokeh - Styling Visual Attributes
- Bokeh - Customising legends
- Bokeh - Adding Widgets
- Bokeh - Server
- Bokeh - Using Bokeh Subcommands
- Bokeh - Exporting Plots
- Bokeh - Embedding Plots and Apps
- Bokeh - Extending Bokeh
- Bokeh - WebGL
- Bokeh - Developing with JavaScript
Bokeh Resources
Bokeh - Getting Started
Creating a simple line plot between two numpy arrays is very simple. To begin with, import following functions from bokeh.plotting modules −
from bokeh.plotting import figure, output_file, show
The figure() function creates a new figure for plotting.
The output_file() function is used to specify a HTML file to store output.
The show() function displays the Bokeh figure in browser or in notebook.
Next, set up two numpy arrays where second array is sine value of first.
import numpy as np
import math
x = np.arange(0, math.pi*2, 0.05)
y = np.sin(x)
To obtain a Bokeh Figure object, specify the title and x and y axis labels as below −
p = figure(title = "sine wave example", x_axis_label = 'x', y_axis_label = 'y')
The Figure object contains a line() method that adds a line glyph to the figure. It needs data series for x and y axes.
p.line(x, y, legend_label = "sine", line_width = 2)
Finally, set the output file and call show() function.
output_file("sine.html")
show(p)
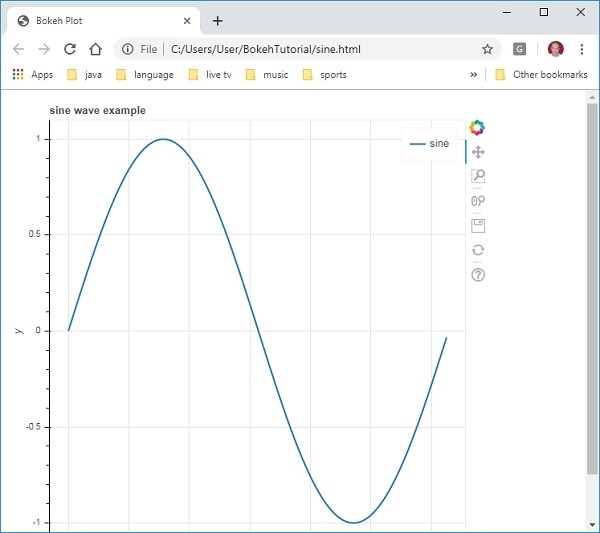
This will render the line plot in sine.html and will be displayed in browser.
Example - Usage of Bokeh to render a Line
main.py
from bokeh.plotting import figure, output_file, show
import numpy as np
import math

x = np.arange(0, math.pi*2, 0.05)
y = np.sin(x)

output_file("sine.html")

p = figure(title = "sine wave example", x_axis_label = 'x', y_axis_label = 'y')
p.line(x, y, legend_label = "sine", line_width = 2)

show(p)
Output
Run the code and verify the output
(myenv) D:\bokeh\myenv>py main.py