- Splunk - Home
- Splunk - Overview
- Splunk - Environment
- Splunk - Interfaces
- Splunk - Data Ingestion
- Splunk - Source Types
- Splunk - Basic Searching
- Splunk - Field Searching
- Splunk - Time Range Search
- Splunk - Sharing and Exporting
- Splunk - Search Language
- Splunk - Search Optimization
- Splunk - Transforming commands
- Splunk - Reports
- Splunk - Dashboards
- Splunk - Pivot & Datasets
- Splunk - Lookups
- Splunk - Schedules and Alerts
- Splunk - Knowledge Management
- Splunk - Subseraching
- Splunk - Search Macros
- Splunk - Event Types
- Splunk - Basic Chart
- Splunk - Overlay chart
- Splunk - Sparklines
- Splunk - Managing Indexes
- Splunk - Calculated Fields
- Splunk - Tags
- Splunk - Apps
- Splunk - Removing Data
- Splunk - Custom Chart
- Splunk - Monitoring Files
- Splunk - Sort Command
- Splunk - Top Command
- Splunk - Stats Command
- Splunk Useful Resources
- Splunk - Quick Guide
- Splunk - Useful Resources
- Splunk - Discussion
Splunk - Transforming Commands
These are the commands in Splunk which are used to transform the result of a search into such data structures which will be useful in representing the statistics and data visualizations.
Examples of Transforming Commands
Following are some of the examples of transforming commands −
Highlight − To highlight the specific terms in a result.
Chart − To create a chart out of the search result.
Stats − To create statistical summaries from the search result.
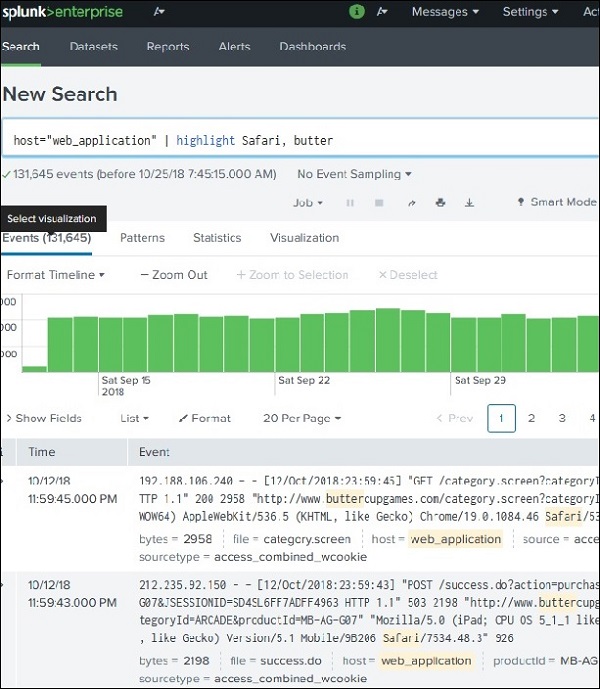
Highlight
This command is used to highlight specific terms in the search result set. It is used by supplying the search terms as arguments to the highlight function. Multiple search terms are supplied by separating them with comma.
In the below example, we search for the terms, safari and butter in the result set.
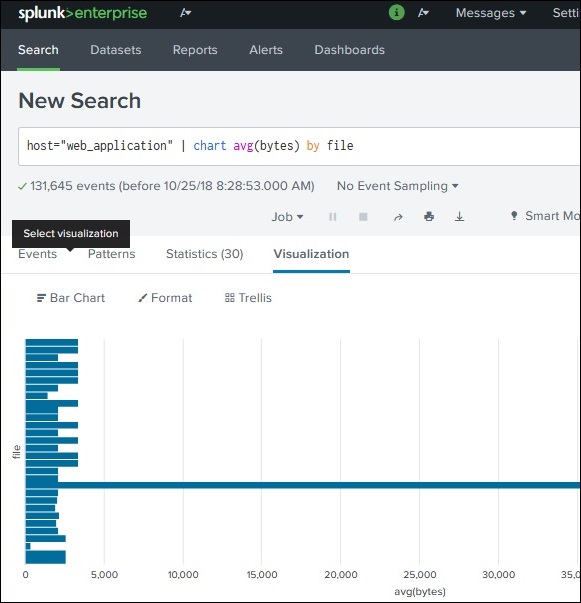
Chart
The chart command is a transforming command that returns your results in a table format. The results can then be used to display the data as a chart, such as column, line, area, etc. In the below example, we create a horizontal bar chart by plotting the average size of bytes for each file type.
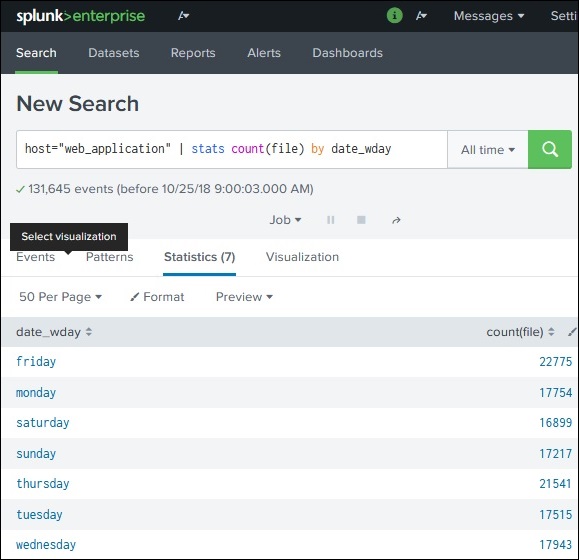
Stats
The Stats command transforms the search result data set into various statistical representations depending on the types of arguments we supply for this command.
In the below example, we use the stats command with count function which is then grouped by another field. Here, we are counting the number of file names created on each week day. The result of the search string come out in a tabular from with rows created for each day.