- Splunk - Home
- Splunk - Overview
- Splunk - Environment
- Splunk - Interfaces
- Splunk - Data Ingestion
- Splunk - Source Types
- Splunk - Basic Searching
- Splunk - Field Searching
- Splunk - Time Range Search
- Splunk - Sharing and Exporting
- Splunk - Search Language
- Splunk - Search Optimization
- Splunk - Transforming commands
- Splunk - Reports
- Splunk - Dashboards
- Splunk - Pivot & Datasets
- Splunk - Lookups
- Splunk - Schedules and Alerts
- Splunk - Knowledge Management
- Splunk - Subseraching
- Splunk - Search Macros
- Splunk - Event Types
- Splunk - Basic Chart
- Splunk - Overlay chart
- Splunk - Sparklines
- Splunk - Managing Indexes
- Splunk - Calculated Fields
- Splunk - Tags
- Splunk - Apps
- Splunk - Removing Data
- Splunk - Custom Chart
- Splunk - Monitoring Files
- Splunk - Sort Command
- Splunk - Top Command
- Splunk - Stats Command
- Splunk Useful Resources
- Splunk - Quick Guide
- Splunk - Useful Resources
- Splunk - Discussion
Splunk - Custom Chart
The charts created in Splunk has many features to customize them as per the user need. These customizations help in displaying the data completely or changing the interval for which the data is calculated. After initially creating the chart, we dive into the customization features.
Let us consider the below search query for getting the statistics of various measurements of byte size of the files by week day. We choose a column chart to display the graph and see the default values in the X-axis and Y-Axis values.

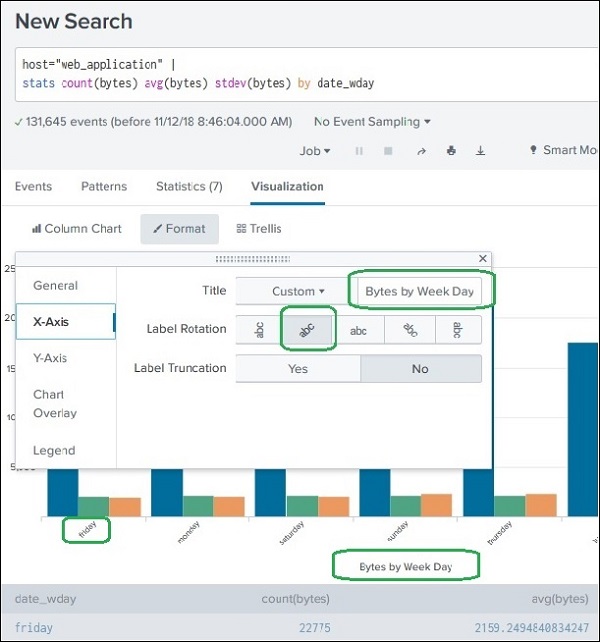
Axis Customization
We can customize the axes displayed in the chart by choosing the Format → X-axis button. Here, we edit the Title of the chart. We also edit the Label Rotation option to choose an inclined label to fit better into the chart. After editing these, results can be seen in the chart as highlighted using the green boxes below.
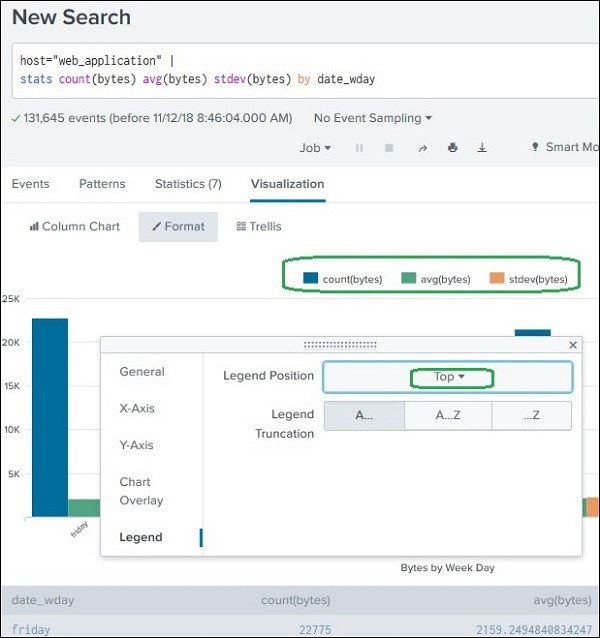
Legend Customization
The legends of the chart can also be customized by using the option Format → Legend. We edit the option Legend Position to mark it at Top. We also edit the Legend Truncation option to Truncate the End of the legend if required. The below cart shows the legends displayed at the top with colors and values.