- Splunk - Home
- Splunk - Overview
- Splunk - Environment
- Splunk - Interfaces
- Splunk - Data Ingestion
- Splunk - Source Types
- Splunk - Basic Searching
- Splunk - Field Searching
- Splunk - Time Range Search
- Splunk - Sharing and Exporting
- Splunk - Search Language
- Splunk - Search Optimization
- Splunk - Transforming commands
- Splunk - Reports
- Splunk - Dashboards
- Splunk - Pivot & Datasets
- Splunk - Lookups
- Splunk - Schedules and Alerts
- Splunk - Knowledge Management
- Splunk - Subseraching
- Splunk - Search Macros
- Splunk - Event Types
- Splunk - Basic Chart
- Splunk - Overlay chart
- Splunk - Sparklines
- Splunk - Managing Indexes
- Splunk - Calculated Fields
- Splunk - Tags
- Splunk - Apps
- Splunk - Removing Data
- Splunk - Custom Chart
- Splunk - Monitoring Files
- Splunk - Sort Command
- Splunk - Top Command
- Splunk - Stats Command
- Splunk Useful Resources
- Splunk - Quick Guide
- Splunk - Useful Resources
- Splunk - Discussion
Splunk - Quick Guide
Splunk - Overview
Splunk is a software which processes and brings out insight from machine data and other forms of big data. This machine data is generated by CPU running a webserver, IOT devices, logs from mobile apps, etc. It is not necessary to provide this data to the end users and does not have any business meaning. However, they are extremely important to understand, monitor and optimize the performance of the machines.
Splunk can read this unstructured, semi-structured or rarely structured data. After reading the data, it allows to search, tag, create reports and dashboards on these data. With the advent of big data, Splunk is now able to ingest big data from various sources, which may or may not be machine data and run analytics on big data.
So, from a simple tool for log analysis, Splunk has come a long way to become a general analytical tool for unstructured machine data and various forms of big data.
Product Categories
Splunk is available in three different product categories as follows −
Splunk Enterprise − It is used by companies which have large IT infrastructure and IT driven business. It helps in gathering and analysing the data from websites, applications, devices and sensors, etc.
Splunk Cloud − It is the cloud hosted platform with same features as the enterprise version. It can be availed from Splunk itself or through the AWS cloud platform.
Splunk Light − It allows search, report and alert on all the log data in real time from one place. It has limited functionalities and features as compared to the other two versions.
Splunk Features
In this section, we shall discuss the important features of enterprise edition −
Data Ingestion
Splunk can ingest a variety of data formats like JSON, XML and unstructured machine data like web and application logs. The unstructured data can be modeled into a data structure as needed by the user.
Data Indexing
The ingested data is indexed by Splunk for faster searching and querying on different conditions.
Data Searching
Searching in Splunk involves using the indexed data for the purpose of creating metrics, predicting future trends and identifying patterns in the data.
Using Alerts
Splunk alerts can be used to trigger emails or RSS feeds when some specific criteria are found in the data being analyzed.
Dashboards
Splunk Dashboards can show the search results in the form of charts, reports and pivots, etc.
Data Model
The indexed data can be modelled into one or more data sets that is based on specialized domain knowledge. This leads to easier navigation by the end users who analyze the business cases without learning the technicalities of the search processing language used by Splunk.
Splunk - Environment
In this tutorial, we will aim to install the enterprise version. This version is available for a free evaluation for 60 days with all features enabled. You can download the setup using the below link which is available for both windows and Linux platforms.
https://www.splunk.com/en_us/download/splunk-enterprise.html.
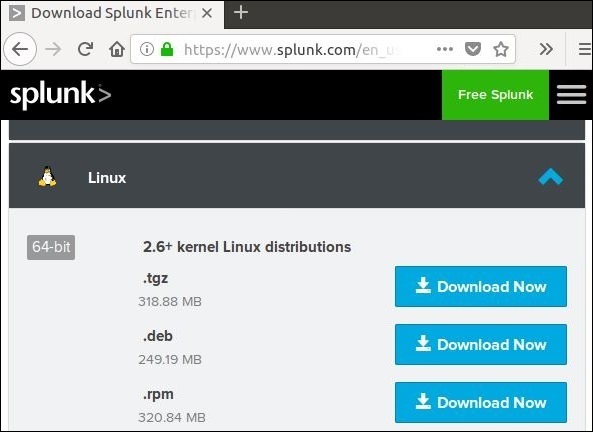
Linux Version
The Linux version is downloaded from the download link given above. We choose the .deb package type as the installation will be done in a Ubuntu platform.
We shall learn this with a step by step approach −
Step 1
Download the .deb package as shown in the screenshot below −
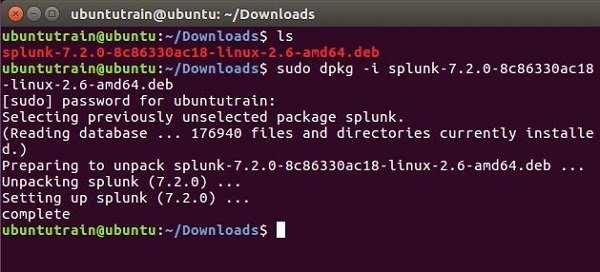
Step 2
Go to the download directory and install Splunk using the above downloaded package.
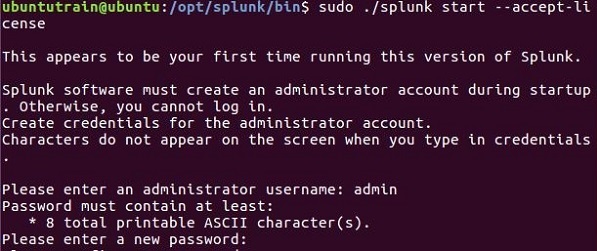
Step 3
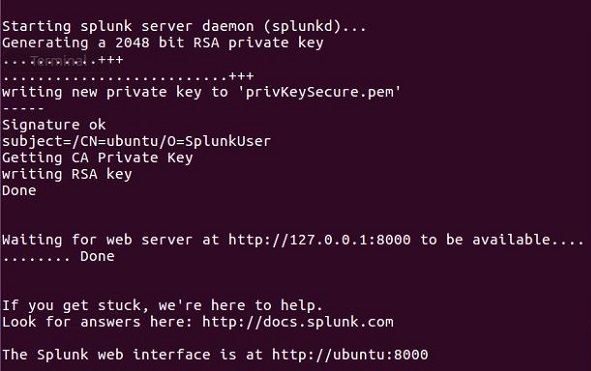
Next you can start Splunk by using the following command with accept license argument. It will ask for administrator user name and password which you should provide and remember.
Step 4
The Splunk server starts and mentions the URL where the Splunk interface can be accessed.
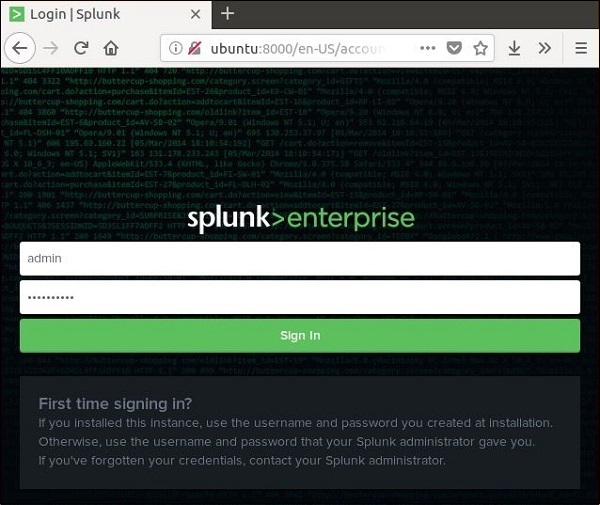
Step 5
Now, you can access the Splunk URL and enter the admin user ID and password created in step 3.
Windows Version
The windows version is available as a msi installer as shown in the below image −
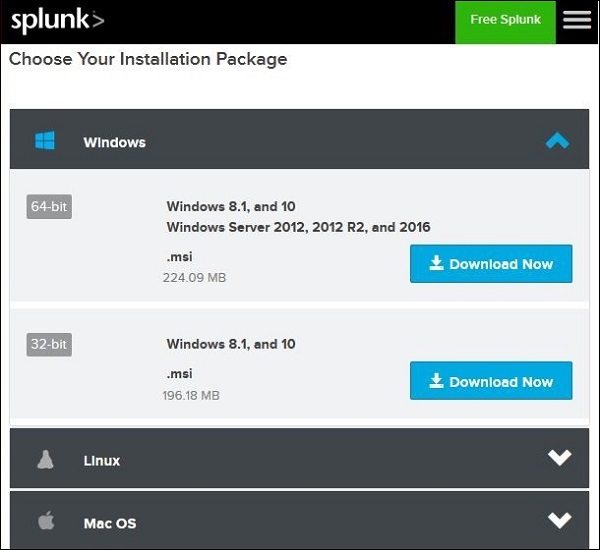
Double clicking on the msi installer installs the Windows version in a straight forward process. The two important steps where we must make the right choice for successful installation are as follows.
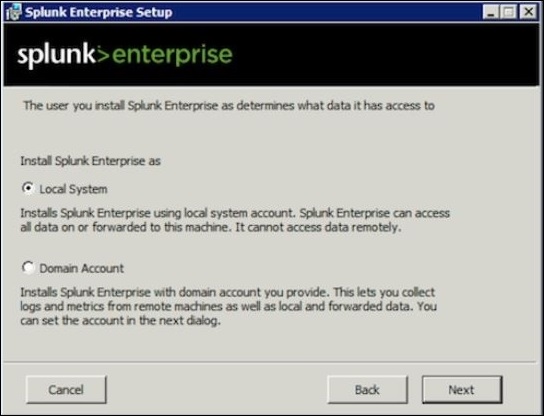
Step 1
As we are installing it on a local system, choose the local system option as given below −
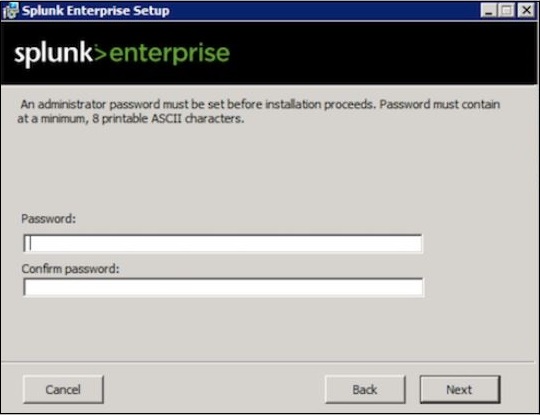
Step 2
Enter the password for the administrator and remember it, as it will be used in the future configurations.
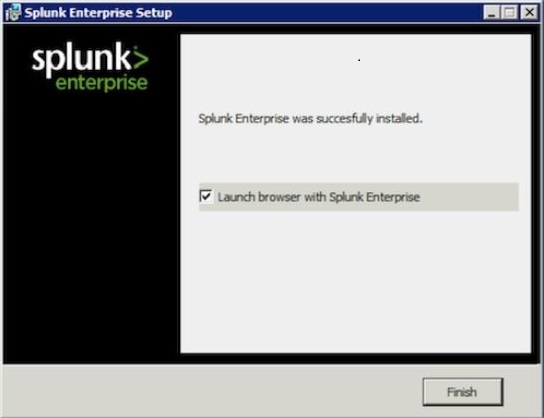
Step 3
In the final step, we see that Splunk is successfully installed and it can be launched from the web browser.
Step 4
Next, open the browser and enter the given url, http://localhost:8000, and login to the Splunk using the admin user ID and password.
Splunk - Interface
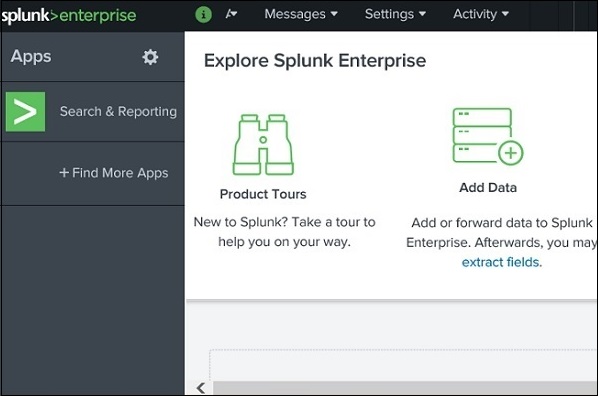
The Splunk web interface consists of all the tools you need to search, report and analyse the data that is ingested. The same web interface provides features for administering the users and their roles. It also provides links for data ingestion and the in-built apps available in Splunk.
The below picture shows the initial screen after your login to Splunk with the admin credentials.
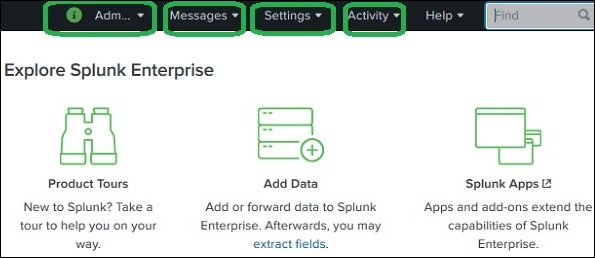
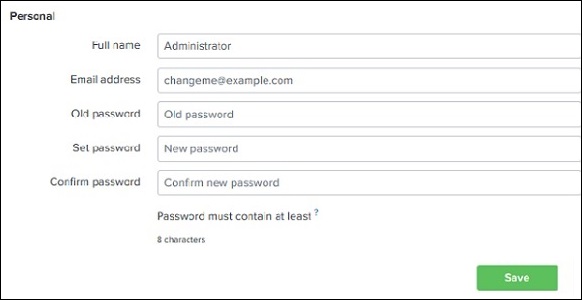
Administrator Link
The Administrator drop down gives the option to set and edit the details of the administrator. We can reset the admin email ID and password using the below screen −
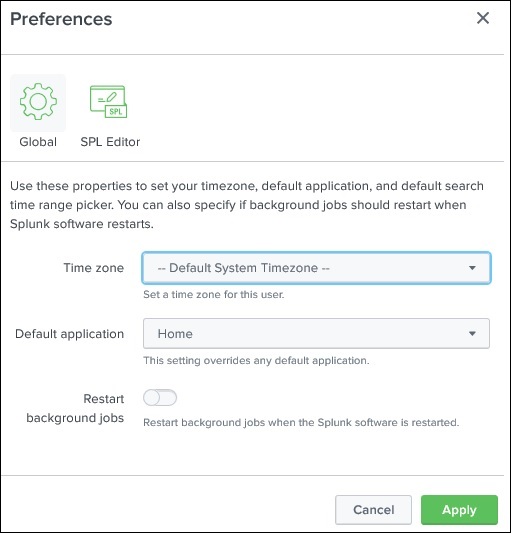
Further from the administrator link, we can also navigate to the preferences option where we can set the time zone and home application on which the landing page will open after your login. Currently, it opened on the Home page as shown below −
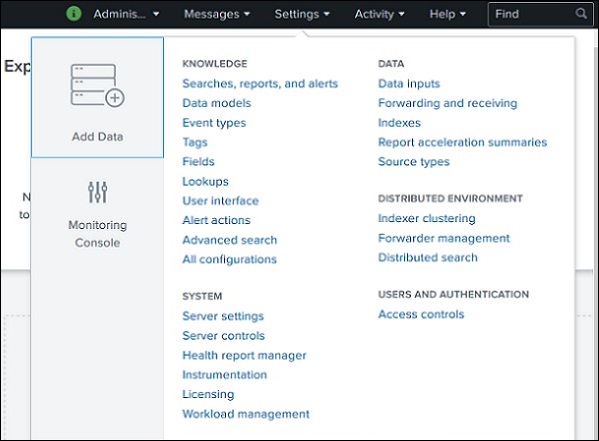
Settings Link
This is a link which shows all the core features available in Splunk. For example, you can add the lookup files and lookup definitions by choosing the lookup link.
We will discuss the important settings of these links in the subsequent chapters.
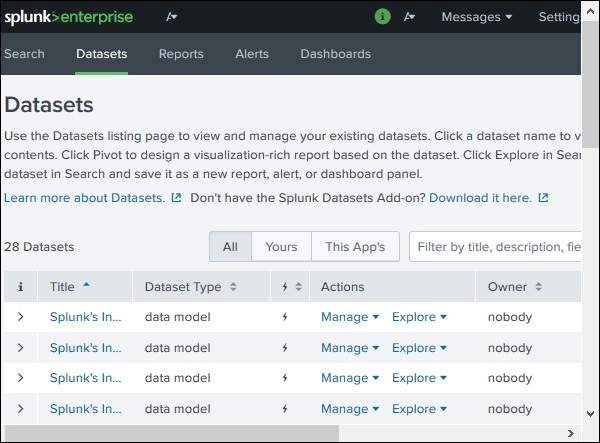
Search and Reporting Link
The search and reporting link takes us to the features where we can find the data sets that are available for searching the reports and alerts created for these searches. It is clearly shown in the below screenshot −
Splunk - Data Ingestion
Data ingestion in Splunk happens through the Add Data feature which is part of the search and reporting app. After logging in, the Splunk interface home screen shows the Add Data icon as shown below.
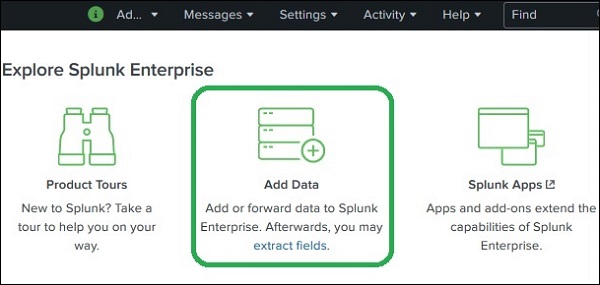
On clicking this button, we are presented with the screen to select the source and format of the data we plan to push to Splunk for analysis.
Gathering The Data
We can get the data for analysis from the Official Website of Splunk. Save this file and unzip it in your local drive. On opening the folder, you can find three files which have different formats. They are the log data generated by some web apps. We can also gather another set of data provided by Splunk which is available at from the Official Splunk webpage.
We will use data from both these sets for understanding the working of various features of Splunk.
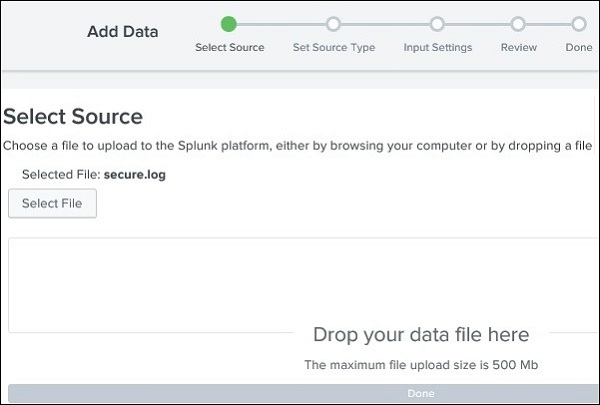
Uploading data
Next, we choose the file, secure.log from the folder, mailsv which we have kept in our local system as mentioned in the previous paragraph. After selecting the file, we move to next step using the green coloured next button in the top right corner.
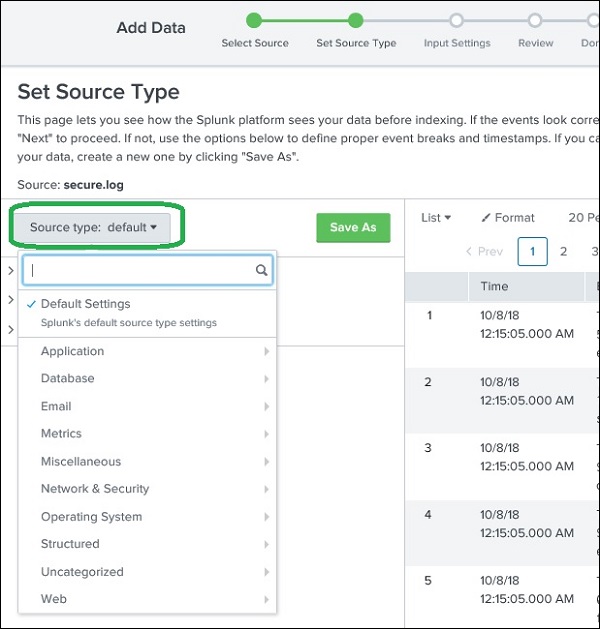
Selecting Source Type
Splunk has an in-built feature to detect the type of the data being ingested. It also gives the user an option to choose a different data type than the chosen by Splunk. On clicking the source type drop down, we can see various data types that Splunk can ingest and enable for searching.
In the current example given below, we choose the default source type.
Input Settings
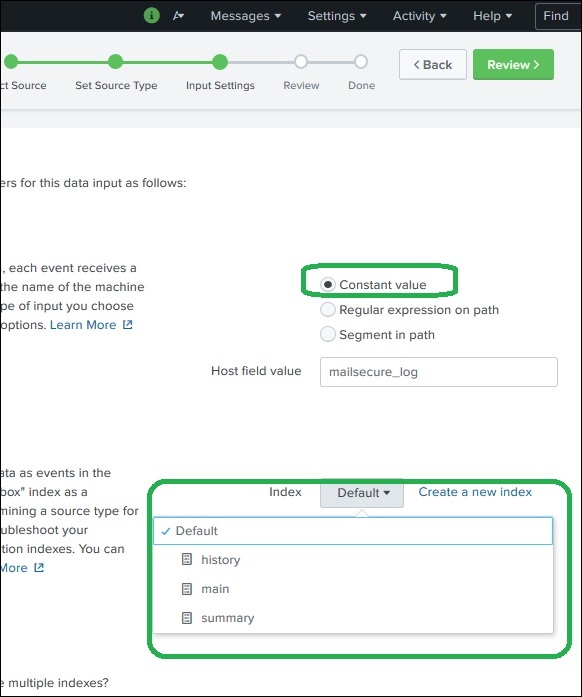
In this step of data ingestion, we configure the host name from which the data is being ingested. Following are the options to choose from, for the host name −
Constant value
It is the complete host name where the source data resides.
regex on path
When you want to extract the host name with a regular expression. Then enter the regex for the host you want to extract in the Regular expression field.
segment in path
When you want to extract the host name from a segment in your data source's path, enter the segment number in the Segment number field. For example, if the path to the source is /var/log/ and you want the third segment (the host server name) to be the host value, enter "3".
Next, we choose the index type to be created on the input data for searching. We choose the default index strategy. The summary index only creates summary of the data through aggregation and creates index on it while the history index is for storing the search history. It is clearly depicted in the image below −
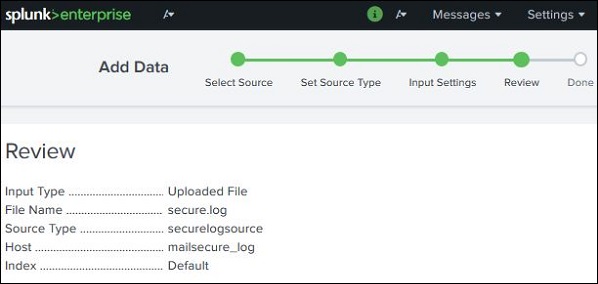
Review Settings
After clicking on the next button, we see a summary of the settings we have chosen. We review it and choose Next to finish the uploading of data.
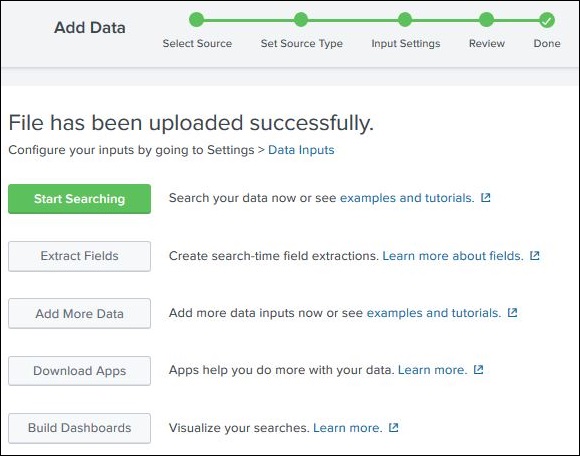
On finishing the load, the below screen appears which shows the successful data ingestion and further possible actions we can take on the data.
Splunk - Source Types
All the incoming data to Splunk are first judged by its inbuilt data processing unit and classified to certain data types and categories. For example, if it is a log from apache web server, Splunk is able to recognize that and create appropriate fields out of the data read.
This feature in Splunk is called source type detection and it uses its built-in source types that are known as "pretrained" source types to achieve this.
This makes things easier for analysis as the user does not have to manually classify the data and assign any data types to the fields of the incoming data.
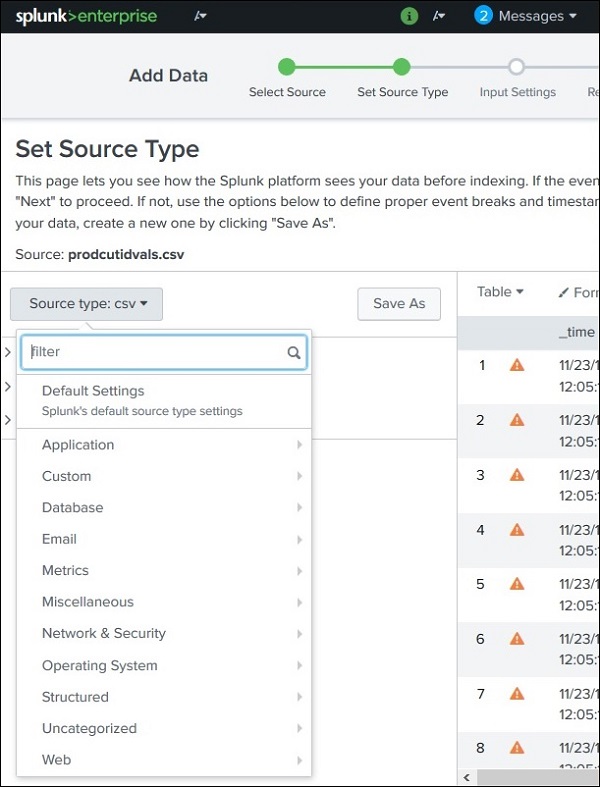
Supported Source Types
The supported source types in Splunk can be seen by uploading a file through the Add Data feature and then selecting the dropdown for Source Type. In the below image, we have uploaded a CSV file and then checked for all the available options.
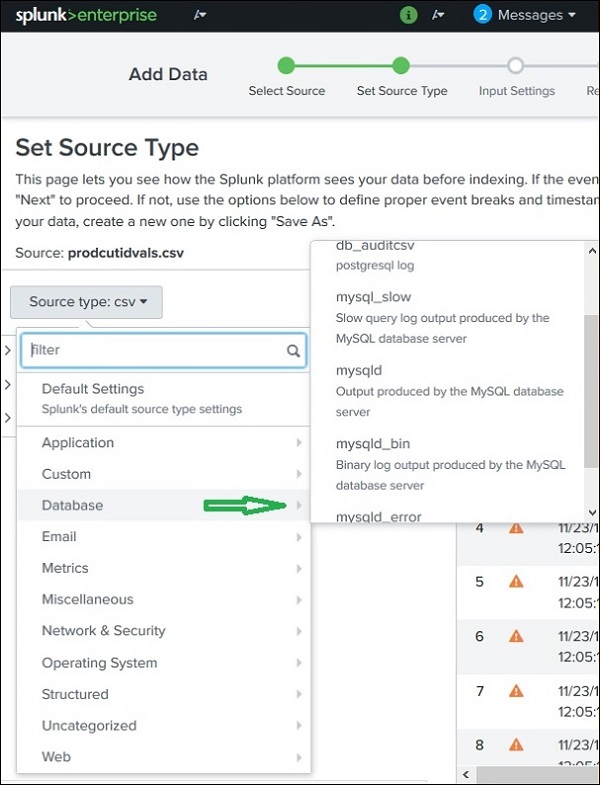
Source Type Sub-Category
Even in those categories, we can further click to see all the sub categories that are supported. So when you choose the database category, you can find the different types of databases and their supported files which Splunk can recognize.
Pre-Trained Source Types
The below table lists some of the important pre-trained source types Splunk recognizes −
| Source Type Name | Nature |
|---|---|
| access_combined | NCSA combined format http web server logs (can be generated by apache or other web servers) |
| access_combined_wcookie | NCSA combined format http web server logs (can be generated by apache or other web servers), with cookie field added at end |
| apache_error | Standard Apache web server error log |
| linux_messages_syslog | Standard linux syslog (/var/log/messages on most platforms) |
| log4j | Log4j standard output produced by any J2EE server using log4j |
| mysqld_error | Standard mysql error log |
Splunk - Basic Search
Splunk has a robust search functionality which enables you to search the entire data set that is ingested. This feature is accessed through the app named as Search & Reporting which can be seen in the left side bar after logging in to the web interface.
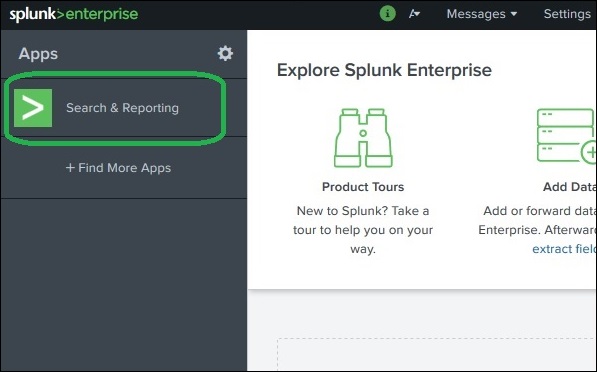
On clicking on the search & Reporting app, we are presented with a search box, where we can start our search on the log data that we uploaded in the previous chapter.
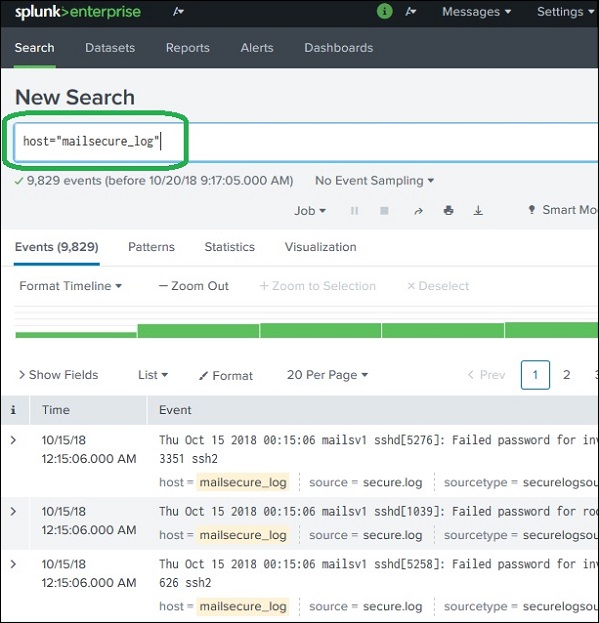
We type the host name in the format as shown below and click on the search icon present in the right most corner. This gives us the result highlighting the search term.
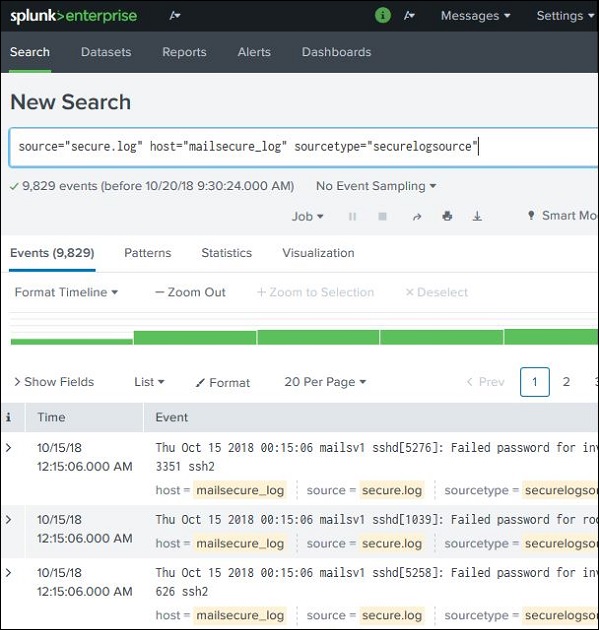
Combining Search Terms
We can combine the terms used for searching by writing them one after another but putting the user search strings under double quotes.
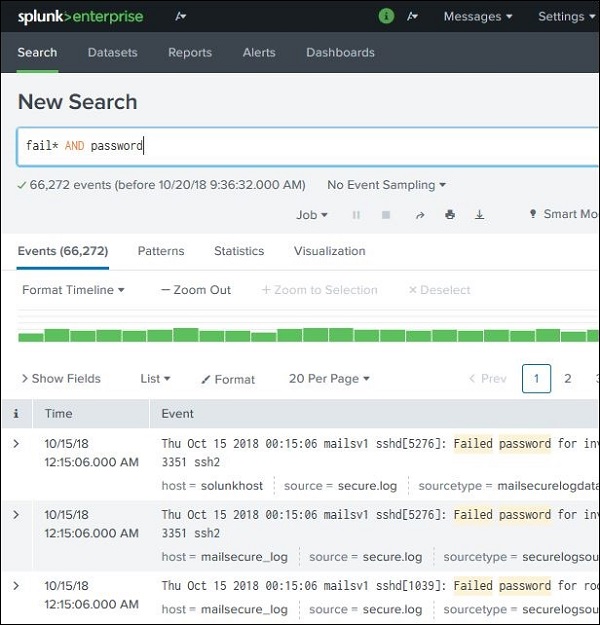
Using Wild Card
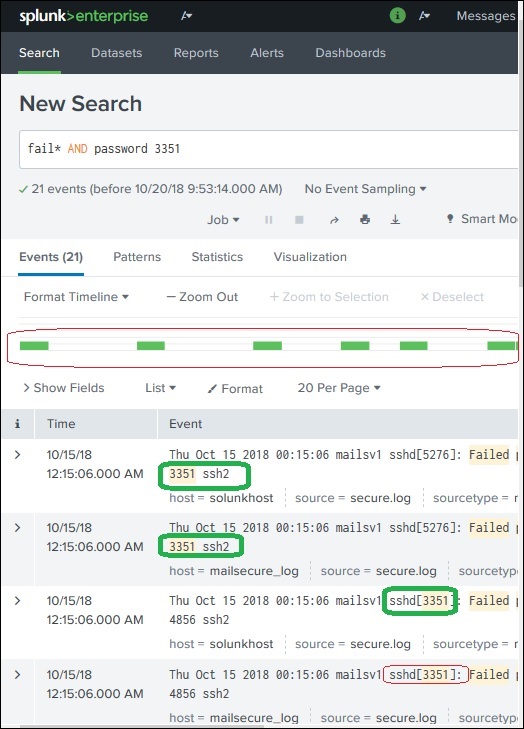
We can use wild cards in our search option combined with the AND/OR operators. In the below search, we get the result where the log file has the terms containing fail, failed, failure, etc., along with the term password in the same line.
Refining Search Results
We can further refine the search result by selecting a string and adding it to the search. In the below example, we click over the string 3351 and select the option Add to Search.
After 3351 is added to the search term, we get the below result which shows only those lines from the log containing 3351 in them. Also mark how the time line of the search result has changed as we have refined the search.
Splunk - Field Searching
When Splunk reads the uploaded machine data, it interprets the data and divides it into many fields which represent a single logical fact about the entire data record.
For example, a single record of information may contain server name, timestamp of the event, type of the event being logged whether login attempt or a http response, etc. Even in case of unstructured data, Splunk tries to divide the fields into key value pairs or separate them based on the data types they have, numeric and string, etc.
Continuing with the data uploaded in the previous chapter, we can see the fields from the secure.log file by clicking on the show fields link which will open up the following screen. We can notice the fields Splunk has generated from this log file.
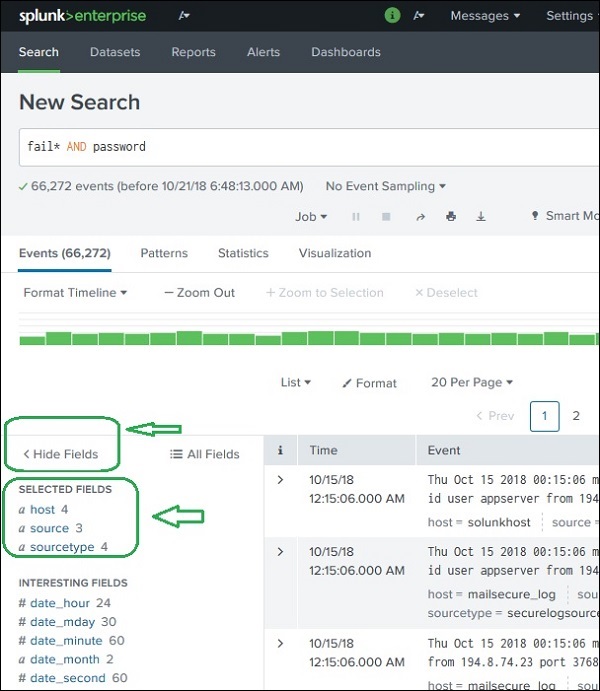
Choosing the Fields
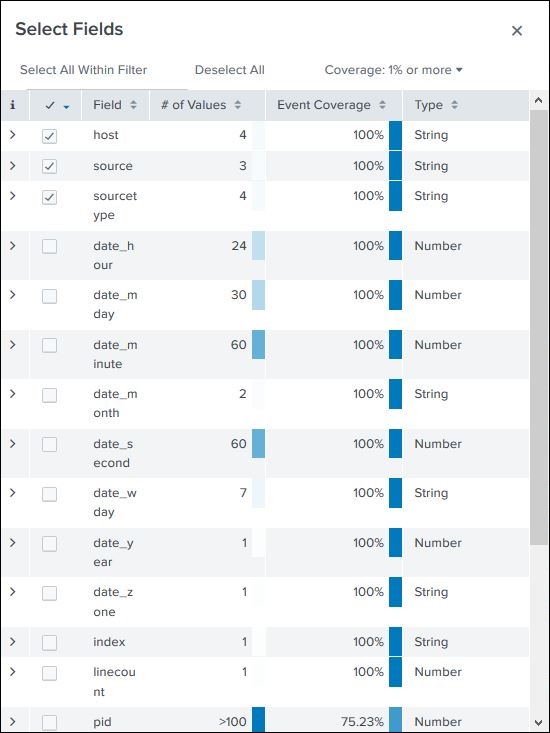
We can choose what fields to be displayed by selecting or unselecting the fields from the list of all fields. Clicking on all fields opens a window showing the list of all the fields. Some of these fields have check marks against them showing they are already selected. We can use the check boxes to choose our fields for display.
Besides the name of the field, it displays the number of distinct values the fields have, its data type and what percentage of events this field is present in.
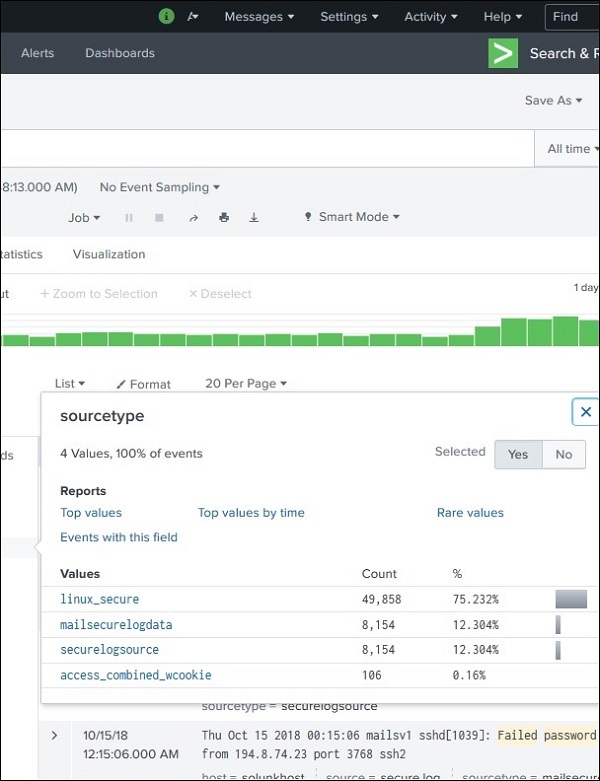
Field Summary
Very detailed stats for every selected field become available by clicking on the name of the field. It shows all the distinct values for the field, their count and their percentages.
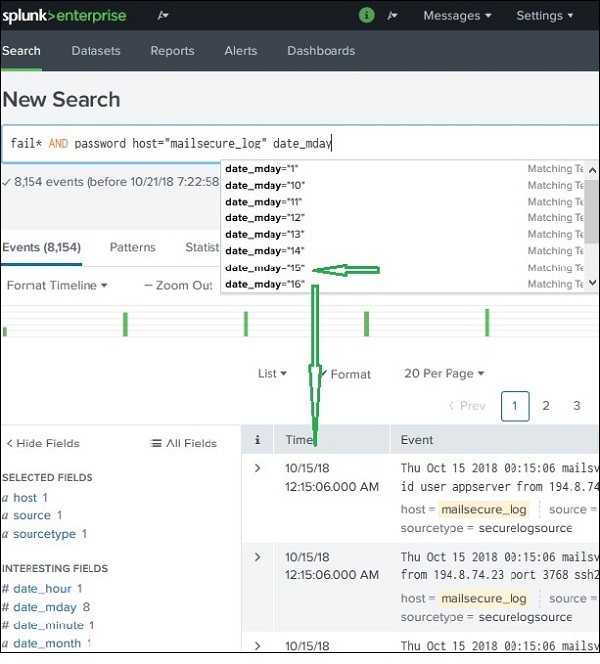
Using Fields in Search
The field names can also be inserted into the search box along with the specific values for the search. In the below example, we aim to find all the records for the date, 15th Oct for the host named mailsecure_log. We get the result for this specific date.
Splunk - Time Range Search
The Splunk web interface displays timeline which indicates the distribution of events over a range of time. There are preset time intervals from which you can select a specific time range, or you can customize the time range as per your need.
The below screen shows various preset timeline options. Choosing any of these options will fetch the data for only that specific time period which you can also analyse further, using the custom timeline options available.
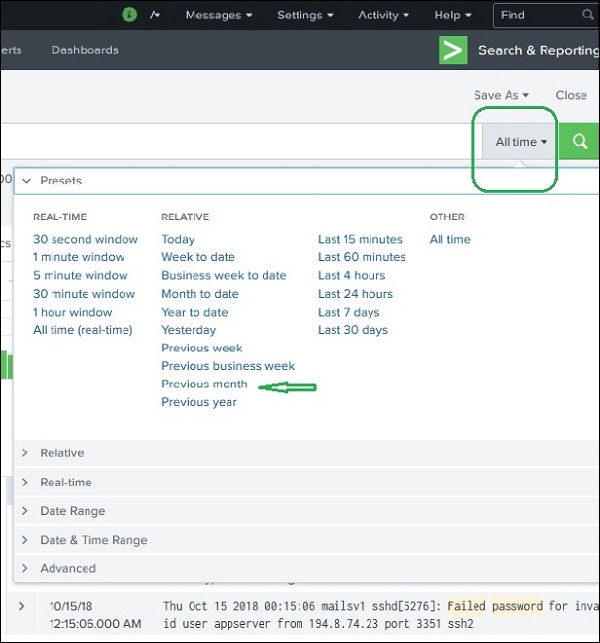
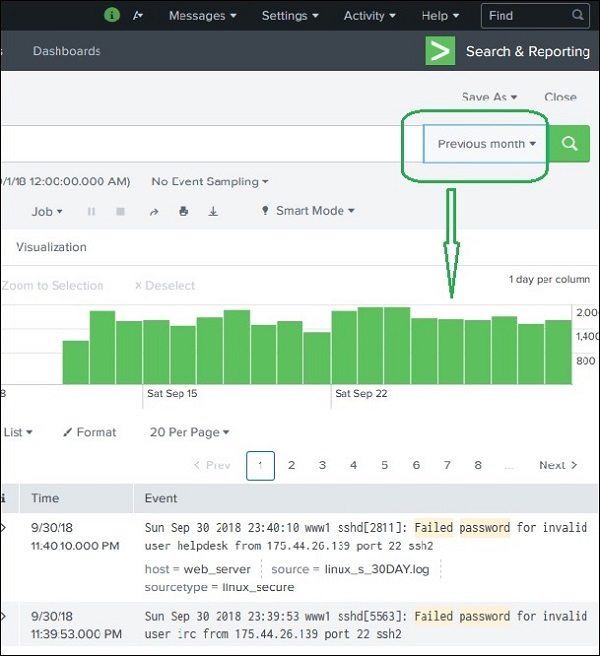
For example, choosing the previous month option gives us the result only for the previous month as you can see the in spread of the timeline graph below.
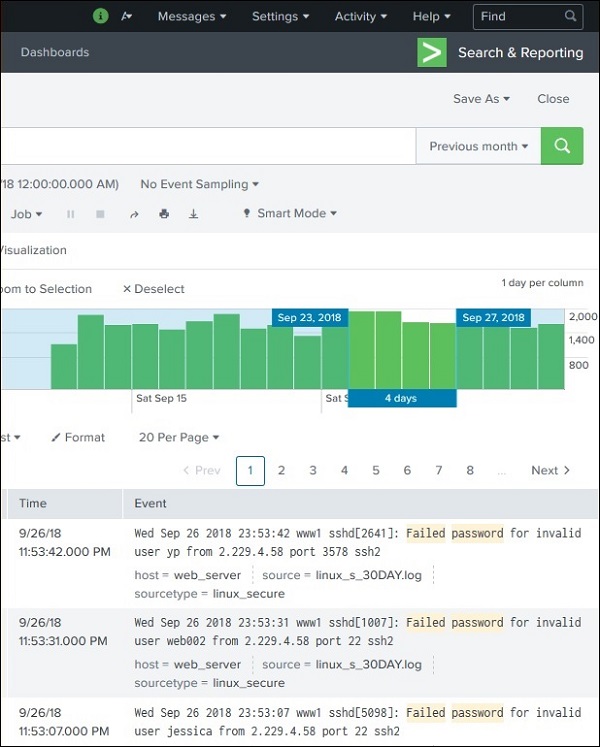
Selecting a Time Subset
By clicking and dragging across the bars in the timeline, we can select a subset of the result that already exists. This does not cause the re-execution of the query. It only filters out the records from the existing result set.
Below image shows the selection of a subset from the result set −
Earliest and Latest
The two commands, earliest and latest can be used in the search bar to indicate the time range in between which you filter out the results. It is similar to selecting the time subset, but it is through commands rather than the option of clicking at a specific time line bar. So, it provides a finer control over that data range you can pick for your analysis.
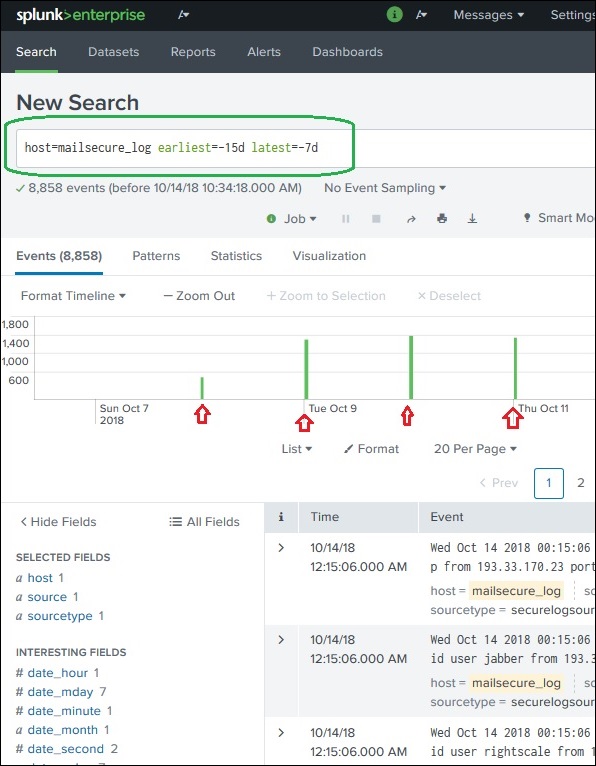
In the above image, we give a time range between last 7 days to last 15 days. So, the data in between these two days is displayed.
Nearby Events
We can also find nearby events of a specific time by mentioning how close we want the events to be filtered out. We have the option of choosing the scale of the interval, like seconds, minutes, days and week etc.
Splunk - Sharing Exporting
When you run a search query, the result is stored as a job in the Splunk server. While this job was created by one specific user, it can be shared across with other users so that they can start using this result set without the necessity of building the query for it again. The results can also be exported and saved as files which can be shared with users who do not use Splunk.
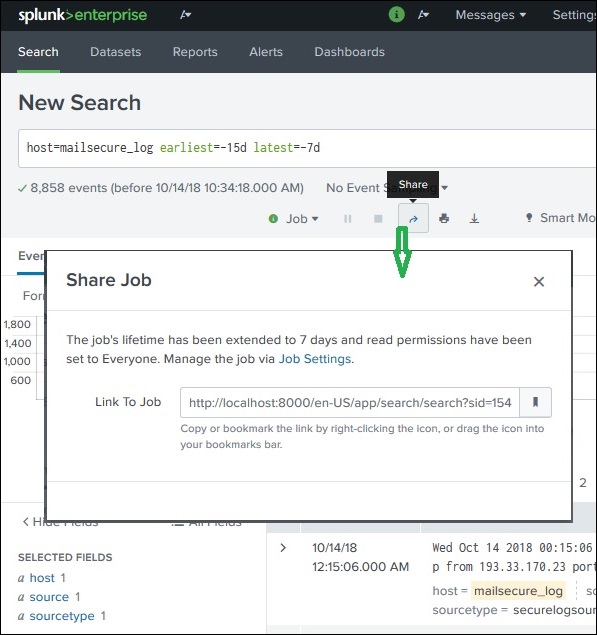
Sharing the Search Result
Once a query has run successfully, we can see a small upward arrow in the middle right of the web page. Clicking on this icon gives a URL where the query and the result can be accessed. There is a need to grant permission to the users who will be using this link. Permission is granted through the Splunk administration interface.
Finding the Saved Results
The jobs that are saved to be used by all users with appropriate permissions can be located by looking for the jobs link under the activity menu in the top right bar of the Splunk interface. In the below image, we click on the highlighted link named jobs to find the saved jobs.
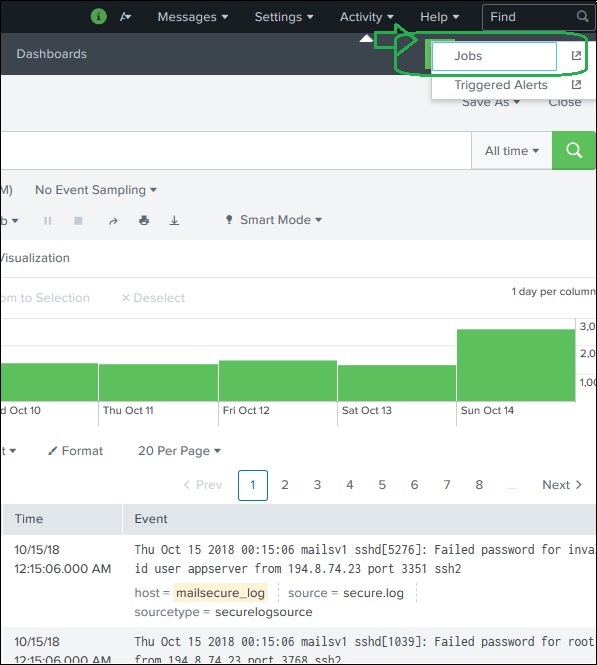
After the above link is clicked, we get the list of all the saved jobs as shown below. He, we have to note that there is an expiry date post where the saved job will automatically get removed from Splunk. You can adjust this date by selecting the job and clicking on Edit selected and then choosing Extend Expiration.

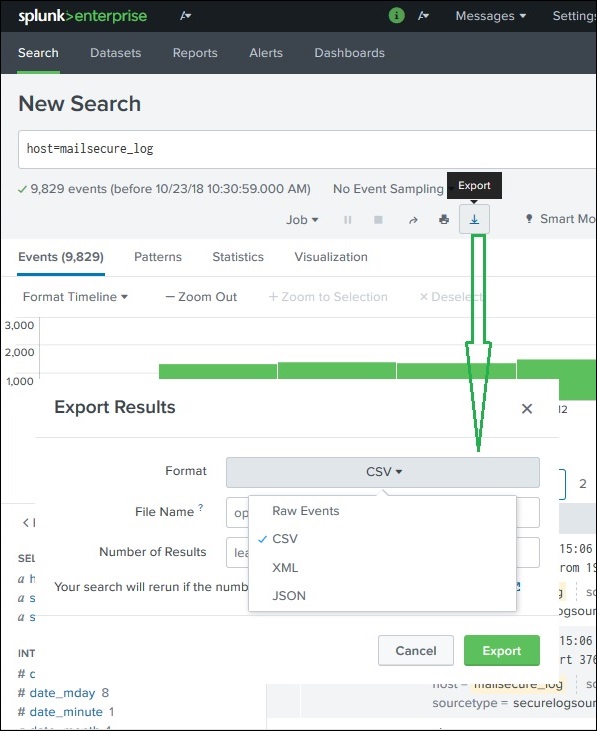
Exporting the Search Result
We can also export the results of a search into a file. The three different formats available for export are: CSV, XML and JSON. Clicking on the Export button after choosing the formats downloads the file from the local browser into the local system. This is explained in the below image −
Splunk - Search Language
The Splunk Search Processing Language (SPL) is a language containing many commands, functions, arguments, etc., which are written to get the desired results from the datasets. For example, when you get a result set for a search term, you may further want to filter some more specific terms from the result set. For this, you need some additional commands to be added to the existing command. This is achieved by learning the usage of SPL.
Components of SPL
The SPL has the following components.
Search Terms − These are the keywords or phrases you are looking for.
Commands − The action you want to take on the result set like format the result or count them.
Functions − What are the computations you are going to apply on the results. Like Sum, Average etc.
Clauses − How to group or rename the fields in the result set.
Let us discuss all the components with the help of images in the below section −
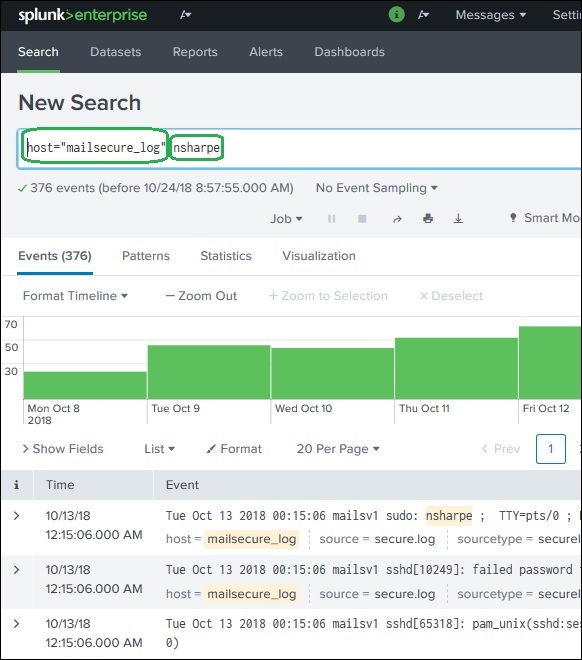
Search Terms
These are the terms you mention in the search bar to get specific records from the dataset which meet the search criteria. In the below example, we are searching for records which contain two highlighted terms.
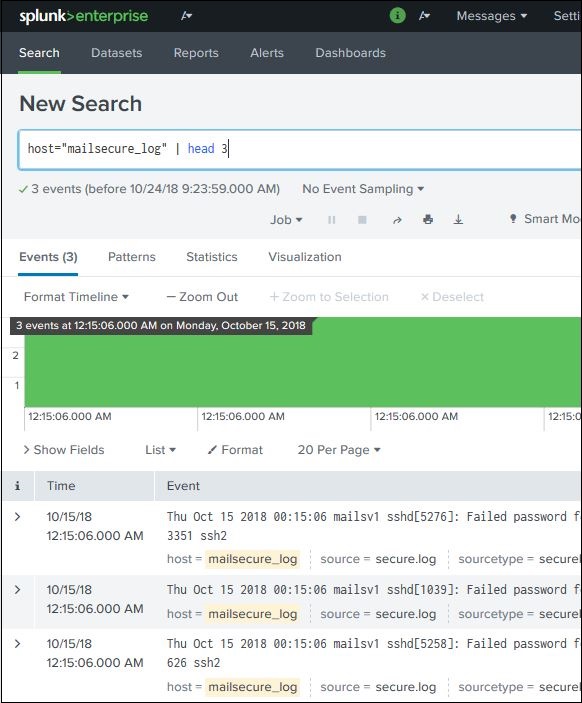
Commands
You can use many in-built commands that SPL provides to simplify the process of analysing the data in the result set. In the below example we use the head command to filter out only the top 3 results from a search operation.
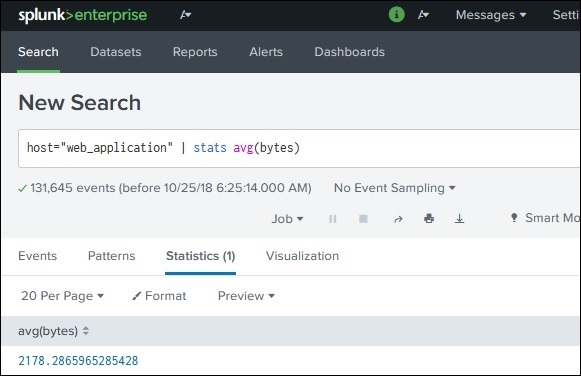
Functions
Along with commands, Splunk also provides many in-built functions which can take input from a field being analysed and give the output after applying the calculations on that field. In the below example, we use the Stats avg() function which calculates the average value of the numeric field being taken as input.
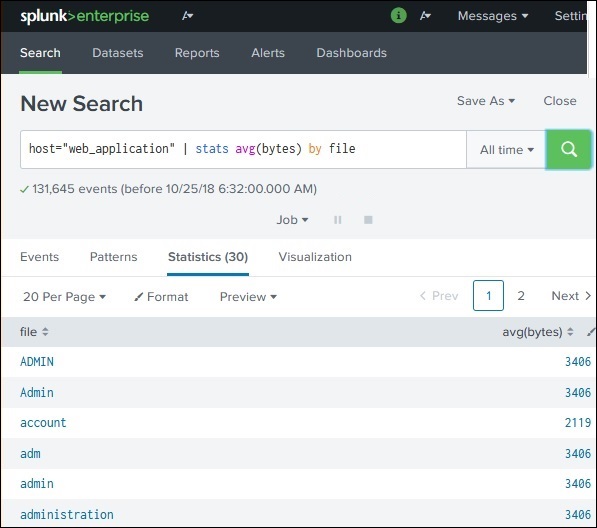
Clauses
When we want to get results grouped by some specific field or we want to rename a field in the output, we use the group by clause and the as clause respectively. In the below example, we get the average size of bytes of each file present in the web_application log. As you can see, the result shows the name of each file as well as the average bytes for each file.