- Splunk - Home
- Splunk - Overview
- Splunk - Environment
- Splunk - Interfaces
- Splunk - Data Ingestion
- Splunk - Source Types
- Splunk - Basic Searching
- Splunk - Field Searching
- Splunk - Time Range Search
- Splunk - Sharing and Exporting
- Splunk - Search Language
- Splunk - Search Optimization
- Splunk - Transforming commands
- Splunk - Reports
- Splunk - Dashboards
- Splunk - Pivot & Datasets
- Splunk - Lookups
- Splunk - Schedules and Alerts
- Splunk - Knowledge Management
- Splunk - Subseraching
- Splunk - Search Macros
- Splunk - Event Types
- Splunk - Basic Chart
- Splunk - Overlay chart
- Splunk - Sparklines
- Splunk - Managing Indexes
- Splunk - Calculated Fields
- Splunk - Tags
- Splunk - Apps
- Splunk - Removing Data
- Splunk - Custom Chart
- Splunk - Monitoring Files
- Splunk - Sort Command
- Splunk - Top Command
- Splunk - Stats Command
- Splunk Useful Resources
- Splunk - Quick Guide
- Splunk - Useful Resources
- Splunk - Discussion
Splunk - Pivot and Datasets
Splunk can ingest different types of data sources and build tables which are similar to relational tables. These are called table dataset or just tables. They provide easy ways to analyse and filter the data and lookups, etc. These table data sets are also used in creating pivot analysis which we learn in this chapter.
Creating a Dataset
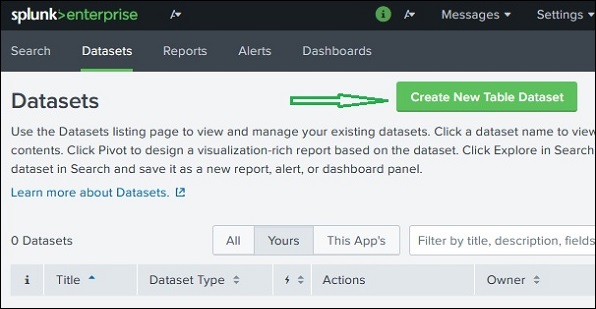
We use a Splunk Add-on named Splunk Datasets Add-on to create and manage the datasets. It can be downloaded from the Splunk website, https://splunkbase.splunk.com/app/3245/#/details. It has to be installed by following the instructions given in the details tab in this link. On successful installation, we see a button named Create New Table Dataset.
Selecting a Dataset
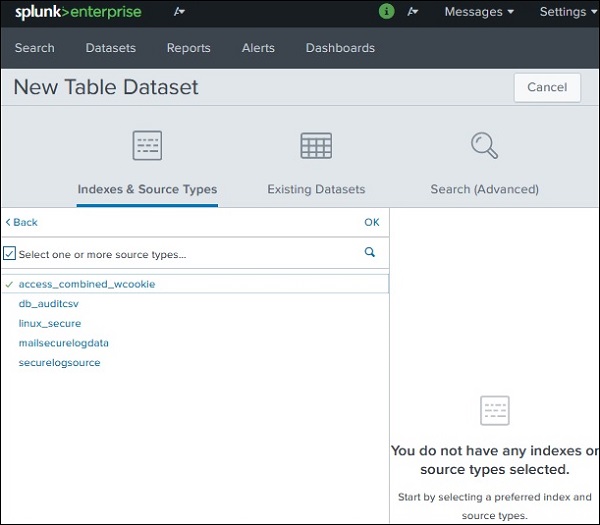
Next, we click on the Create New Table Dataset button and it gives us the option to choose from the below three options.
Indexes and Source Types − Choose from an existing index or source type which are already added to Splunk through Add Data app.
Existing Datasets − You might have already created some dataset previously which you want to modify by creating a new dataset from it.
Search − Write a search query and the result can be used to create a new dataset.
In our example, we choose an index to be our source of data set as shown in the image below −
Choosing Dataset Fields
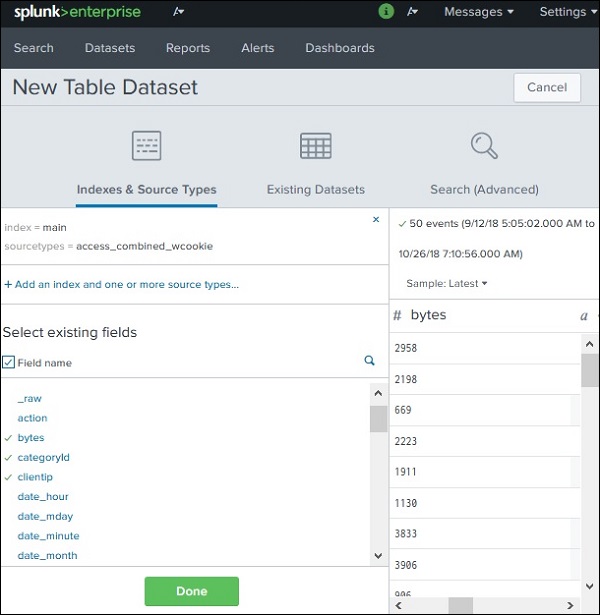
On clicking OK in the above screen, we are presented with an option to choose the various fields we want to finally get into the Table Dataset. The _time field is selected by default and this field cannot be dropped. We choose the fields: bytes, categoryID, clientIP and files.
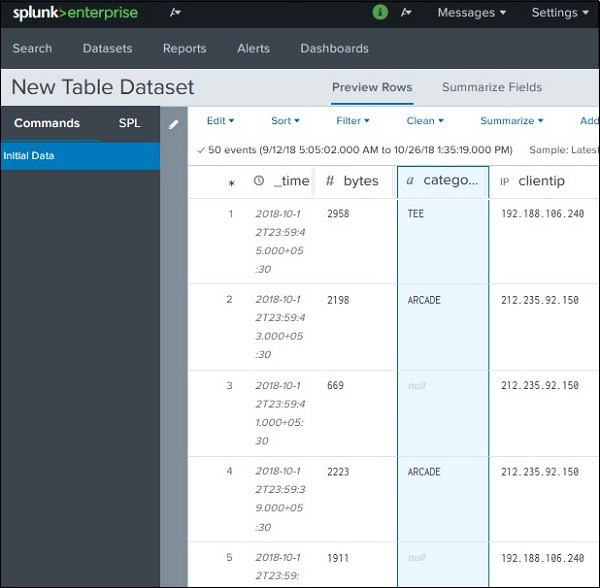
On clicking done in the above screen, we get the final dataset table with all the selected fields, as seen below. Here the dataset has become similar to a relational table. We save the dataset with save as option available in the top right corner.
Creating Pivot
We use the above dataset to create a pivot report. The pivot report reflects aggregation of values of one column with respect to the values in another column. In other words, one columns values are made into rows and another columns values are made into rows.
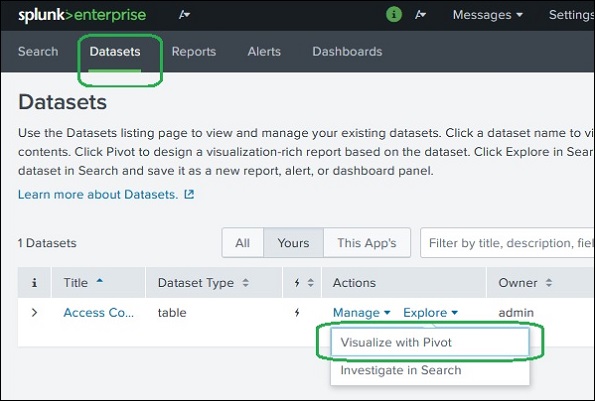
Choose Dataset Action
To achieve this, we first select the dataset using the dataset tab and then choose the option Visualize with Pivot from the Actions column for that data set.
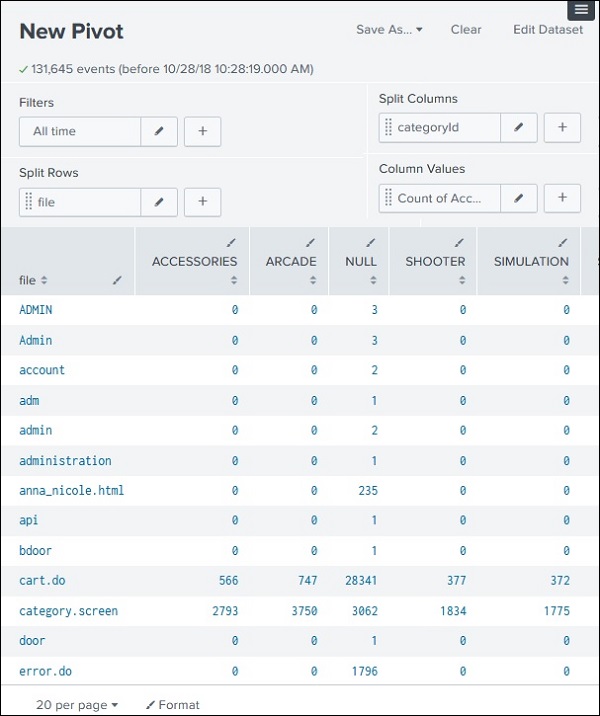
Choose the Pivot Fields
Next, we choose the appropriate fields for creating the pivot table. We choose category ID in the split columns option as this is the field whose values should appear as different columns in the report. Then we choose File in the Split Rows option as this is the field whose values should be presented in rows. The result shows count of each categoryid values for each value in the file field.
Next, we can save the pivot table as a Report or a panel in an existing dashboard for future reference.
