- Splunk - Home
- Splunk - Overview
- Splunk - Environment
- Splunk - Interfaces
- Splunk - Data Ingestion
- Splunk - Source Types
- Splunk - Basic Searching
- Splunk - Field Searching
- Splunk - Time Range Search
- Splunk - Sharing and Exporting
- Splunk - Search Language
- Splunk - Search Optimization
- Splunk - Transforming commands
- Splunk - Reports
- Splunk - Dashboards
- Splunk - Pivot & Datasets
- Splunk - Lookups
- Splunk - Schedules and Alerts
- Splunk - Knowledge Management
- Splunk - Subseraching
- Splunk - Search Macros
- Splunk - Event Types
- Splunk - Basic Chart
- Splunk - Overlay chart
- Splunk - Sparklines
- Splunk - Managing Indexes
- Splunk - Calculated Fields
- Splunk - Tags
- Splunk - Apps
- Splunk - Removing Data
- Splunk - Custom Chart
- Splunk - Monitoring Files
- Splunk - Sort Command
- Splunk - Top Command
- Splunk - Stats Command
- Splunk Useful Resources
- Splunk - Quick Guide
- Splunk - Useful Resources
- Splunk - Discussion
Splunk - Dashboards
A dashboard is used to represent tables or charts which are related to some business meaning. It is done through panels. The panels in a dashboard hold the chart or summarized data in a visually appealing manner. We can add multiple panels, and hence multiple reports and charts to the same dashboard.
Creating Dashboard
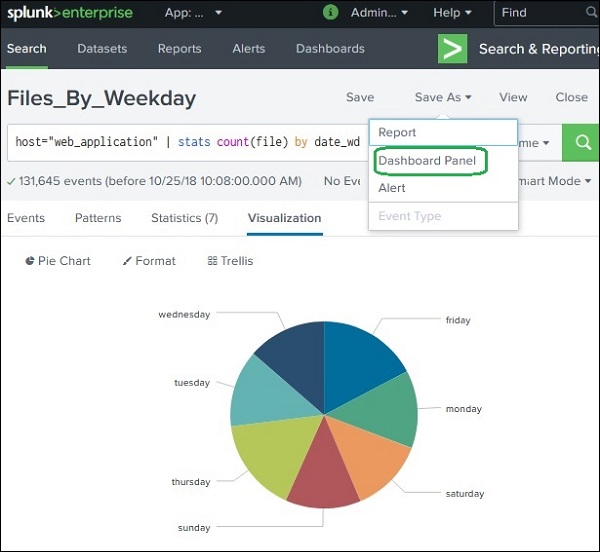
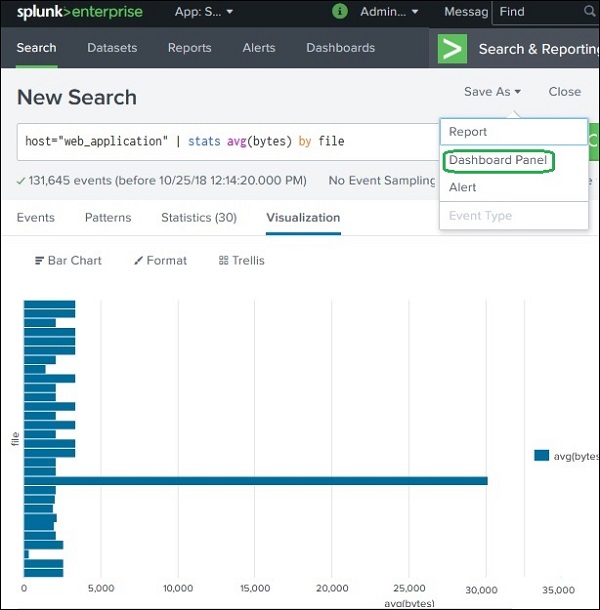
We will continue with the search query from the previous chapter which shows the count of files by week days.
We choose the Visualization tab to see the result as a pie chart. To put the chart on a dashboard, we can choose the option Save As → Dashboard Panel as shown below.
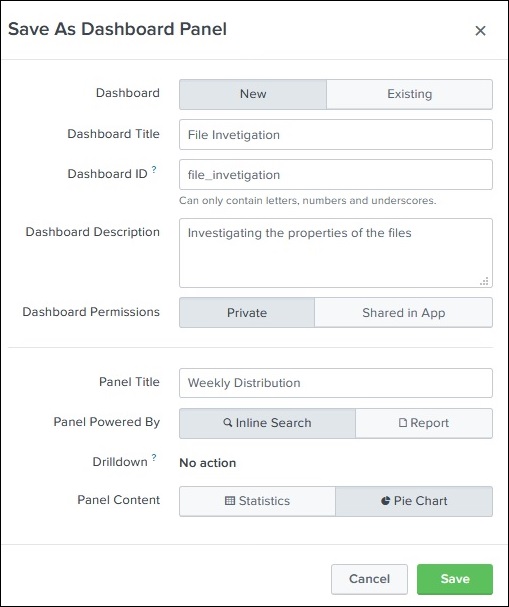
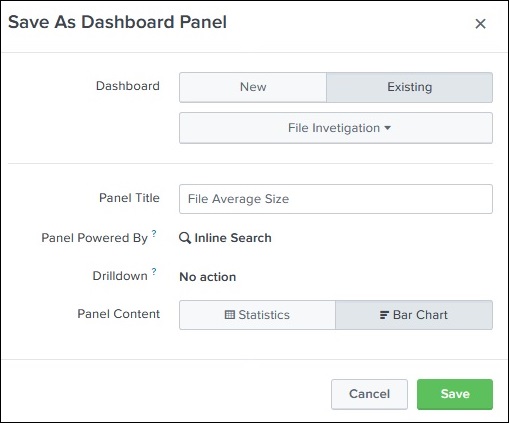
The next screen will ask for fillings the details of the dashboard and the panel in it. We fill the screen with details as shown below.
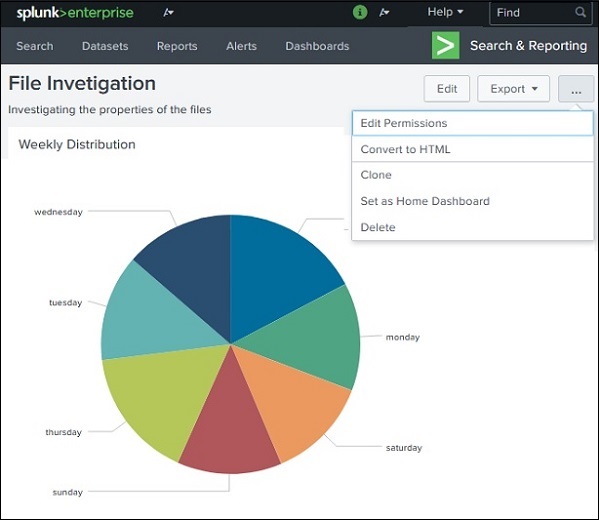
On clicking on Save button, the next screen gives an option to view dashboard. On choosing to view dashboard, we get the following output where we can see the dashboard and options to edit, export or delete.
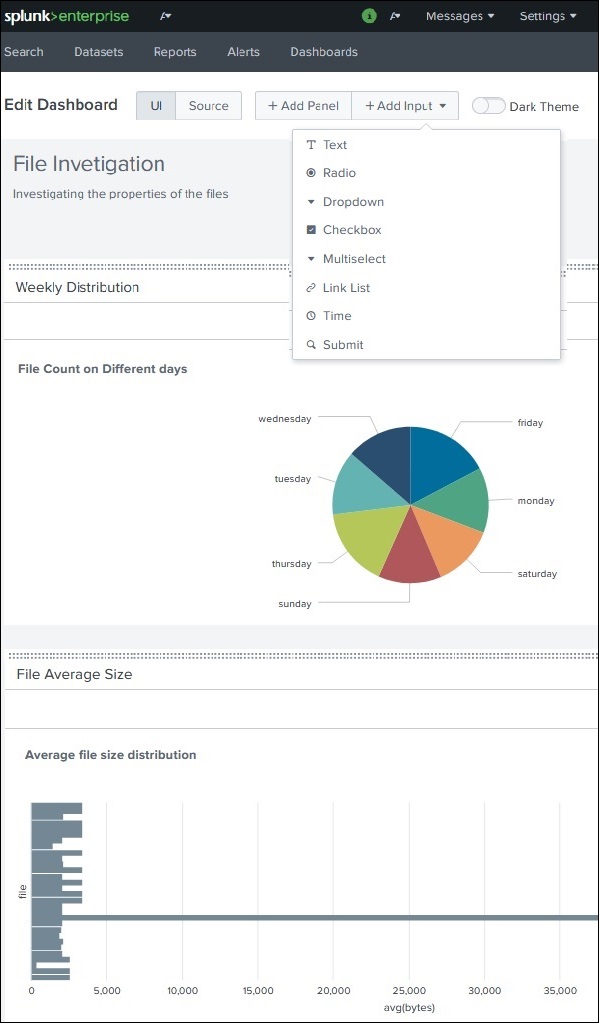
Adding Panel to Dashboard
We can add a second chart to the dashboard by adding a new panel containing the chart. Below is the bar chart and its query which we are going to add to the above dashboard.
Next, we fill up the details for the second chart and click Save as shown in the below image −
Finally, we get the dashboard which contains both the charts in two different panels. As you can see in the image below, we can edit the dashboard to add more panels and you can add more input elements: Text, Radio and Dropdown buttons to create more sophisticated dashboards.