- Splunk - Home
- Splunk - Overview
- Splunk - Environment
- Splunk - Interfaces
- Splunk - Data Ingestion
- Splunk - Source Types
- Splunk - Basic Searching
- Splunk - Field Searching
- Splunk - Time Range Search
- Splunk - Sharing and Exporting
- Splunk - Search Language
- Splunk - Search Optimization
- Splunk - Transforming commands
- Splunk - Reports
- Splunk - Dashboards
- Splunk - Pivot & Datasets
- Splunk - Lookups
- Splunk - Schedules and Alerts
- Splunk - Knowledge Management
- Splunk - Subseraching
- Splunk - Search Macros
- Splunk - Event Types
- Splunk - Basic Chart
- Splunk - Overlay chart
- Splunk - Sparklines
- Splunk - Managing Indexes
- Splunk - Calculated Fields
- Splunk - Tags
- Splunk - Apps
- Splunk - Removing Data
- Splunk - Custom Chart
- Splunk - Monitoring Files
- Splunk - Sort Command
- Splunk - Top Command
- Splunk - Stats Command
- Splunk Useful Resources
- Splunk - Quick Guide
- Splunk - Useful Resources
- Splunk - Discussion
Splunk - Sparklines
A sparkline is a small representation of some statistical information without showing the axes. It generally appears as a line with bumps just to indicate how certain quantity has changed over a period of time. Splunk has in-built function to create sparklines from the events it searches. It is a part of the chart creation function.
Selecting the Fields
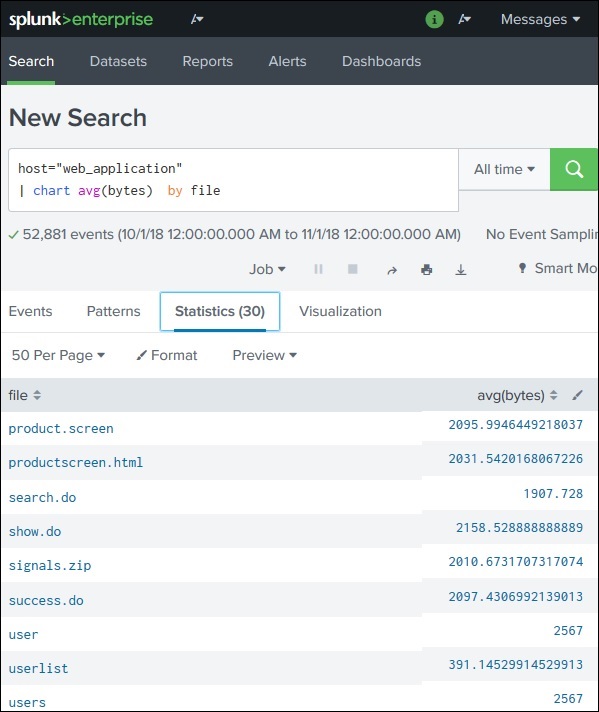
We need to select the field and the search formula which will be used in creating the sparkline. The below image shows the average byte size values of the some of the files in the web_application host.
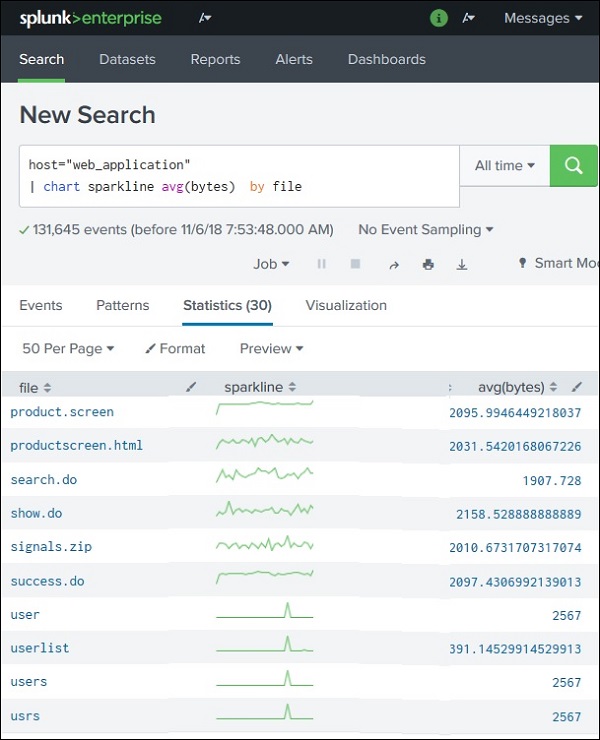
Creating the Sparkline
To create the Sparklines from above statistics, we add the Sparkline function to the search query as shown in the image below. The table view of the above statistics now starts displaying the sparklines for average byte size of those files. Here, we have taken All Time as the time period for calculating the variation in average byte size of files. If we change this time period, then the nature of the graphs will change.
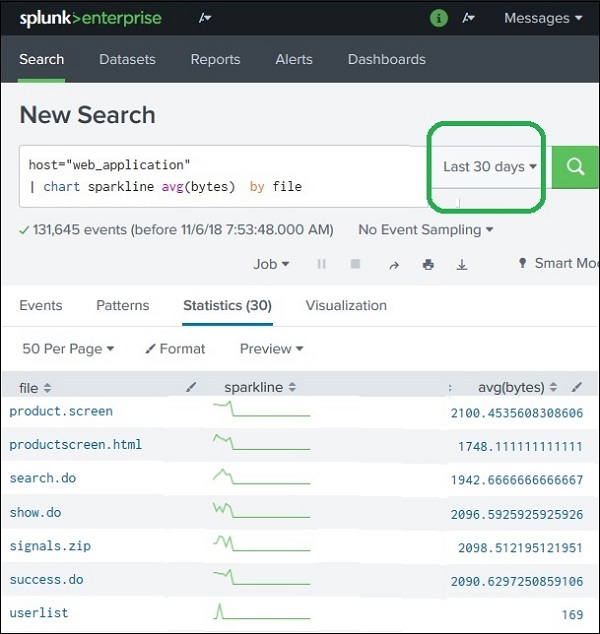
Changing the Time Period
If we change the time period for the above graph from All Time to Last 30 days, we will see the sparklines to be little different as shown below. Here we need to note, how few file names have vanished from the list as those files were not available in that time period.