- Splunk - Home
- Splunk - Overview
- Splunk - Environment
- Splunk - Interfaces
- Splunk - Data Ingestion
- Splunk - Source Types
- Splunk - Basic Searching
- Splunk - Field Searching
- Splunk - Time Range Search
- Splunk - Sharing and Exporting
- Splunk - Search Language
- Splunk - Search Optimization
- Splunk - Transforming commands
- Splunk - Reports
- Splunk - Dashboards
- Splunk - Pivot & Datasets
- Splunk - Lookups
- Splunk - Schedules and Alerts
- Splunk - Knowledge Management
- Splunk - Subseraching
- Splunk - Search Macros
- Splunk - Event Types
- Splunk - Basic Chart
- Splunk - Overlay chart
- Splunk - Sparklines
- Splunk - Managing Indexes
- Splunk - Calculated Fields
- Splunk - Tags
- Splunk - Apps
- Splunk - Removing Data
- Splunk - Custom Chart
- Splunk - Monitoring Files
- Splunk - Sort Command
- Splunk - Top Command
- Splunk - Stats Command
- Splunk Useful Resources
- Splunk - Quick Guide
- Splunk - Useful Resources
- Splunk - Discussion
Splunk - Monitor Files
Splunk Enterprise monitors and indexes the file or directory as new data appears. You can also specify a mounted or shared directory, including network file systems, as long as Splunk Enterprise can read from the directory. If the specified directory contains subdirectories, the monitor process recursively examines them for new files, as long as the directories can be read.
You can include or exclude files or directories from being read by using whitelists and blacklists.
If you disable or delete a monitor input, Splunk Enterprise does not stop indexing the files: input references. It only stops checking those files again.
You specify the path to a file or directory and the monitor processor consumes any new data written to that file or directory. This is how you can monitor live application logs such as those coming from Web access logs, Java 2 Platform or .NET applications, and so on.
Add files to Monitor
Using Splunk web interface, we can add files or directories to be monitored. We go to Splunk Home → Add Data → Monitor as shown in the below image −
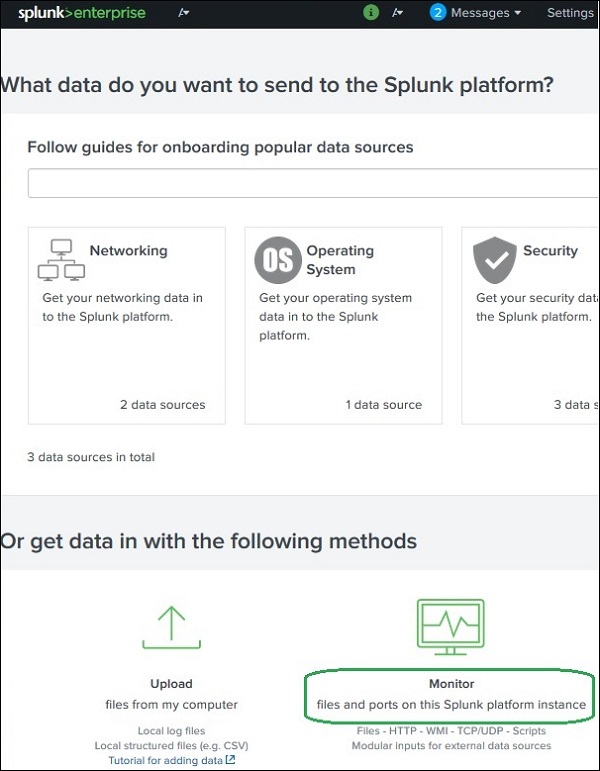
On clicking Monitor, it brings up the list of types of files and directory you can use to monitor the files. Next, we choose the file we want to monitor.
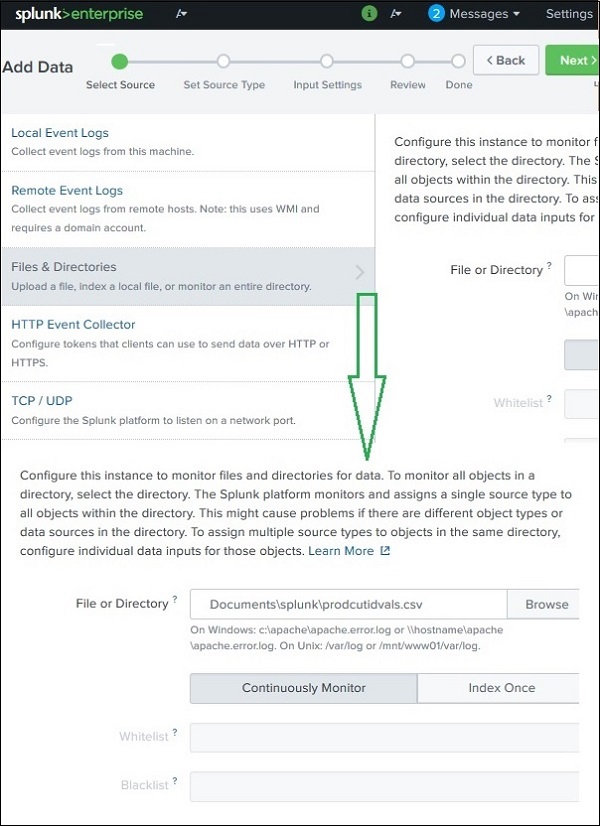
Next, we choose the default values as Splunk is able to parse the file and configure the options for monitoring automatically.
After the final step, we see the below result which captures the events from the file to be monitored.
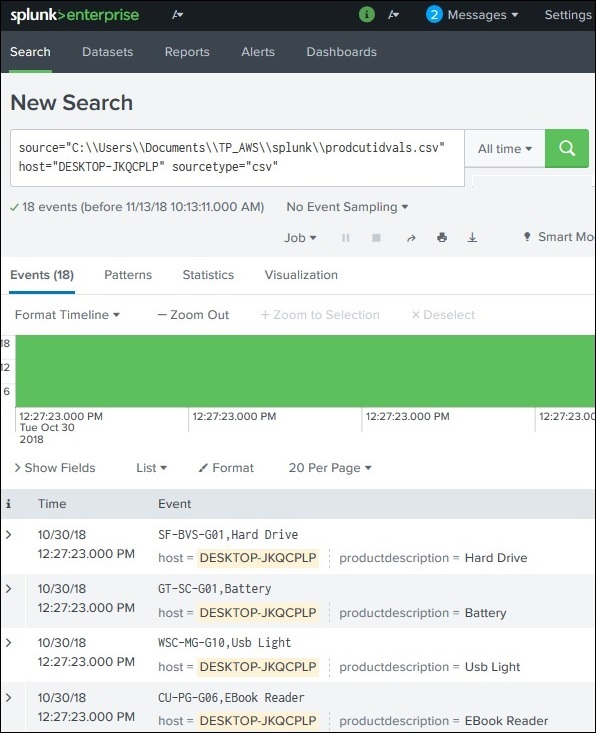
If any of the value in the event changes, then the above result gets updated to show the latest result.
