- SAP BO Analysis - Home
- SAP BO Analysis - Overview
- SAP BO Analysis - User Interface
- Create a Workspace
- SAP BO Analysis - Analyses
- SAP BO Analysis - Crosstabs
- SAP BO Analysis - Charts
- Chart Types & Styles
- Sub Analysis
- SAP BO Analysis - Using Filters
- SAP BO Analysis - Sorting
- Conditional Formatting
- SAP BO Analysis - Calculations
- SAP BO Analysis - Aggregations
- SAP BO Analysis - Hierarchies
- SAP BO Analysis - Sheets
- Sharing Workspaces
- SAP BO Analysis - Export Options
- Connecting to SAP BW
Sub Analysis
In a workspace, data is analyzed using a crosstab in a workspace. Crosstab is added as main analysis and you can also add sub-analysis in the form of a graph or a crosstab. Subanalysis is always linked to the main analysis.
For example, when a crosstab is added as main analysis you can add a chart or graph as sub analysis. This sub-analysis represents the same data as main analysis.
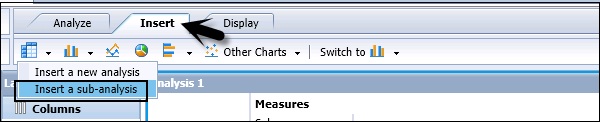
To create a sub-analysis, you have to click the Insert button in the toolbar and select Insert a sub-analysis.
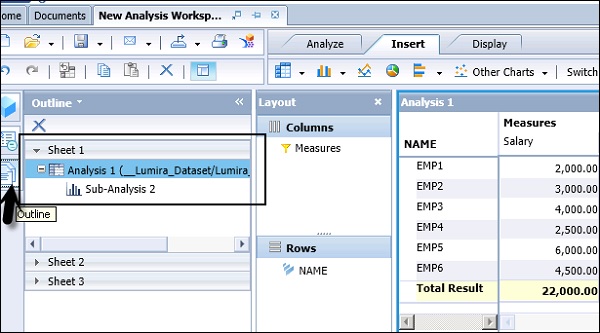
Sub-analysis is used to focus on a certain set of data in analysis. To focus on a subset, you have to select an analysis and click the Outline button on the tool bar.
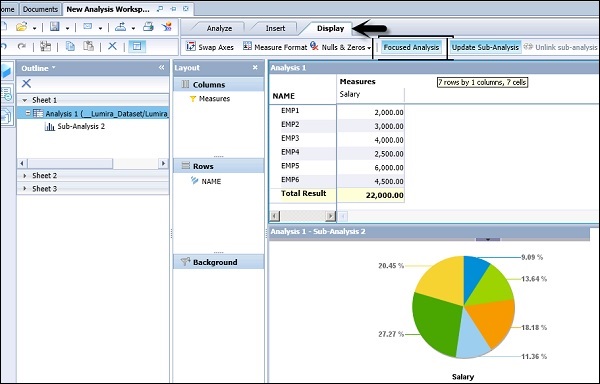
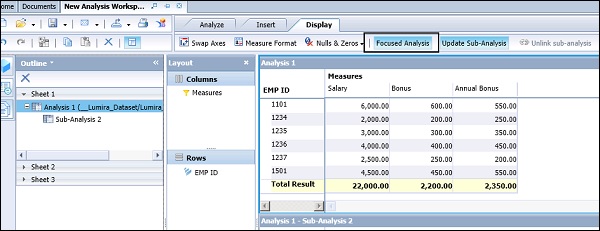
You can see the Analysis and Sub-analysis in the workspace. Select the Analysis and click the Display button on the top right side of the screen. You can see an option of Focused Analysis as shown in the following screenshot.
Linked sub-analyses now display only the selected data in the main analysis. In the main analysis, select the range of members that you want to display in the sub-analysis.
You can click and drag to select a range, or use SHIFT + CLICK to select a range.
Pause and Unlink
Pausing a Sub-analysis
In an analysis, it is also possible to pause a sub-analysis update. Select an Analysis in the Outline Panel on the left side of the screen → Select Display → Click Update Sub-Analysis.
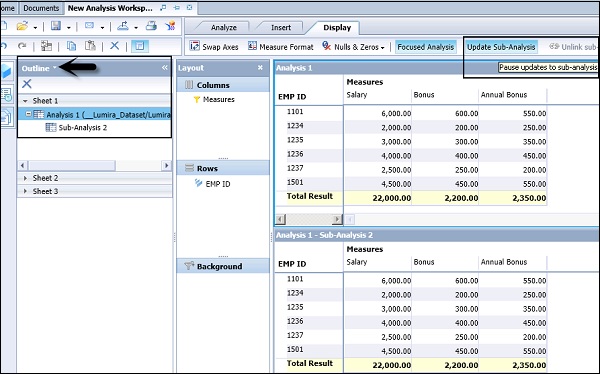
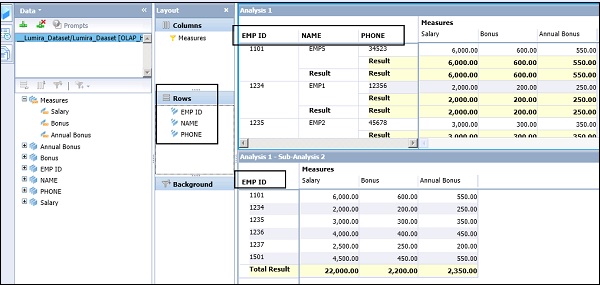
Now once you pause updating sub-analysis, you add dimensions/hierarchies to the main analysis. It will not update sub-analysis as shown in the following screenshot.
Unlinking a Sub-Analysis
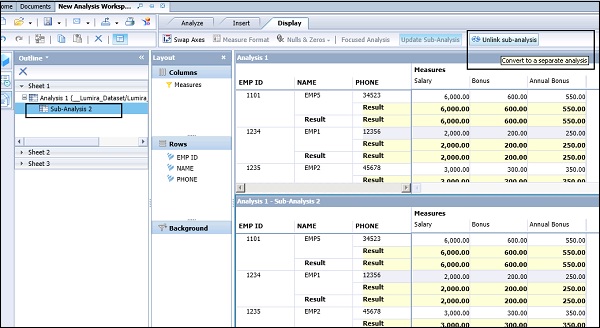
In a workspace in Analysis Edition for OLAP, when you add a crosstab or chart sub-analysis to a sheet that contains an analysis, the new component is linked to the main analysis. Changes that you make to the main analysis (usually a crosstab) are reflected in all subanalyses.
You can unlink the sub-analysis and the sub-analysis is converted to a separate analysis that contains only the focused analysis. To unlink a sub-analysis, select the sub-analysis in the Outline panel → Display tab → Unlink Sub-Analysis.