- SAP BO Analysis - Home
- SAP BO Analysis - Overview
- SAP BO Analysis - User Interface
- Create a Workspace
- SAP BO Analysis - Analyses
- SAP BO Analysis - Crosstabs
- SAP BO Analysis - Charts
- Chart Types & Styles
- Sub Analysis
- SAP BO Analysis - Using Filters
- SAP BO Analysis - Sorting
- Conditional Formatting
- SAP BO Analysis - Calculations
- SAP BO Analysis - Aggregations
- SAP BO Analysis - Hierarchies
- SAP BO Analysis - Sheets
- Sharing Workspaces
- SAP BO Analysis - Export Options
- Connecting to SAP BW
SAP BO Analysis - Crosstabs
In Analysis edition for OLAP, data is analyzed in the form of a crosstab. A Crosstab is a grid table similar to the spreadsheet. You have 3 axes for a Crosstab −
Row Axis − This shows dimensions or hierarchical values in OLAP data source.
Column Axis − This shows column data.
Background Filter − This is used to apply filters on the background value.
Adding a Crosstab
You can add a crosstab by dragging it from the available chart type or you can add a crosstab by clicking the crosstab button in the tool bar.
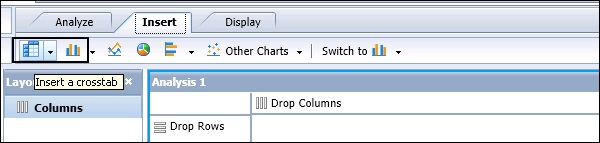
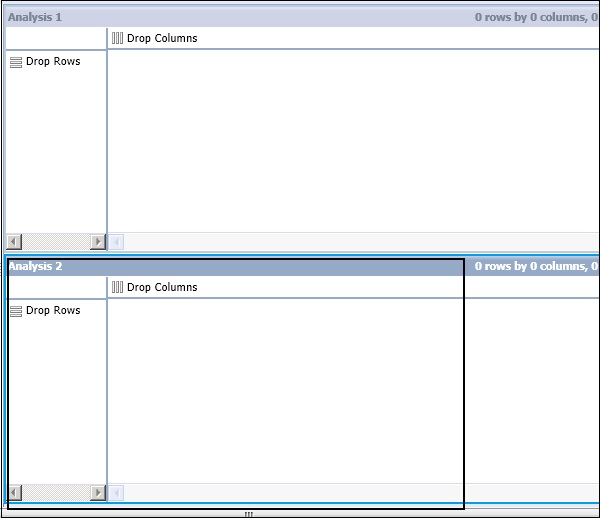
This adds the component to the right of an existing window or below the existing component. To show the data in the crosstab, you have to add a data source.
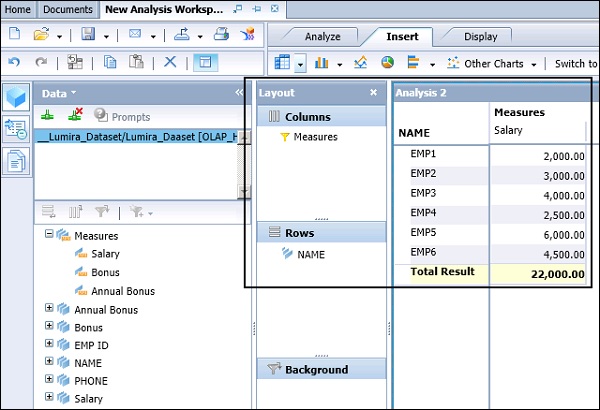
In a workspace, an empty crosstab is placed. To add the data, you add dimensions and hierarchies from the metadata explorer to the crosstab.
When you place one measure on the crosstab, the data is shown in the crosstab and you can then proceed to perform the analysis by adding different features available in the tool.
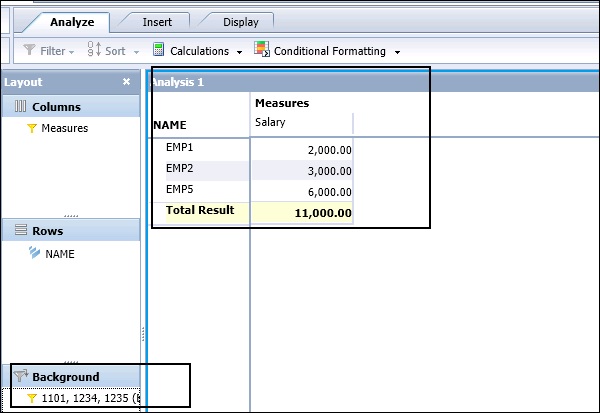
When you drag any of the dimension or hierarchy to the Background Filter, you will be prompted to select the filter values.
You can enter the Individual selection or range selection, and selective values are reflected in Crosstab.
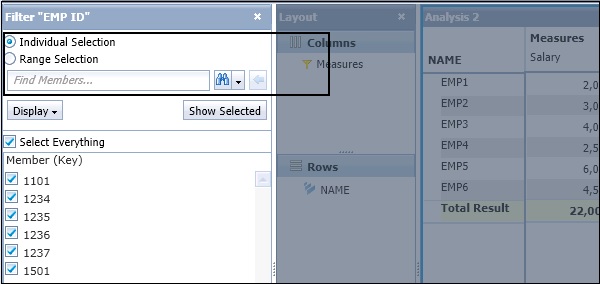
When the filters are applied, the values in the crosstab changes as per the background filter condition. In this example, we have selected the background filter based on Employee #, and values are presented in the crosstab.