- SAP BO Analysis - Home
- SAP BO Analysis - Overview
- SAP BO Analysis - User Interface
- Create a Workspace
- SAP BO Analysis - Analyses
- SAP BO Analysis - Crosstabs
- SAP BO Analysis - Charts
- Chart Types & Styles
- Sub Analysis
- SAP BO Analysis - Using Filters
- SAP BO Analysis - Sorting
- Conditional Formatting
- SAP BO Analysis - Calculations
- SAP BO Analysis - Aggregations
- SAP BO Analysis - Hierarchies
- SAP BO Analysis - Sheets
- Sharing Workspaces
- SAP BO Analysis - Export Options
- Connecting to SAP BW
SAP BO Analysis - Create a Workspace
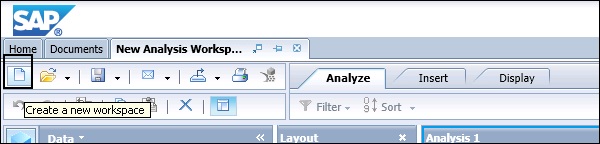
To create a new workspace, you have to click the New button - Create a new workspace.
When you click the New button, you will be prompted to select a data source. You can select from the dropdown list to view all the connections or the connections pointing to Cube/InfoProvider or to Query/Query View to connect to BW OLAP source.
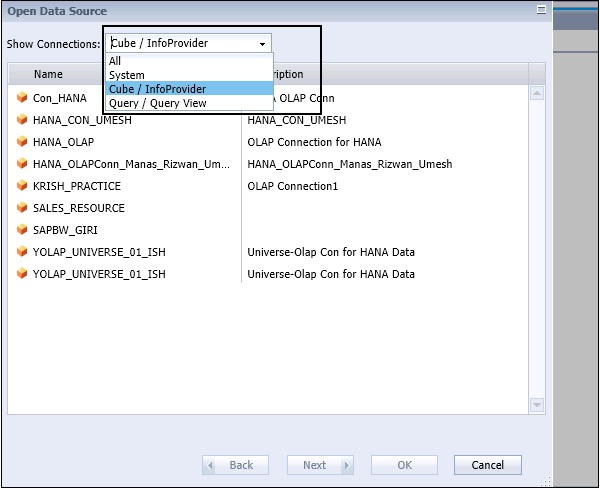
When you select All from the dropdown list, you can see −
- OLAP Connections
- Cube/InfoProvider
- Query/QueryView
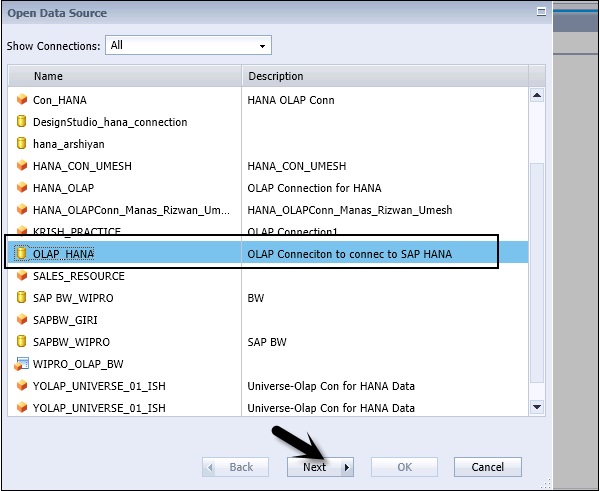
Click the Next button and you will see a list of all the Modeling Views/InfoCubes in the source system that are pointed using this OLAP connection.
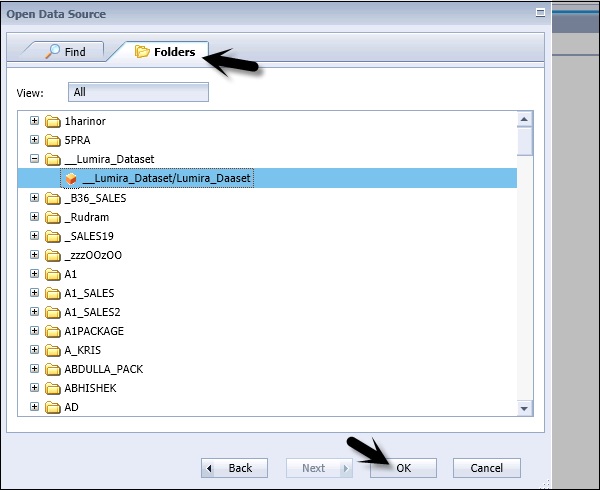
Navigate to Folders tab at the top. You can also perform a search with the name of InfoCube/Modeling View in the source system.
Select InfoCube from the source system and click the OK button.
When you click the OK button, all the measures and dimension values will be added to metadata explorer under the new workspace. You can see the name of InfoCube/Modeling View under Data tab in the Task panel.
You can drag different measures and dimension values to the Layout panel to create a Crosstab and Chart in the Analysis pane.
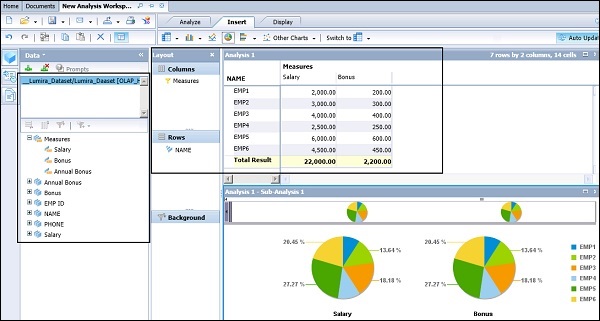
Adding Chart to WS
To add a chart to workspace, you have to navigate to the Insert tab at the top. You have different chart options under Insert. When you have multiple analysis on the sheet, each chart points to a specific analysis in the workspace.
Adding Chart
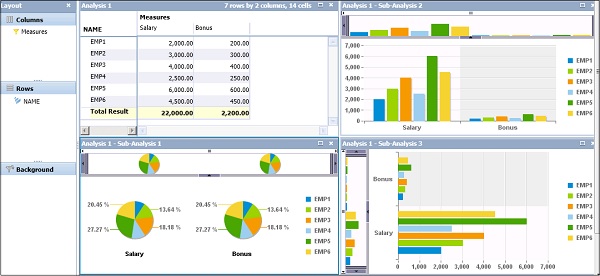
In the analysis window, you have to select the component that you want the chart to be linked to → Navigate to Insert tab and select the Chart from the available charts.
This will add the chart as a sub-analysis, linked to the component that you selected. The added chart is placed below or to the right of the existing components on the sheet.
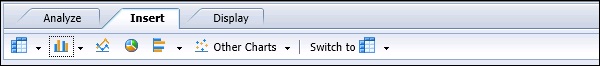
Following chart types are available under the Insert tab in the tool −
- Column Chart Family
- Multiline Chart
- Multi Pie Chart
- Bar Chart
- Other Chart
Adding Crosstab to WS
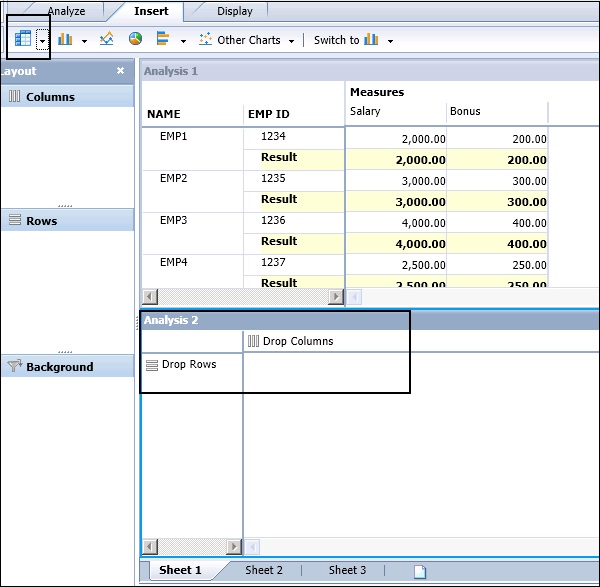
In Analysis Edition for OLAP, you can add a crosstab as Analysis or Sub-analysis. To add a crosstab as sub-analysis, navigate to the Insert tab at the top of the screen.
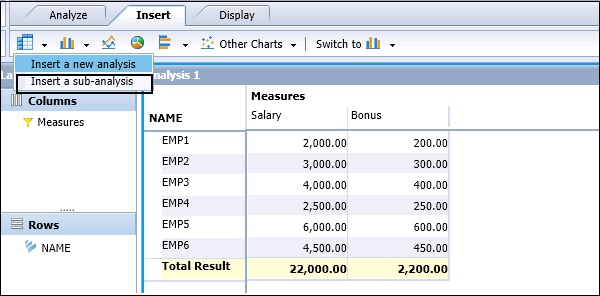
This adds a crosstab as a sub-analysis, linked to the component that you selected. The crosstab is added to the right or below an existing component.
When you add it as sub-analysis, it is based on the existing object in the workspace. When you add it as a new analysis, it adds a blank crosstab below or right of an existing object.
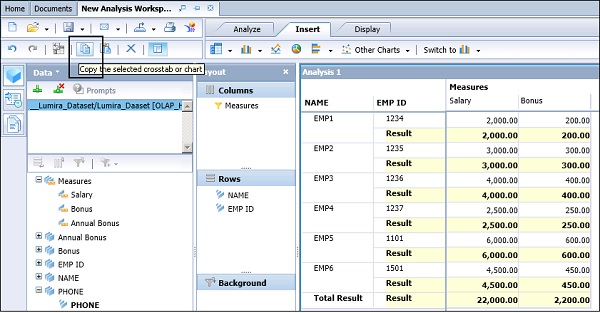
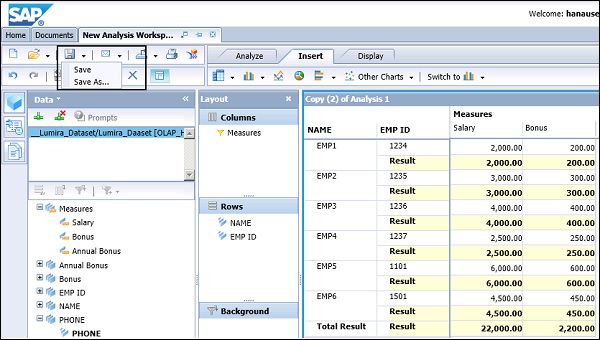
How to Copy an Existing Crosstab or Chart?
It is also possible to copy an existing crosstab or chart. To copy an object, you have to select the object by clicking the Analysis panel. Later, click the Copy button at the top.
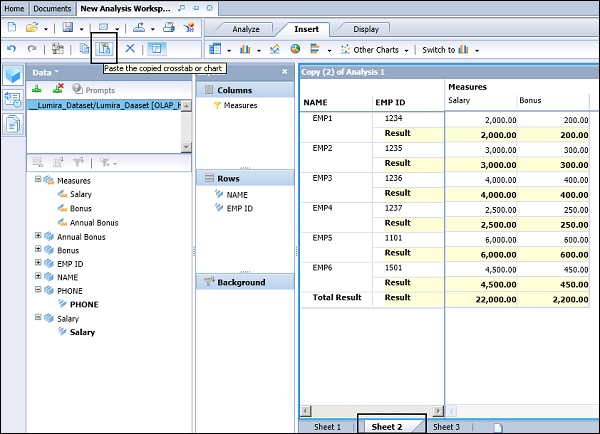
When the object is copied, you can paste this to a new sheet. To paste the object, you can use the paste button at the top of the screen. You can also copy the object on the right or below an existing object.
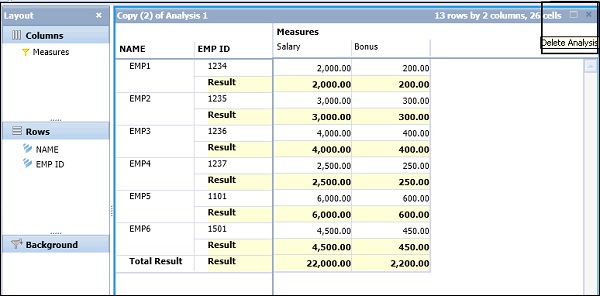
If you want to delete the component, you can click the cross button on the top right corner of the object.
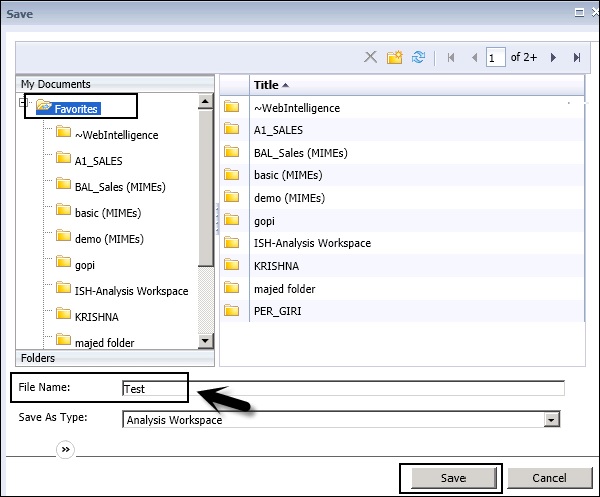
Saving a Workspace
You can also save the workspace to BI platform repository. You can choose to save your changes to the existing workspace, or to save the modified workspace as a new workspace in the repository.
In the next window, you have to select the folder where you want to save the Workspace. Enter the name of the Workspace and click the Save button.
Note − In Analysis Edition for OLAP, if a workspace is idle for several minutes, a copy of the workspace is automatically saved to your Favorites folder before the session is terminated.
When the session is returned before it is terminated, the auto-save cycle is reset, and the workspace is auto-saved again the next time your workspace becomes idle for several minutes.