- SAP BO Analysis - Home
- SAP BO Analysis - Overview
- SAP BO Analysis - User Interface
- Create a Workspace
- SAP BO Analysis - Analyses
- SAP BO Analysis - Crosstabs
- SAP BO Analysis - Charts
- Chart Types & Styles
- Sub Analysis
- SAP BO Analysis - Using Filters
- SAP BO Analysis - Sorting
- Conditional Formatting
- SAP BO Analysis - Calculations
- SAP BO Analysis - Aggregations
- SAP BO Analysis - Hierarchies
- SAP BO Analysis - Sheets
- Sharing Workspaces
- SAP BO Analysis - Export Options
- Connecting to SAP BW
SAP BO Analysis - Aggregations
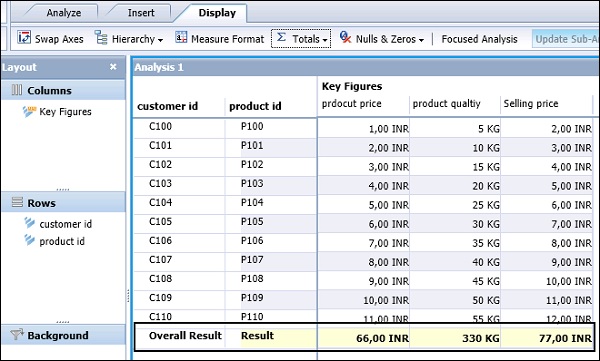
You can perform totals in the crosstab rows and columns. When an aggregation is applied, default aggregation is Sum. You can also change default aggregation as per requirement. In a workspace, in Analysis Edition for OLAP, following aggregations are supported −
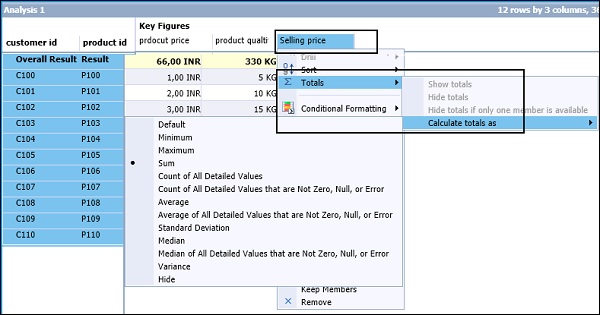
- Default
- Minimum
- Maximum
- Sum
- Count
- Average
- Median
To display totals and subtotals, select a Crosstab in an Analysis and navigate to Display tab → Select Totals or you can also select a column in THE Crosstab on which you want to apply an aggregation.
You can also change the aggregation type by selecting Calculate Total As option.
To set up the position of Totals, select the Crosstab and click the Totals tab under Display. You have an option to select the position of totals in your analysis.
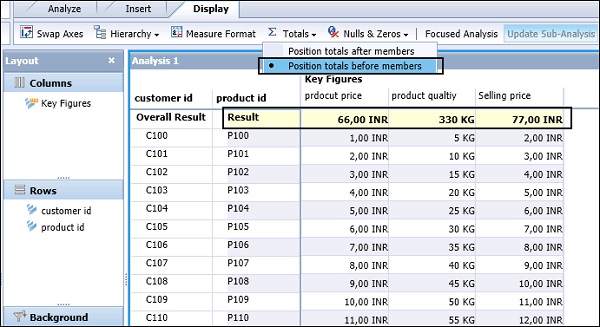
You can also position the totals after members from the dropdown list.