- SAP BO Analysis - Home
- SAP BO Analysis - Overview
- SAP BO Analysis - User Interface
- Create a Workspace
- SAP BO Analysis - Analyses
- SAP BO Analysis - Crosstabs
- SAP BO Analysis - Charts
- Chart Types & Styles
- Sub Analysis
- SAP BO Analysis - Using Filters
- SAP BO Analysis - Sorting
- Conditional Formatting
- SAP BO Analysis - Calculations
- SAP BO Analysis - Aggregations
- SAP BO Analysis - Hierarchies
- SAP BO Analysis - Sheets
- Sharing Workspaces
- SAP BO Analysis - Export Options
- Connecting to SAP BW
SAP BO Analysis - Chart Types & Styles
In Analysis Edition for OLAP, you have the following chart types −
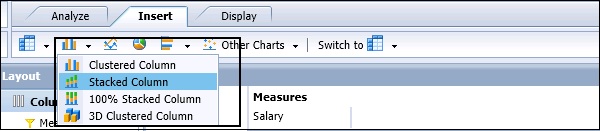
Column Charts
Following charts are available under Column charts −
- Clustered Column
- Stacked Column
- 100% Stacked Column
- 3D Clustered Column
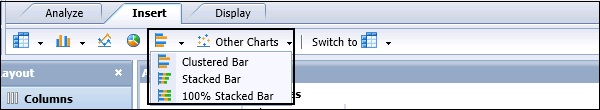
Bar Charts
Following charts are available under Bar charts −
- Clustered Bar
- Stacked Bar
- 100% Stacked Bar
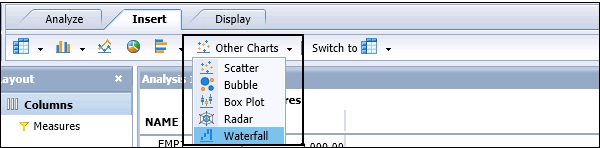
Other Charts
Following charts are available under other charts −
- Scatter
- Bubble
- Box Plot
- Radar
- Waterfall
Some other types of charts include Pie Charts and Line Charts.
Displaying Totals
You can also show totals in the chart. Go to Chart Properties → Select Show Totals checkbox and click Apply.
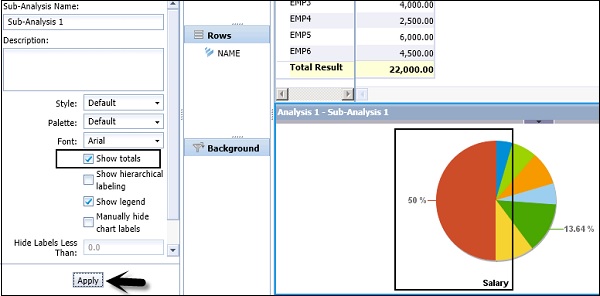
You can also select different chart properties −
- Show Hierarchical Labeling
- Show Legend
- Show Totals
- Manual Hide Chart Labels
- Show Actual Values
Using show actual values, you can print the actual values on the chart instead of percentage value.
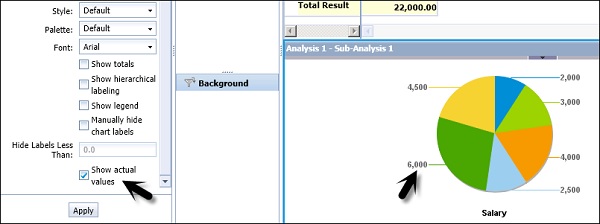
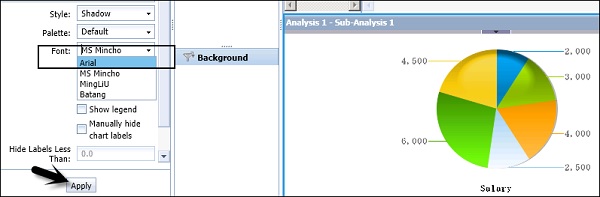
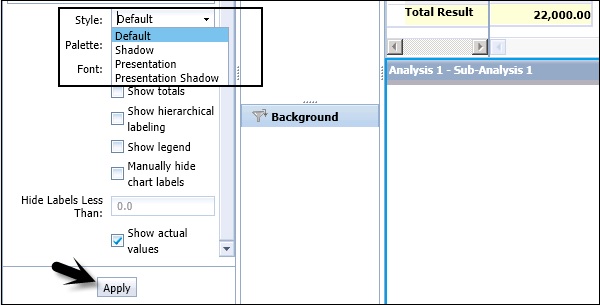
Chart Styles
You can select different predefined chart styles to display. To change the chart style, navigate to Properties → Style.
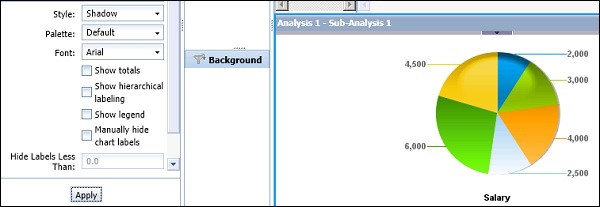
You can also select different font styles for your chart. By default, Font type is Arial. You can change it by selecting different font types from the dropdown list.