- SAP BO Analysis - Home
- SAP BO Analysis - Overview
- SAP BO Analysis - User Interface
- Create a Workspace
- SAP BO Analysis - Analyses
- SAP BO Analysis - Crosstabs
- SAP BO Analysis - Charts
- Chart Types & Styles
- Sub Analysis
- SAP BO Analysis - Using Filters
- SAP BO Analysis - Sorting
- Conditional Formatting
- SAP BO Analysis - Calculations
- SAP BO Analysis - Aggregations
- SAP BO Analysis - Hierarchies
- SAP BO Analysis - Sheets
- Sharing Workspaces
- SAP BO Analysis - Export Options
- Connecting to SAP BW
SAP BO Analysis - Overview
Analysis edition for OLAP is a BI reporting tool using which you can connect to OLAP data sources. It helps business managers in decision making, and to analyze business data. You create a new workspace, then add charts and crosstab objects and OLAP data sources to get the data into these objects.
In Analysis edition for OLAP, you can connect to multiple data providers simultaneously. For example, you can have a workspace where data comes from SAP BW cube and also from Microsoft Analysis Cube.
This tool can be accessed via BI Launchpad in a web browser using the following link −
http://localhost:8080/BOE/BI
In the above link, localhost represents the Name of BI server. When you have BI server on the same system on which you are trying to access BI Launchpad, you can use the local host in the URL, otherwise you have to mention the name of BI server to open BI Launchpad.
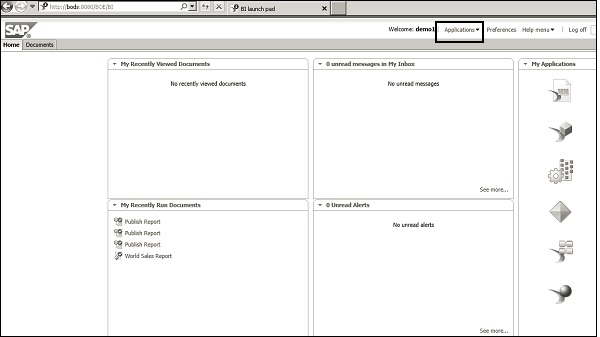
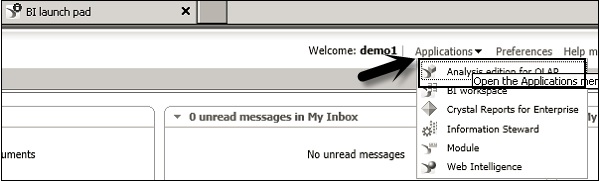
To open the application, navigate to Applications dropdown at the top of the screen. You can see Analysis Edition for OLAP tool in the dropdown list.
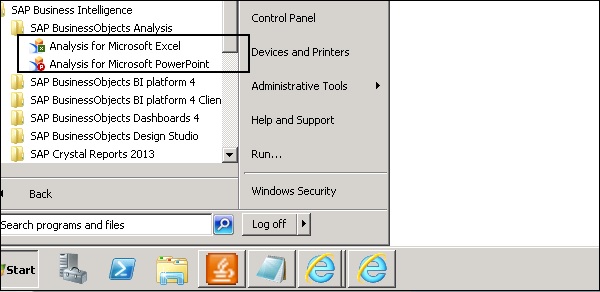
You should have tool installed on SAP BusinessObjects server and a connection from the local system to BI platform. You can also access SAP BO Analysis for Microsoft Office, which integrates Analysis with Microsoft Excel and PowerPoint.
All the connections and Analysis workspaces are managed in Central Management Console (CMC). You can distribute Analysis workspace to large number of users over the web.
What is an OLAP Data Source?
A relational data source contains data in one format and to meet the business requirements, you need to create a multidimensional product. OLAP data represents the hierarchical aggregations of the individual transactions. Aggregated data can be analyzed much faster than relational data.
OLAP data source also allows hierarchy of data where you can drill to different data levels. OLAP data model is also called a data cube.
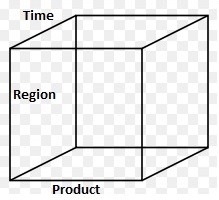
Using a data cube, you can analyze the data in different ways to meet different business requirements. In the above cube, you can analyze −
How are products selling at different times of year? (Product by Time)
How are products selling in each region? (Product by Region)
How are products selling in each region at different times? (Product by Region and Time)