- SAP BO Analysis - Home
- SAP BO Analysis - Overview
- SAP BO Analysis - User Interface
- Create a Workspace
- SAP BO Analysis - Analyses
- SAP BO Analysis - Crosstabs
- SAP BO Analysis - Charts
- Chart Types & Styles
- Sub Analysis
- SAP BO Analysis - Using Filters
- SAP BO Analysis - Sorting
- Conditional Formatting
- SAP BO Analysis - Calculations
- SAP BO Analysis - Aggregations
- SAP BO Analysis - Hierarchies
- SAP BO Analysis - Sheets
- Sharing Workspaces
- SAP BO Analysis - Export Options
- Connecting to SAP BW
SAP BO Analysis - Using Filters
Filters are used to see the data which is relevant only to your analysis. You can apply filters in the crosstab and in charts too. Filters can be applied manually by selecting the member from the list or you can define a filter condition.
Different filter types are available in a workspace. You can filter the analysis based on the measure values or it can be applied to certain dimensions/hierarchies.
Note − Filter based on measures are applied only to SAP BW data source and the data should be unformatted.
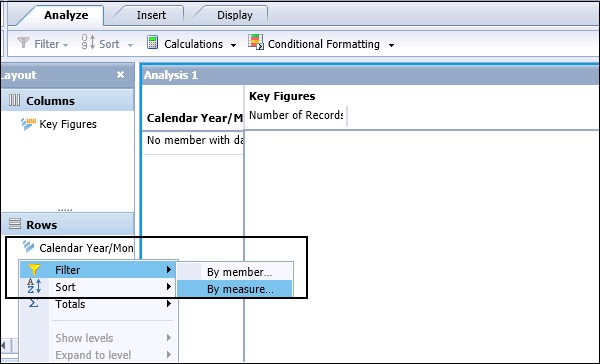
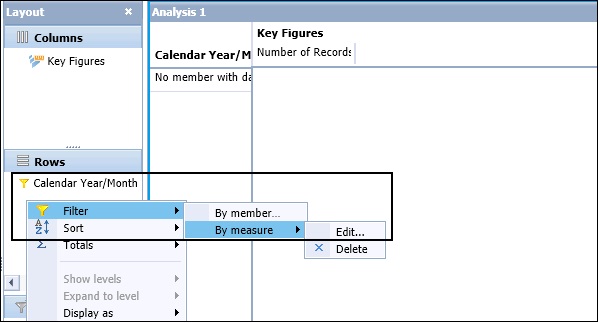
In the Layout panel, right-click on the hierarchy that you want to filter. Navigate to Filter option → Select By Measure option.
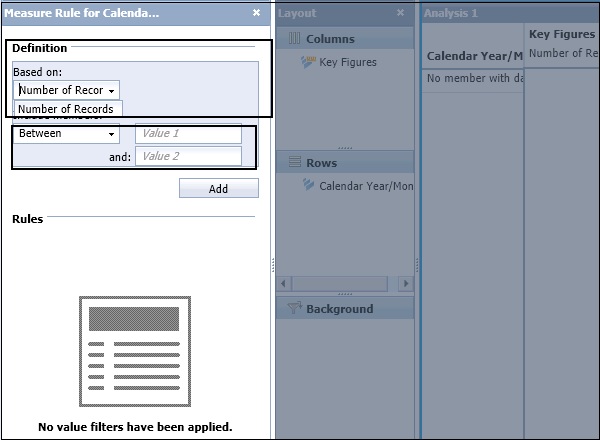
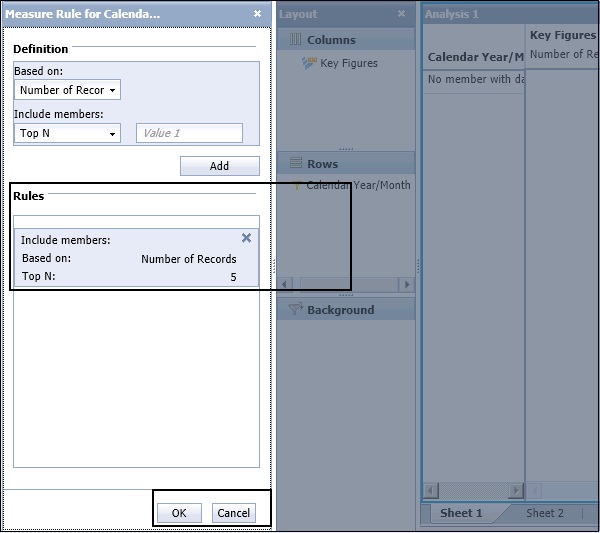
In the Setting area on the filter, select the target level for the filter. In Definition area, select a measure based on the list. In Filter Properties, you can see the list of measure values in the dropdown list.
Next, define a filter type by entering a condition and an operand value. Different filter types are available in Filter condition. If you want to select Top 5 values, you can select from the dropdown list. Search Top N and enter the Operand value 5 and click on Add.
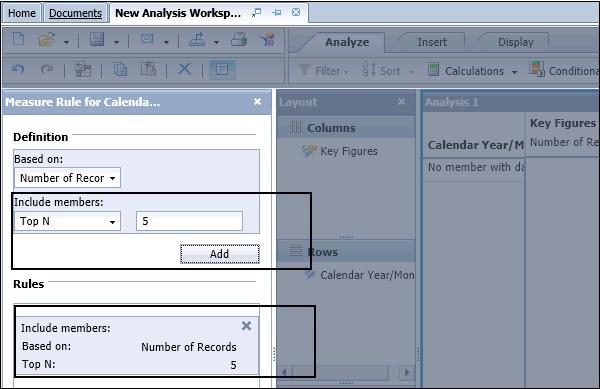
Click the OK button at the bottom to apply filter.
How to Edit an Existing Filter?
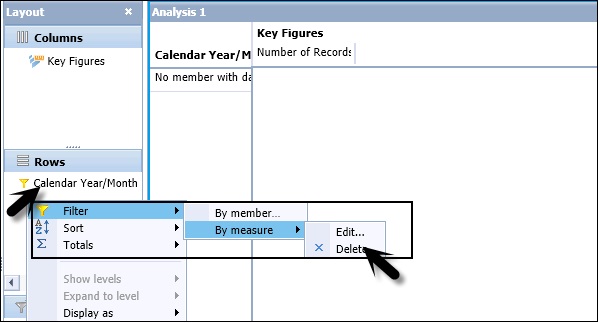
To edit an existing filter, navigate to Layout panel → Select hierarchy and right-click → Filter → By Measure → Edit.
The existing filter rules are displayed in the Filter panel. Add and delete the rules to define your modified filter. You cannot directly edit an existing rule to change a rule, delete it, and then add the modified rule → Click OK to apply the modified filter to the hierarchy.
How to Delete Filters in an Analysis?
You can manually remove a filter or it can be automatically removed. Whenever you replace hierarchies on the row or column axes, filters are automatically removed from the analysis.
To delete a filter manually, in Layout panel right-click hierarchy → Filter → By Measure → Delete.
Filter Types
You can apply different types of filters in an Analysis.
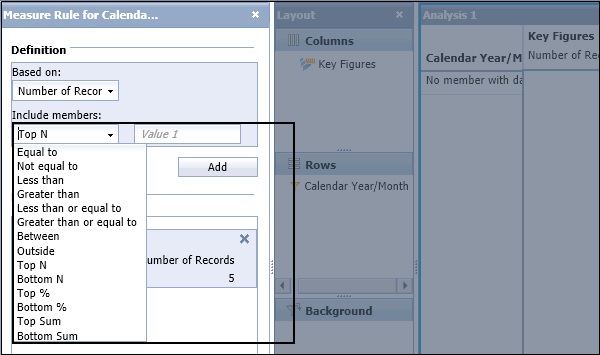
| Top N | Displays the top N members for the selected level, per parent.(Available for SAP BW flat lists, but not for SAP BW hierarchies.) |
| Top % | Displays the top contributors to N percent of the parent for the selected level.(Available for SAP BW flat lists, but not for the SAP BW hierarchies.) |
| Top Sum N | Displays the top members whose cumulative sum is greater than or equal to N. (Available for SAO BW flat lists, but not for SAP BW hierarchies.) |
| Bottom N | Displays the bottom N members for the selected level, per parent. (Available for SAP BW flat lists, but not for SAP BW hierarchies.) |
| Bottom % | Displays the bottom contributors to N percent of the parent for the selected level. (Available for SAP BW flat lists, but not for SAP BW hierarchies.) |
| Bottom Sum N | Displays the bottom members whose cumulative sum is greater than or equal to N. (Available for SAP BW flat lists, but not for SAP BW hierarchies.) |
| Greater than |
|
| Outside |
|
| Between |
|
Background Filters
In an Analysis, you can also narrow the search by applying filters in hierarchy on the crosstab and these filters are called Background filters.
Let us say you have data related to three hierarchies in your InfoCube - Product, Market, and Year. Now you want to see the data related to year 2015 for all products so you can add Year hierarchy to Background filter. This will show other two hierarchies on the Crosstab axis.
In Background filters, you can add a single member or multiple members. Background filters are also known as Slice.
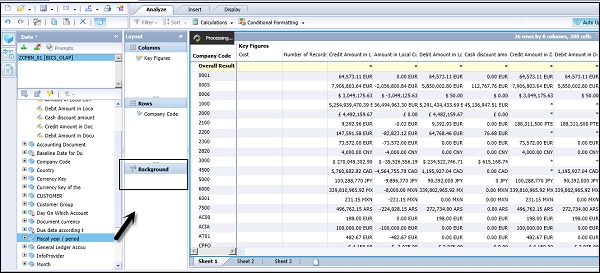
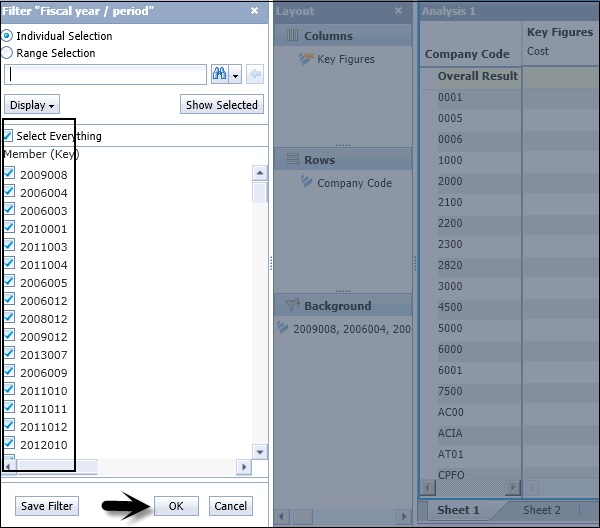
Once you add a hierarchy, double-click the hierarchy or dimension in the Background filter area and this will open the "Filter" panel.
In the Filter panel, you can select one or more members → Click OK.