- SAP BO Analysis - Home
- SAP BO Analysis - Overview
- SAP BO Analysis - User Interface
- Create a Workspace
- SAP BO Analysis - Analyses
- SAP BO Analysis - Crosstabs
- SAP BO Analysis - Charts
- Chart Types & Styles
- Sub Analysis
- SAP BO Analysis - Using Filters
- SAP BO Analysis - Sorting
- Conditional Formatting
- SAP BO Analysis - Calculations
- SAP BO Analysis - Aggregations
- SAP BO Analysis - Hierarchies
- SAP BO Analysis - Sheets
- Sharing Workspaces
- SAP BO Analysis - Export Options
- Connecting to SAP BW
SAP BO Analysis - Analyses
In Analysis Edition for OLAP, you can connect to a data source and further analyze the data using features in the tool. You can add a crosstab and charts as well as drag the objects from the data source to analyze the data.
Each analysis workspace contains multiple sheets; it is independent from each other. Analysis stores the structure of data and chart, and the crosstab is used to display the data in the workspace. An Analysis can be displayed using different types of components - Charts or Crosstabs.
When an analysis contains a crosstab and chart they are considered as linked with each other. When the data in crosstab is updated, it also updates the data in the chart automatically.
Defining a New Analysis
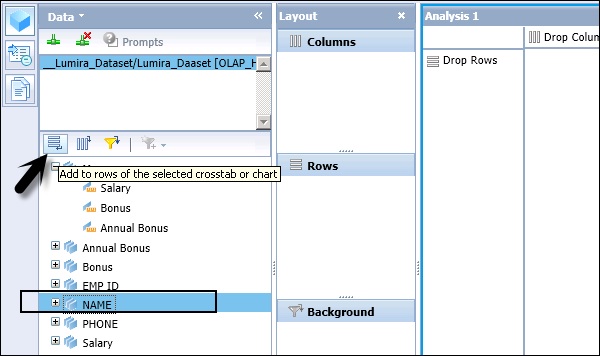
You can add a new analysis by adding a hierarchy or any level of hierarchy. To create a new analysis, drag the hierarchy from the data panel to the layout panel.
If you want to add the selected hierarchy to the crosstab's rows, you can drag it to the "Rows" area.
If you want to add the selected hierarchy to the crosstab's columns, drag it to the "Columns" area.
If you want to add the hierarchy to the crosstab's background filter, drag it to the "Background" filter area.
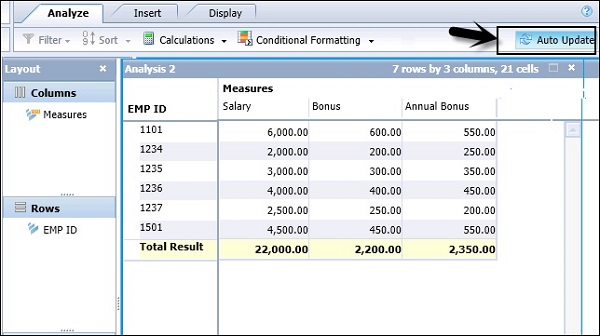
On the top right corner of the analysis, you have an auto update option. When automatic update is on, it updates the crosstab and chart components with each hierarchy to the Layout panel, causing short delays.
You can also turn off automatic update by clicking the Auto Update button.
Few Points to be Considered About Analysis
You cant add members from the same hierarchy to two axes.
When you are using SAP BW as the data source, you cant use hierarchies of the same dimension in the same analysis.
When a data source is selected in a new workspace, an analysis is automatically created. You can add an analysis to the workspace in the following ways −
When you add a crosstab to the sheet, by default, adding a new crosstab creates a new analysis. The new analysis is connected to the data source that is currently selected on the Data panel.
Add a new data source to the workspace, and then add a crosstab to the sheet. The new analysis is connected to the new data source.
Add another crosstab or chart component to the sheet as a sub-analysis. The subanalysis is linked to the original analysis, but you can unlink the new component from the original analysis, creating a separate analysis.
Adding Analysis to a Worksheet
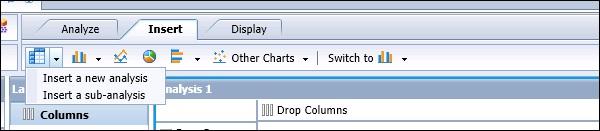
To add an analysis, click the Insert button in the tool bar and then click Insert Crosstab button to add an analysis to the current sheet. When you add a new analysis, it is connected to the currently selected data source and displayed in the outline panel.
Note − It is also possible to add the crosstab as a sub-analysis, by clicking the arrow beside the Insert Crosstab button.
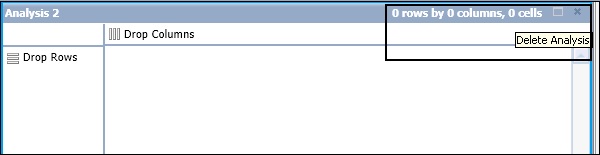
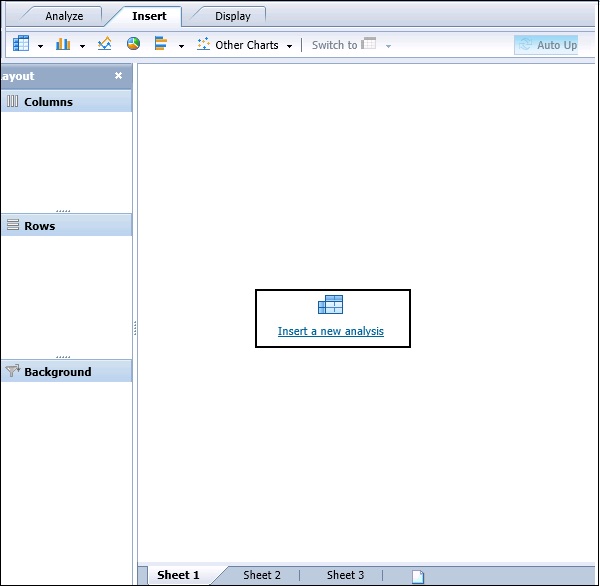
When there is no analysis in the workspace, you get an option to insert one in the outline panel. Once you click on insert a new analysis button, a new analysis is added.
To delete an Analysis, you have to click the delete button on the top right corner of the screen.