- Matplotlib Basics
- Matplotlib - Home
- Matplotlib - Introduction
- Matplotlib - Environment Setup
- Matplotlib - Anaconda distribution
- Matplotlib - Jupyter Notebook
- Matplotlib - Pyplot API
- Matplotlib - Simple Plot
- Matplotlib - Text
- Matplotlib - Images
- Matplotlib - Mathematical Expressions
- Matplotlib - Transforms
- Matplotlib - Ticks and Tick Labels
- Matplotlib - Axis Ranges
- Matplotlib - Axis Scales
- Matplotlib - Axis Ticks
- Matplotlib - Formatting Axes
- Matplotlib - Axes Class
- Matplotlib - Twin Axes
- Matplotlib - Figure Class
- Matplotlib - Multiplots
- Matplotlib - Grids
- Matplotlib - Object-oriented Interface
- Matplotlib - PyLab module
- Matplotlib - Subplots() Function
- Matplotlib - Subplot2grid() Function
- Matplotlib - Anchored Artists
- Matplotlib - Manual Contour
- Matplotlib - Coords Report
- Matplotlib - AGG filter
- Matplotlib - Ribbon Box
- Matplotlib - Fill Spiral
- Matplotlib - Findobj Demo
- Matplotlib - Hyperlinks
- Matplotlib - Image Thumbnail
- Matplotlib - Plotting with Keywords
- Matplotlib - Create Logo
- Matplotlib - Multipage PDF
- Matplotlib - Multiprocessing
- Matplotlib - Print Stdout
- Matplotlib - Compound Path
- Matplotlib - Sankey Class
- Matplotlib - MRI with EEG
- Matplotlib - Stylesheets
- Matplotlib - Background Colors
- Matplotlib - Basemap -->
- Matplotlib Widgets
- Matplotlib - Cursor Widget
- Matplotlib - Annotated Cursor
- Matplotlib - Buttons Widget
- Matplotlib - Check Buttons
- Matplotlib - Lasso Selector
- Matplotlib - Menu Widget
- Matplotlib - Mouse Cursor
- Matplotlib - Multicursor
- Matplotlib - Polygon Selector
- Matplotlib - Radio Buttons
- Matplotlib - RangeSlider
- Matplotlib - Rectangle Selector
- Matplotlib - Ellipse Selector
- Matplotlib - Slider Widget
- Matplotlib - Span Selector
- Matplotlib - Textbox
- Matplotlib Plotting
- Matplotlib - Bar Graphs
- Matplotlib - Histogram
- Matplotlib - Pie Chart
- Matplotlib - Scatter Plot
- Matplotlib - Box Plot
- Matplotlib - Violin Plot
- Matplotlib - Contour Plot
- Matplotlib - 3D Plotting
- Matplotlib - 3D Contours
- Matplotlib - 3D Wireframe Plot
- Matplotlib - 3D Surface Plot
- Matplotlib - Quiver Plot
- Matplotlib Useful Resources
- Matplotlib - Quick Guide
- Matplotlib - Useful Resources
- Matplotlib - Discussion
Matplotlib - Span Selector
Introduction
Matplotlib's SpanSelector is a widget that provides an interactive way to select a range along a specific axis in a plot. It is a valuable tool for interactive range selection in plots. It allows users to define a span i.e. a selected interval by dragging the mouse across the plot. Its simplicity coupled with the ability to associate custom callback functions, makes it versatile for various data exploration and analysis tasks. Whether analyzing time series data, zooming into specific regions or triggering events based on user selections the SpanSelector enhances the interactive capabilities of Matplotlib plots. Its ease of use and integration with existing Matplotlib plots make it a valuable component for creating dynamic and user-friendly data visualizations.
Key Features of SpanSelector
The following are the key features of the Span Selector of the Matplotlib library.
Interactive Range Selection − The primary purpose of the SpanSelector is to enable users to interactively select a range along the x-axis or y-axis of a plot. This is useful for focusing on specific regions of interest in the data.
Dynamic Updates − As users drag the mouse to define the span the selected range dynamically updates in real-time. This provides continuous feedback by allowing users to precisely choose the desired interval.
Integration with Callbacks − The SpanSelector can be associated with callback functions that are triggered when the span is selected. This allows developers to perform custom actions based on the selected range.
Customization Options − The appearance and behavior of the SpanSelector can be customized. Users can choose between horizontal and vertical spans by specifying the color and alpha of the span, and set additional parameters.
Implementation of SpanSelector
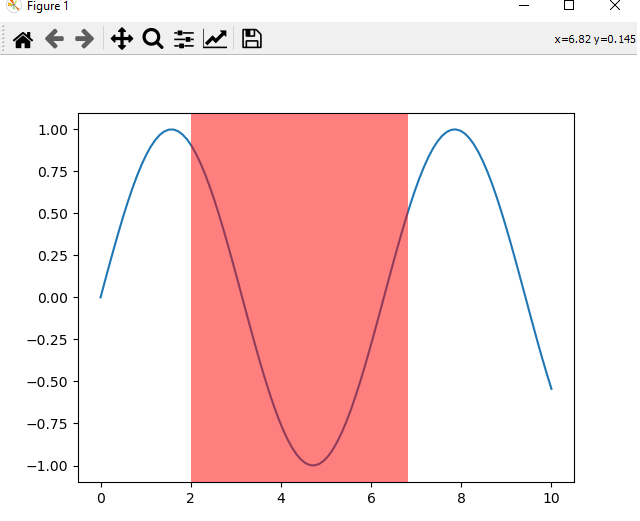
The following is an example of how to implement a basic SpanSelector in Matplotlib. In this example we used few functions their explaination is given below.
onselect − This function is called when a span is selected. It receives the minimum (xmin) and maximum (xmax) x-values of the selected span.
SpanSelector − This class from matplotlib.widgets creates the interactive span selector. It is associated with the axes (ax), the callback function (onselect) and additional parameters such as the selection direction i.e. horizontal or vertical and appearance properties of the selected span.
rectprops − This parameter allows customization of the appearance of the selected span. Here in this example the span is set to be a red rectangle with 50% transparency
Example
import matplotlib.pyplot as plt
from matplotlib.widgets import SpanSelector
import numpy as np
# Function to be triggered when a span is selected
def onselect(xmin, xmax):
   print(f"Selected Span: xmin={xmin}, xmax={xmax}")
# Generate example data
x_data = np.linspace(0, 10, 100)
y_data = np.sin(x_data)
# Create a figure and axes
fig, ax = plt.subplots()
# Plot the data
ax.plot(x_data, y_data)
# Create a SpanSelector
span_selector = SpanSelector(ax, onselect, direction='horizontal', useblit=True, props=dict(alpha=0.5, facecolor='red'))
plt.show()
Output
Customized Span Selector
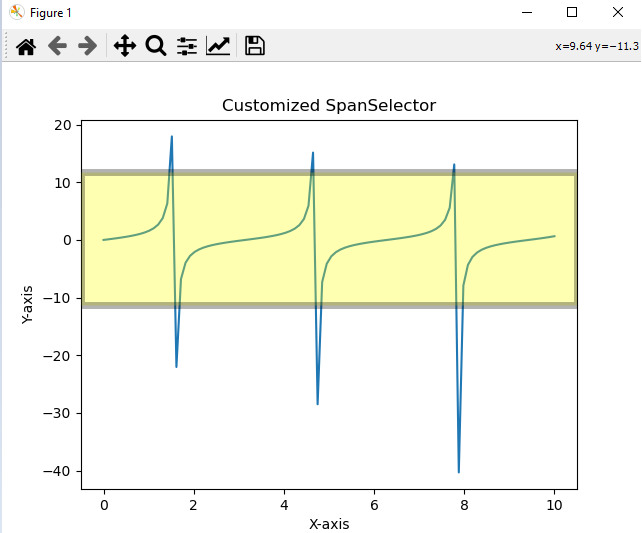
Customizing the appearance of the SpanSelector involves modifying its visual properties such as color, transparency and other styling options. Here's an example of how we can customize the SpanSelector appearance in Matplotlib library.
Example
import matplotlib.pyplot as plt
from matplotlib.widgets import SpanSelector
import numpy as np
# Function to be triggered when a span is selected
def onselect(xmin, xmax):
   print(f"Selected Span: xmin={xmin}, xmax={xmax}")
# Generate example data
x_data = np.linspace(0, 10, 100)
y_data = np.tan(x_data)
# Create a figure and axes
fig, ax = plt.subplots()
# Plot the data
ax.plot(x_data, y_data)
# Customizing the appearance of the SpanSelector
span_selector = SpanSelector(
   ax,
   onselect,
   direction='vertical',
   useblit=True,
   props=dict(facecolor='yellow', alpha=0.3, edgecolor='black', linewidth=5),
   button=1  # Use the left mouse button for selection
)
# Set axis labels and title
ax.set_xlabel('X-axis')
ax.set_ylabel('Y-axis')
ax.set_title('Customized SpanSelector')
plt.show()
Output
Use Cases and Considerations
The following are the use cases and the considerations of the Span selector of the matplotlib library.
Data Exploration − SpanSelector is valuable for exploring specific intervals within a dataset. Users can dynamically select and analyze different portions of the data.
Zooming In − Instead of zooming the entire plot we can use the SpanSelector to zoom into a particular range for focusing on the details within that interval.
Event Triggering − Callback functions associated with the SpanSelector can perform various actions based on the selected span such as updating other parts of the plot or performing calculations.
Time Series Analysis − For time series data users can use the SpanSelector to select specific time periods for in-depth analysis or visualization.
Customizing Appearance − The appearance of the selected span can be customized such as match the style of the plot or highlight specific areas of interest.
To Continue Learning Please Login