- Matplotlib Basics
- Matplotlib - Home
- Matplotlib - Introduction
- Matplotlib - Environment Setup
- Matplotlib - Anaconda distribution
- Matplotlib - Jupyter Notebook
- Matplotlib - Pyplot API
- Matplotlib - Simple Plot
- Matplotlib - Text
- Matplotlib - Images
- Matplotlib - Mathematical Expressions
- Matplotlib - Transforms
- Matplotlib - Ticks and Tick Labels
- Matplotlib - Axis Ranges
- Matplotlib - Axis Scales
- Matplotlib - Axis Ticks
- Matplotlib - Formatting Axes
- Matplotlib - Axes Class
- Matplotlib - Twin Axes
- Matplotlib - Figure Class
- Matplotlib - Multiplots
- Matplotlib - Grids
- Matplotlib - Object-oriented Interface
- Matplotlib - PyLab module
- Matplotlib - Subplots() Function
- Matplotlib - Subplot2grid() Function
- Matplotlib - Anchored Artists
- Matplotlib - Manual Contour
- Matplotlib - Coords Report
- Matplotlib - AGG filter
- Matplotlib - Ribbon Box
- Matplotlib - Fill Spiral
- Matplotlib - Findobj Demo
- Matplotlib - Hyperlinks
- Matplotlib - Image Thumbnail
- Matplotlib - Plotting with Keywords
- Matplotlib - Create Logo
- Matplotlib - Multipage PDF
- Matplotlib - Multiprocessing
- Matplotlib - Print Stdout
- Matplotlib - Compound Path
- Matplotlib - Sankey Class
- Matplotlib - MRI with EEG
- Matplotlib - Stylesheets
- Matplotlib - Background Colors
- Matplotlib - Basemap -->
- Matplotlib Widgets
- Matplotlib - Cursor Widget
- Matplotlib - Annotated Cursor
- Matplotlib - Buttons Widget
- Matplotlib - Check Buttons
- Matplotlib - Lasso Selector
- Matplotlib - Menu Widget
- Matplotlib - Mouse Cursor
- Matplotlib - Multicursor
- Matplotlib - Polygon Selector
- Matplotlib - Radio Buttons
- Matplotlib - RangeSlider
- Matplotlib - Rectangle Selector
- Matplotlib - Ellipse Selector
- Matplotlib - Slider Widget
- Matplotlib - Span Selector
- Matplotlib - Textbox
- Matplotlib Plotting
- Matplotlib - Bar Graphs
- Matplotlib - Histogram
- Matplotlib - Pie Chart
- Matplotlib - Scatter Plot
- Matplotlib - Box Plot
- Matplotlib - Violin Plot
- Matplotlib - Contour Plot
- Matplotlib - 3D Plotting
- Matplotlib - 3D Contours
- Matplotlib - 3D Wireframe Plot
- Matplotlib - 3D Surface Plot
- Matplotlib - Quiver Plot
- Matplotlib Useful Resources
- Matplotlib - Quick Guide
- Matplotlib - Useful Resources
- Matplotlib - Discussion
Matplotlib - Basemap
What is Basemap?
The Matplotlib Basemap toolkit is an extension to Matplotlib that provides functionality for creating maps and visualizations involving geographical data. It allows users to plot data on various map projections, draw coastlines, countries and other map features . These are used to handle geographic coordinates seamlessly within Matplotlib.
The below are the key features of Matplotlib Basemap.
Map Projections
Basemap supports various map projections by allowing users to visualize data in different coordinate systems like cylindrical, conic or azimuthal projections. Examples are Mercator, Lambert Conformal Conic and Orthographic projections.
Plotting Geographic Data
Basemap allows the plotting of geographical data such as points, lines, or polygons over maps. Users can overlay datasets onto maps and visualize geographic relationships.
Map Elements
Basemap provides functions to add map elements like coastlines, countries, states, rivers and political boundaries by enhancing the visual context of the maps.
Coordinate Transformation
It facilitates seamless conversion between different coordinate systems such as latitude and longitude to map projection coordinates and vice versa.
Installing Basemap
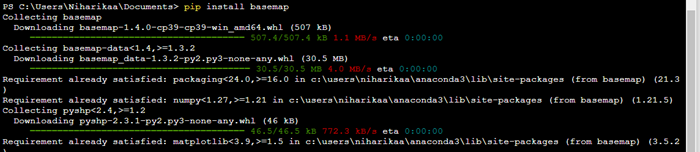
If we want to work with Basemap of matplotlib library we have to install it in our working environment. The below is the code.
Example
pip install basemap
Note − When we are working with Jupyter notebook then we have to install basemap through the anaconda command terminal.
Output
Basic Workflow with Basemap
The below is the basic workflow of the Basemap of the Matplotlib library. Let’s see each of them in detail for better understanding.
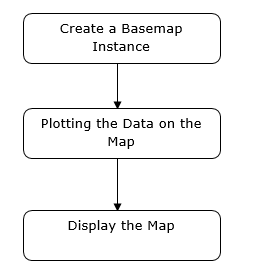
Create a Basemap Instance
Instantiate a Basemap object by specifying the map projection, bounding coordinates and other parameters. To create a Basemap instance using the Basemap toolkit in Matplotlib we can define the map projection and specify the desired map boundaries.
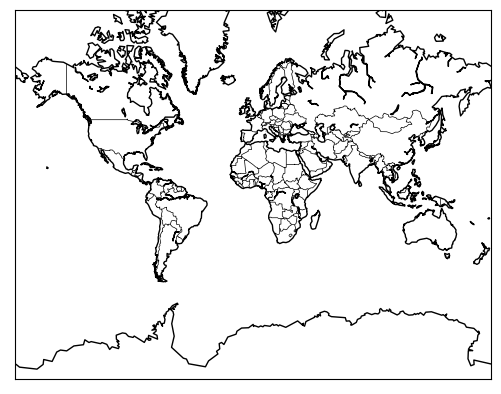
Example
In this example we are generating a basic map with coastlines and country boundaries using the specified Mercator projection and the provided bounding coordinates. We can further customize the map by adding features, plotting data points or using different projections and resolutions based on our requirements.
from mpl_toolkits.basemap import Basemap
import matplotlib.pyplot as plt
# Create a Basemap instance with a specific projection and bounding coordinates
map = Basemap(
   projection='merc', llcrnrlat=-80, urcrnrlat=80,
   llcrnrlon=-180, urcrnrlon=180, resolution='c')

# Draw coastlines and countries
map.drawcoastlines()
map.drawcountries()

# Show the map
plt.show()
Output
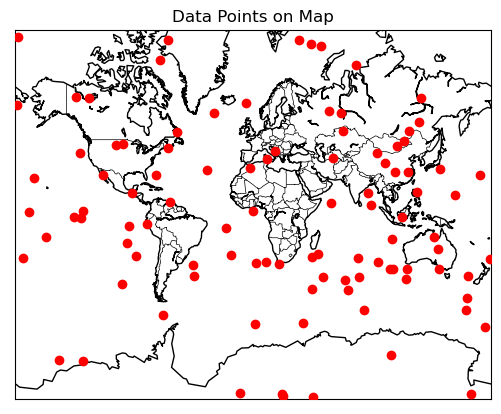
Plot Data on the Map
In this we use the Basemap methods to draw map features, plot data points or visualize geographical datasets.
Example
In this example we are generating random latitude and longitude points and then uses the map() function to project these coordinates onto the Basemap instance. The scatter() method is then used to plot these projected points on the map as red markers.
from mpl_toolkits.basemap import Basemap
import matplotlib.pyplot as plt
import numpy as np

# Create a Basemap instance with a specific projection and bounding coordinates
map = Basemap(
   projection='merc', llcrnrlat=-80, urcrnrlat=80,
   llcrnrlon=-180, urcrnrlon=180, resolution='c')

# Draw coastlines and countries
map.drawcoastlines()
map.drawcountries()

# Generate random data (longitude, latitude) for plotting
num_points = 100
lons = np.random.uniform(low=-180.0, high=180.0, size=num_points)
lats = np.random.uniform(low=-80.0, high=80.0, size=num_points)

# Plot the data points on the map
x, y = map(lons, lats)  # Project the latitudes and longitudes to map coordinates
map.scatter(x, y, marker='o', color='red', zorder=10)  # Plotting the data points

# Show the map with plotted data
plt.title('Data Points on Map')
plt.show()
Output
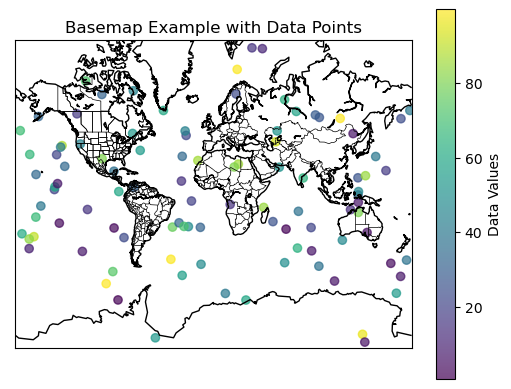
Display the Map
We can use Matplotlib library to show() function to display the final map.
Example
Here's an example demonstrating the usage of Basemap to create a map and plot data points.
from mpl_toolkits.basemap import Basemap
import matplotlib.pyplot as plt
import numpy as np

# Creating a Basemap instance with a specific projection and bounding coordinates
map = Basemap(
   projection='merc', llcrnrlat=-80, urcrnrlat=80,
   llcrnrlon=-180, urcrnrlon=180, resolution='c')

# Drawing coastlines, countries, and states
map.drawcoastlines()
map.drawcountries()
map.drawstates()

# Generating random data for plotting
num_points = 100
lons = np.random.uniform(low=-180.0, high=180.0, size=num_points)
lats = np.random.uniform(low=-80.0, high=80.0, size=num_points)
data_values = np.random.rand(num_points) * 100  # Random values for data

# Plotting data points on the map
x, y = map(lons, lats)  # Projecting latitudes and longitudes to map coordinates
map.scatter(x, y, c=data_values, cmap='viridis', marker='o', alpha=0.7)

# Adding a colorbar to represent the data values
plt.colorbar(label='Data Values')

# Display the map with plotted data
plt.title('Basemap Example with Data Points')
plt.show()
Output
Applications of Matplotlib Basemap
Geospatial Analysis − Analyzing and visualizing geographical data such as climate patterns, population distributions or seismic activities.
Cartography − Creating custom maps for publications, presentations or research purposes.
Data Visualization − Integrating geographical data with other datasets for exploratory data analysis.
Note
Matplotlib Basemap is being phased out in favor of newer geospatial libraries like Cartopy which offer more extensive functionality and better integration with Matplotlib. Cartopy builds on the concepts of Basemap but provides a more modern, flexible and actively developed interface for handling geospatial data within Matplotlib.
To Continue Learning Please Login