- Matplotlib Basics
- Matplotlib - Home
- Matplotlib - Introduction
- Matplotlib - Environment Setup
- Matplotlib - Anaconda distribution
- Matplotlib - Jupyter Notebook
- Matplotlib - Pyplot API
- Matplotlib - Simple Plot
- Matplotlib - Text
- Matplotlib - Images
- Matplotlib - Mathematical Expressions
- Matplotlib - Transforms
- Matplotlib - Ticks and Tick Labels
- Matplotlib - Axis Ranges
- Matplotlib - Axis Scales
- Matplotlib - Axis Ticks
- Matplotlib - Formatting Axes
- Matplotlib - Axes Class
- Matplotlib - Twin Axes
- Matplotlib - Figure Class
- Matplotlib - Multiplots
- Matplotlib - Grids
- Matplotlib - Object-oriented Interface
- Matplotlib - PyLab module
- Matplotlib - Subplots() Function
- Matplotlib - Subplot2grid() Function
- Matplotlib - Anchored Artists
- Matplotlib - Manual Contour
- Matplotlib - Coords Report
- Matplotlib - AGG filter
- Matplotlib - Ribbon Box
- Matplotlib - Fill Spiral
- Matplotlib - Findobj Demo
- Matplotlib - Hyperlinks
- Matplotlib - Image Thumbnail
- Matplotlib - Plotting with Keywords
- Matplotlib - Create Logo
- Matplotlib - Multipage PDF
- Matplotlib - Multiprocessing
- Matplotlib - Print Stdout
- Matplotlib - Compound Path
- Matplotlib - Sankey Class
- Matplotlib - MRI with EEG
- Matplotlib - Stylesheets
- Matplotlib - Background Colors
- Matplotlib - Basemap -->
- Matplotlib Widgets
- Matplotlib - Cursor Widget
- Matplotlib - Annotated Cursor
- Matplotlib - Buttons Widget
- Matplotlib - Check Buttons
- Matplotlib - Lasso Selector
- Matplotlib - Menu Widget
- Matplotlib - Mouse Cursor
- Matplotlib - Multicursor
- Matplotlib - Polygon Selector
- Matplotlib - Radio Buttons
- Matplotlib - RangeSlider
- Matplotlib - Rectangle Selector
- Matplotlib - Ellipse Selector
- Matplotlib - Slider Widget
- Matplotlib - Span Selector
- Matplotlib - Textbox
- Matplotlib Plotting
- Matplotlib - Bar Graphs
- Matplotlib - Histogram
- Matplotlib - Pie Chart
- Matplotlib - Scatter Plot
- Matplotlib - Box Plot
- Matplotlib - Violin Plot
- Matplotlib - Contour Plot
- Matplotlib - 3D Plotting
- Matplotlib - 3D Contours
- Matplotlib - 3D Wireframe Plot
- Matplotlib - 3D Surface Plot
- Matplotlib - Quiver Plot
- Matplotlib Useful Resources
- Matplotlib - Quick Guide
- Matplotlib - Useful Resources
- Matplotlib - Discussion
Matplotlib - Annotated Cursor
What is Annotated Cursor?
An annotated cursor is a feature in data visualization that combines cursor tracking with additional information, annotations or tooltips displayed alongside the cursor position as it moves across the plot. It helps users gain insights into specific data points or regions of interest by providing contextual information.
In the view of Matplotlib or other plotting libraries an annotated cursor typically involves displaying annotations, tooltips or supplementary information at the cursor's location on the plot. This information could include data values, labels or any relevant details associated with the plotted data points.
The annotated cursor enhances the interactive exploration of plots by providing immediate and contextual information about specific data coordinates or regions aiding in data analysis and interpretation.
Implementing an annotated cursor involves using cursor tracking events such as the 'motion_notify_event' in Matplotlib to update annotations or tooltips dynamically based on the cursor's position. This enables users to explore data points interactively and gain deeper insights by accessing additional information relevant to the plotted data.
Annotated Cursor Features
The below are the features of the annotated Cursor of the Matplotlib widgets.
Interactive Cursor
The Annotated cursor is similar to a standard cursor but it enables users to navigate across the plot by displaying coordinate information (x, y values) as the cursor moves over data points.
Annotation Capability
The annotated cursor is alongside used for displaying coordinates and it allows marking or annotating specific data points with text or markers to highlight or provide additional information about those points.
Customization
Customizable properties for both cursor and annotations such as marker style, text content, position, color and other visual attributes.
Annotated Cursor in Matplotlib
Using cursor widgets in Matplotlib involves capturing cursor movements or clicks and executing functions to enhance the plot with annotations or information about specific data points. Let's delve deeper into how cursor widgets can be utilized to create annotated widgets in Matplotlib.
Cursor Widgets in Annotated Widgets
To use the cursor widgets in annotated widgets there are two ways. Let’s see them one by one.
Event Handling
Event handling in annotated cursors involves capturing specific events such as cursor movements or mouse clicks and executing functions to annotate or remove annotations from a plot in Matplotlib. Here is a detailed breakdown of event handling in annotated cursors.
Defining Functions for Event Handling
The below are the functions which has to be defined for Event handling.
annotate_point(event) − This function gets triggered when the cursor hovers over the plot. It retrieves cursor coordinates that finds the nearest data point and annotates it with information (e.g., x and y values).
Removing Annotations on Mouse Click
remove_annotation(event) − This function removes annotations when a mouse click occurs within the plot area.
Handling Events
plt.connect('motion_notify_event', annotate_point) − Connects the cursor movement event to the annotate_point function. When the cursor moves over the plot this function is triggered to annotate the nearest data point.
plt.connect('button_press_event', remove_annotation) − Connects the mouse click event to the remove_annotation function. When a mouse click occurs within the plot this function removes annotations.
Example of Event Handling in Annotated Cursors
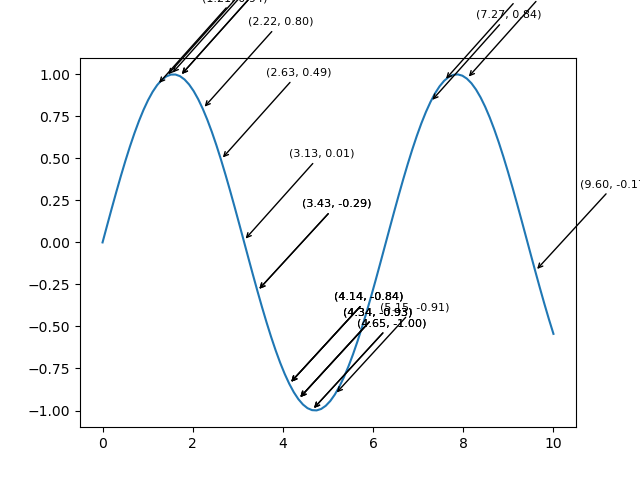
In this example we are demonstrating the event handling in annotated cursors. As the cursor hovers over the plot, annotations are dynamically added to display information about specific data points. Upon clicking within the plot area and the annotations are removed allowing for a clean exploration of the plot without clutter.
Example
import matplotlib.pyplot as plt
import numpy as np
# Generating sample data
x = np.linspace(0, 10, 100)
y = np.sin(x)
# Creating a plot
fig, ax = plt.subplots()
line, = ax.plot(x, y, label='Sine Wave')
# Annotate points on cursor hover
def annotate_point(event):
   if event.inaxes:
      x_cursor, y_cursor = event.xdata, event.ydata
      index = np.argmin(np.abs(x - x_cursor))  # Find nearest index to the cursor position
      ax.annotate(
         f'({x[index]:.2f}, {y[index]:.2f})', xy=(x[index], y[index]),
         xytext=(x[index] + 1, y[index] + 0.5), arrowprops=dict(facecolor='black', arrowstyle='->'),
         fontsize=8, color='black')
   fig.canvas.draw_idle()
# Remove annotations on mouse click
def remove_annotation(event):
   if event.inaxes:
      for annotation in ax.texts:
         annotation.remove()
      fig.canvas.draw_idle()
# Connect events to functions
plt.connect('motion_notify_event', annotate_point)
plt.connect('button_press_event', remove_annotation)
plt.show()
Output
Adding Annotations
Annotations or text labels are added to the plot to display information about data points when the cursor hovers over or clicks on them. Annotations can include data values, coordinates or any relevant information related to the plotted data.
Cursor Widgets in Annotated Widgets
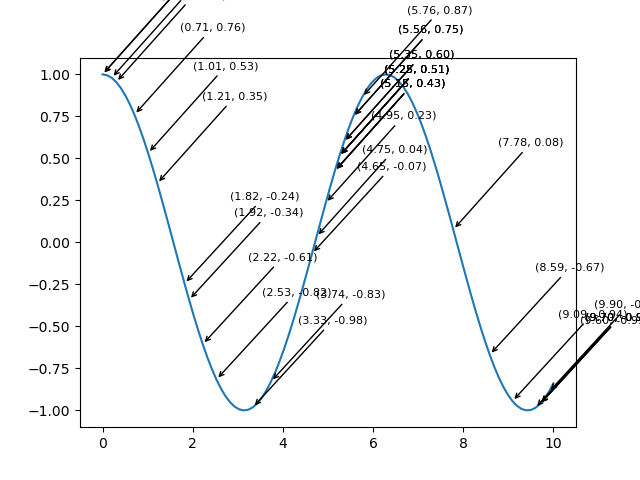
This example illustrates how cursor widgets can be used to dynamically annotate data points as the cursor moves over the plot by providing valuable information about specific coordinates. The annotations are removed upon clicking by allowing for a clean exploration of the plot.
Example
import matplotlib.pyplot as plt
import numpy as np
# Generating sample data
x = np.linspace(0, 10, 100)
y = np.cos(x)
# Creating a plot
fig, ax = plt.subplots()
line, = ax.plot(x, y, label='Cosine Wave')
# Annotate points on mouse hover
def annotate_point(event):
   if event.inaxes:
      x_cursor, y_cursor = event.xdata, event.ydata
      index = np.argmin(np.abs(x - x_cursor))  # Find nearest index to the cursor position
      ax.annotate(
         f'({x[index]:.2f}, {y[index]:.2f})',
         xy=(x[index], y[index]),
         xytext=(x[index] + 1, y[index] + 0.5),
         arrowprops=dict(facecolor='black', arrowstyle='->'),
         fontsize=8, color='black')
   fig.canvas.draw_idle()
# Remove annotations on mouse click
def remove_annotation(event):
   if event.inaxes:
      for annotation in ax.texts:
         annotation.remove()
      fig.canvas.draw_idle()
# Connect events to functions
plt.connect('motion_notify_event', annotate_point)
plt.connect('button_press_event', remove_annotation)
plt.show()
Output
Use Cases
Data Highlighting: Use annotations to emphasize specific data points or regions.
Informational Markers − Provide additional details or labels for key data points.
Interactive Exploration − Combine cursor interactivity with annotations for dynamic data exploration.
To Continue Learning Please Login