- Matplotlib Basics
- Matplotlib - Home
- Matplotlib - Introduction
- Matplotlib - Environment Setup
- Matplotlib - Anaconda distribution
- Matplotlib - Jupyter Notebook
- Matplotlib - Pyplot API
- Matplotlib - Simple Plot
- Matplotlib - Text
- Matplotlib - Images
- Matplotlib - Mathematical Expressions
- Matplotlib - Transforms
- Matplotlib - Ticks and Tick Labels
- Matplotlib - Axis Ranges
- Matplotlib - Axis Scales
- Matplotlib - Axis Ticks
- Matplotlib - Formatting Axes
- Matplotlib - Axes Class
- Matplotlib - Twin Axes
- Matplotlib - Figure Class
- Matplotlib - Multiplots
- Matplotlib - Grids
- Matplotlib - Object-oriented Interface
- Matplotlib - PyLab module
- Matplotlib - Subplots() Function
- Matplotlib - Subplot2grid() Function
- Matplotlib - Anchored Artists
- Matplotlib - Manual Contour
- Matplotlib - Coords Report
- Matplotlib - AGG filter
- Matplotlib - Ribbon Box
- Matplotlib - Fill Spiral
- Matplotlib - Findobj Demo
- Matplotlib - Hyperlinks
- Matplotlib - Image Thumbnail
- Matplotlib - Plotting with Keywords
- Matplotlib - Create Logo
- Matplotlib - Multipage PDF
- Matplotlib - Multiprocessing
- Matplotlib - Print Stdout
- Matplotlib - Compound Path
- Matplotlib - Sankey Class
- Matplotlib - MRI with EEG
- Matplotlib - Stylesheets
- Matplotlib - Background Colors
- Matplotlib - Basemap -->
- Matplotlib Widgets
- Matplotlib - Cursor Widget
- Matplotlib - Annotated Cursor
- Matplotlib - Buttons Widget
- Matplotlib - Check Buttons
- Matplotlib - Lasso Selector
- Matplotlib - Menu Widget
- Matplotlib - Mouse Cursor
- Matplotlib - Multicursor
- Matplotlib - Polygon Selector
- Matplotlib - Radio Buttons
- Matplotlib - RangeSlider
- Matplotlib - Rectangle Selector
- Matplotlib - Ellipse Selector
- Matplotlib - Slider Widget
- Matplotlib - Span Selector
- Matplotlib - Textbox
- Matplotlib Plotting
- Matplotlib - Bar Graphs
- Matplotlib - Histogram
- Matplotlib - Pie Chart
- Matplotlib - Scatter Plot
- Matplotlib - Box Plot
- Matplotlib - Violin Plot
- Matplotlib - Contour Plot
- Matplotlib - 3D Plotting
- Matplotlib - 3D Contours
- Matplotlib - 3D Wireframe Plot
- Matplotlib - 3D Surface Plot
- Matplotlib - Quiver Plot
- Matplotlib Useful Resources
- Matplotlib - Quick Guide
- Matplotlib - Useful Resources
- Matplotlib - Discussion
Matplotlib - Rectangle Selector
Introduction
Matplotlib library does not have a built-in RectangleSelector widget. However we can implement similar functionality using Matplotlib's event handling mechanisms. A RectangleSelector typically allows users to draw a rectangle on a plot and the data points within the rectangle are selected.
Key Concepts of a Rectangle Selector
The following are the key concepts of a Rectangule selector.
User Interaction − A RectangleSelector provides a way for users to interactively draw a rectangle on a plot by clicking and dragging the mouse.
Data Selection − The primary purpose of a RectangleSelector is to select a subset of data points within the drawn rectangle. This is valuable for tasks such as data exploration and analysis.
Event Handling − The implementation involves handling mouse events such as button presses and releases to track the coordinates of the drawn rectangle.
Use Cases
The following are the use cases of RectangularSelector widgets.
Data Subsetting − A RectangleSelector is useful for selecting and analyzing a subset of data points within a larger dataset.
Data Exploration − Users can interactively explore different regions of a plot to understand patterns or trends in specific areas.
Interactive Dashboards − For interactive dashboards or applications a RectangleSelector can be integrated to allow users to dynamically select and analyze data.
Region of Interest (ROI) Selection − In scientific or engineering applications users might want to define a region of interest for further investigation.
Implementation Steps
To implement a custom Rectangle Selector in Matplotlib we can typically follow these steps.
Enable Mouse Events − Matplotlib allows us to capture mouse events such as button presses, releases and motion. We need to enable these events to track the user's interactions.
Capture Mouse Press Event − When the user clicks the mouse button to start drawing the rectangle it capture the initial mouse position.
Capture Mouse Motion Event − As the user moves the mouse capture the current position to dynamically update the size of the rectangle being drawn.
Capture Mouse Release Event − When the user releases the mouse button it finalizes the rectangle's position and size.
Highlight or Select Data Points − Determine the data points within the selected rectangle and perform any necessary actions such as highlighting, selecting or zooming into the selected region.
Example
Here’s another example of using the all the implementation steps defined above.
import matplotlib.pyplot as plt
from matplotlib.patches import Rectangle
class RectangleSelector:
def __init__(self, ax):
self.ax = ax
self.start_point = None
self.rect = None
self.cid_press = ax.figure.canvas.mpl_connect('button_press_event', self.on_press)
self.cid_release = ax.figure.canvas.mpl_connect('button_release_event', self.on_release)
self.cid_motion = ax.figure.canvas.mpl_connect('motion_notify_event', self.on_motion)
def on_press(self, event):
if event.inaxes == self.ax:
self.start_point = (event.xdata, event.ydata)
self.rect = Rectangle(self.start_point, 0, 0, edgecolor='red', alpha=0.2)
self.ax.add_patch(self.rect)
def on_motion(self, event):
if self.start_point is not None and event.inaxes == self.ax:
width = event.xdata - self.start_point[0]
height = event.ydata - self.start_point[1]
self.rect.set_width(width)
self.rect.set_height(height)
self.ax.figure.canvas.draw()
def on_release(self, event):
if self.start_point is not None:
# Determine the data points within the rectangle and perform actions as needed
selected_data = self.get_data_within_rectangle()
print("Selected Data:", selected_data)
self.start_point = None
self.rect.remove()
self.ax.figure.canvas.draw()
def get_data_within_rectangle(self):
# Placeholder function to determine data points within the rectangle
# Implement logic to identify data points based on the rectangle's coordinates
return [(1, 2), (3, 4)] # Example data points
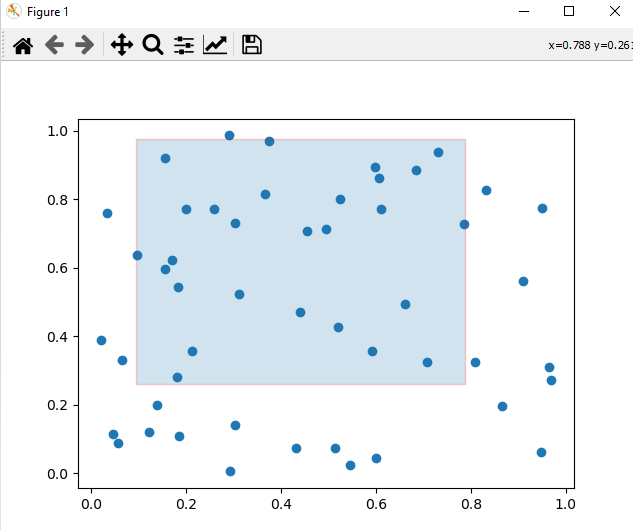
# Create a scatter plot with random data
import numpy as np
np.random.seed(42)
x_data = np.random.rand(50)
y_data = np.random.rand(50)
fig, ax = plt.subplots()
ax.scatter(x_data, y_data)
# Initialize the RectangleSelector
rect_selector = RectangleSelector(ax)
plt.show()
Output
Selected Data: [(1, 2), (3, 4)]
Considerations for Implementation
While we are implementing the RectangularSelector on a plot we have to consider the below mentioned points.
Callback Function − The callback function should handle the selected data or trigger specific actions based on the selected region.
Customization − The RectangleSelector can be customized to suit specific requirements such as changing the appearance of the rectangle or setting minimum span constraints.
Performance − Depending on the size of the dataset the performance of the implementation may vary. For large datasets optimizations might be necessary.
Implementation Example
Here's an example of how we can implement a simple RectangleSelector like functionality in Matplotlib.
In this example we are using the functions onselect and RectangleSelector() to create a rectangularselector.
onselect() − This function is triggered when the user finishes drawing the rectangle. It prints the coordinates of the selected rectangle.
RectangleSelector() − The RectangleSelector is created by specifying the axes ax, the callback function onselect, the draw type box(default) for rectangle and additional parameters for customization.
Example
import matplotlib.pyplot as plt
from matplotlib.widgets import RectangleSelector
import numpy as np
# Sample data
np.random.seed(42)
x_data = np.random.rand(100)
y_data = np.random.rand(100)
# Function to be triggered on rectangle selection
def onselect(eclick, erelease):
   x1, y1 = eclick.xdata, eclick.ydata
   x2, y2 = erelease.xdata, erelease.ydata
   print(f"Selected rectangle coordinates: ({x1}, {y1}) to ({x2}, {y2})")
# Create a scatter plot
fig, ax = plt.subplots()
ax.scatter(x_data, y_data)
# Define the RectangleSelector
rect_selector = RectangleSelector(ax, onselect, useblit=True, button=[1], minspanx=5, minspany=5, spancoords='pixels')
plt.show()
Output
Selected rectangle coordinates: (0.23518152400439746, 0.6559523809523811) to (0.6729136329804333, 1.05)
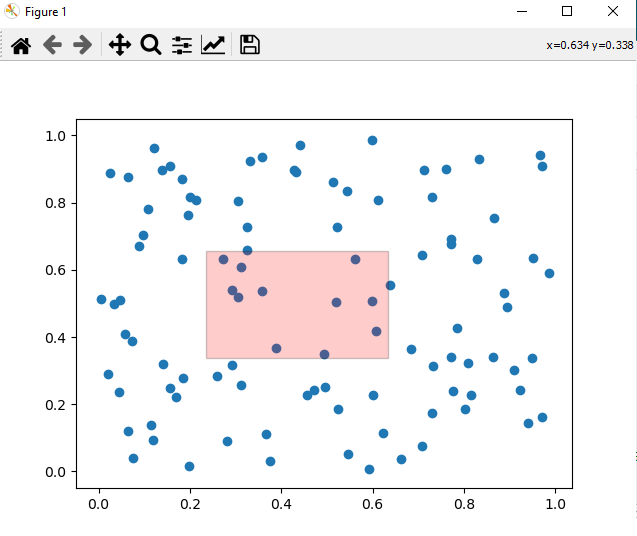
Note − To Draw the rectangle on the plot drag the cursor and the values of the coordinates will be varied as per the user selection.
To Continue Learning Please Login