- Matplotlib Basics
- Matplotlib - Home
- Matplotlib - Introduction
- Matplotlib - Environment Setup
- Matplotlib - Anaconda distribution
- Matplotlib - Jupyter Notebook
- Matplotlib - Pyplot API
- Matplotlib - Simple Plot
- Matplotlib - Text
- Matplotlib - Images
- Matplotlib - Mathematical Expressions
- Matplotlib - Transforms
- Matplotlib - Ticks and Tick Labels
- Matplotlib - Axis Ranges
- Matplotlib - Axis Scales
- Matplotlib - Axis Ticks
- Matplotlib - Formatting Axes
- Matplotlib - Axes Class
- Matplotlib - Twin Axes
- Matplotlib - Figure Class
- Matplotlib - Multiplots
- Matplotlib - Grids
- Matplotlib - Object-oriented Interface
- Matplotlib - PyLab module
- Matplotlib - Subplots() Function
- Matplotlib - Subplot2grid() Function
- Matplotlib - Anchored Artists
- Matplotlib - Manual Contour
- Matplotlib - Coords Report
- Matplotlib - AGG filter
- Matplotlib - Ribbon Box
- Matplotlib - Fill Spiral
- Matplotlib - Findobj Demo
- Matplotlib - Hyperlinks
- Matplotlib - Image Thumbnail
- Matplotlib - Plotting with Keywords
- Matplotlib - Create Logo
- Matplotlib - Multipage PDF
- Matplotlib - Multiprocessing
- Matplotlib - Print Stdout
- Matplotlib - Compound Path
- Matplotlib - Sankey Class
- Matplotlib - MRI with EEG
- Matplotlib - Stylesheets
- Matplotlib - Background Colors
- Matplotlib - Basemap -->
- Matplotlib Widgets
- Matplotlib - Cursor Widget
- Matplotlib - Annotated Cursor
- Matplotlib - Buttons Widget
- Matplotlib - Check Buttons
- Matplotlib - Lasso Selector
- Matplotlib - Menu Widget
- Matplotlib - Mouse Cursor
- Matplotlib - Multicursor
- Matplotlib - Polygon Selector
- Matplotlib - Radio Buttons
- Matplotlib - RangeSlider
- Matplotlib - Rectangle Selector
- Matplotlib - Ellipse Selector
- Matplotlib - Slider Widget
- Matplotlib - Span Selector
- Matplotlib - Textbox
- Matplotlib Plotting
- Matplotlib - Bar Graphs
- Matplotlib - Histogram
- Matplotlib - Pie Chart
- Matplotlib - Scatter Plot
- Matplotlib - Box Plot
- Matplotlib - Violin Plot
- Matplotlib - Contour Plot
- Matplotlib - 3D Plotting
- Matplotlib - 3D Contours
- Matplotlib - 3D Wireframe Plot
- Matplotlib - 3D Surface Plot
- Matplotlib - Quiver Plot
- Matplotlib Useful Resources
- Matplotlib - Quick Guide
- Matplotlib - Useful Resources
- Matplotlib - Discussion
Matplotlib - Polygon Selector
Introduction
Matplotlib does not have a dedicated Polygon Selector widget. However Matplotlib does provide a mechanism for handling mouse events and we can implement a custom polygon selection functionality using these event-handling capabilities.
Matplotlib allows us to capture mouse events such as button clicks, mouse movements, and releases. We can leverage these events to implement a polygon selection tool where users can interactively draw a polygon around the desired data points.
Key Concepts
The following the key concepts of the polygon selector widget.
Event Handling in Matplotlib
Matplotlib provides a flexible event-handling system that allows us to capture user interactions with the plot. Common events include mouse clicks, key presses and motion.
Path Class
The Path class in the matplotlib.path module represents a series of connected line and curve segments that can be used to define shapes such as polygons. We'll use it to define and check whether a point is inside the selected polygon.
Use Cases and Extensions
The following are the use cases and extensions of the polygon selector widget.
Region Selection − The custom Polygon Selector can be used to define and select specific regions of interest in a plot by allowing users to focus on particular areas of data.
Data Filtering − The selected polygon points can be used to filter and analyze specific subsets of data within the plotted dataset.
Integration with Callbacks − We can extend the functionality by integrating callback functions that respond to the selection of a polygon by allowing for custom actions or analyses based on the selected region.
Dynamic Visualization − Implementing dynamic visualization updates such as highlighting points within the polygon and can enhance the user experience.
Customization
We can enhance and customize the polygon selector based on specific needs. For instance we can add functionality to clear the current polygon dynamically update the plot based on the selected region or integrate it into a larger interactive application.
Implementation Steps
Now let's go through the steps to create a basic example of a custom polygon selector in Matplotlib.
Import Necessary Libraries
First we have to import Matplotlib and NumPy libraries for plotting and array manipulation.
import matplotlib.pyplot as plt
import numpy as np
Define Polygon Selector Class
After importing the necessary libraries we have to create a class that handles mouse events and allows users to draw a polygon.
class PolygonSelector:
   def __init__(self, ax):
      self.ax = ax
      self.polygon = None
      self.vertices = []
      self.cid_press = ax.figure.canvas.mpl_connect('button_press_event', self.on_press)
      self.cid_release = ax.figure.canvas.mpl_connect('button_release_event', self.on_release)
      self.cid_motion = ax.figure.canvas.mpl_connect('motion_notify_event', self.on_motion)
Define Event Callbacks
We have to define the event callbacks to implement methods for handling mouse press, release and motion events.
Example
def on_press(self, event):
   if event.inaxes != self.ax:
      return

   if event.button == 1:  # Left mouse button
      if self.polygon is None:
         self.polygon = plt.Polygon([event.xdata, event.ydata], closed=False, fill=None, edgecolor='r')
         self.ax.add_patch(self.polygon)
         self.vertices.append((event.xdata, event.ydata))
   else:
      self.vertices.append((event.xdata, event.ydata))

def on_release(self, event):
   if event.inaxes != self.ax:
      return

   if event.button == 1:  # Left mouse button
      if len(self.vertices) > 2:
         self.vertices.append(self.vertices[0])  # Closing the polygon
         self.polygon.set_xy(np.array(self.vertices))
         plt.draw()

   def on_motion(self, event):
      if event.inaxes != self.ax:
         return

   if event.button == 1 and self.polygon is not None:
      self.vertices[-1] = (event.xdata, event.ydata)
      self.polygon.set_xy(np.array(self.vertices))
      plt.draw()
Create a Plot
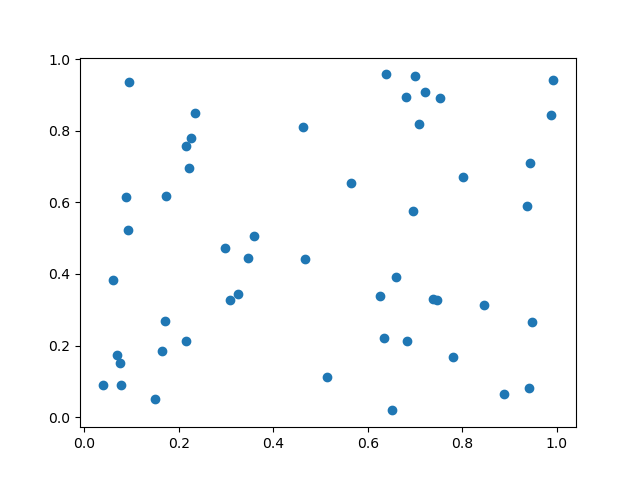
Next we have to generate sample data and create a plot to that generated data.
x = np.random.rand(50)
y = np.random.rand(50)
fig, ax = plt.subplots()
ax.scatter(x, y)
Initialize Polygon Selector and display the plot
Now instantiate the PolygonSelector class with the plot's axes, then display the plot.
polygon_selector = PolygonSelector(ax)
plt.show()
Now let’s combine all the above mentioned steps together.
Output
Example
import matplotlib.pyplot as plt
from matplotlib.patches import Polygon
from matplotlib.backend_bases import PickEvent
import numpy as np

class PolygonSelector:
   def __init__(self, ax):
      self.ax = ax
      self.points = []
      self.polygon = None
      self.cid_click = ax.figure.canvas.mpl_connect('button_press_event', self.on_click)
      self.cid_key = ax.figure.canvas.mpl_connect('key_press_event', self.on_key_press)

   def on_click(self, event):
      if event.inaxes == self.ax:
         if event.button == 1:  # Left mouse button
            self.points.append((event.xdata, event.ydata))
            self.update_polygon()

   def on_key_press(self, event):
      if event.key == 'enter':
         print("Polygon points:", self.points)
         self.reset_polygon()

   def update_polygon(self):
      if self.polygon:
         self.polygon.remove()
      if len(self.points) > 2:
         self.polygon = Polygon(self.points, edgecolor='red', alpha=0.2, closed=True)
         self.ax.add_patch(self.polygon)
         self.ax.figure.canvas.draw()

   def reset_polygon(self):
      self.points = []
      if self.polygon:
         self.polygon.remove()
         self.ax.figure.canvas.draw()

# Create a scatter plot with random data
np.random.seed(42)
x_data = np.random.rand(50)
y_data = np.random.rand(50)
fig, ax = plt.subplots()
ax.scatter(x_data, y_data)
# Initialize the PolygonSelector
polygon_selector = PolygonSelector(ax)
plt.show()
Output
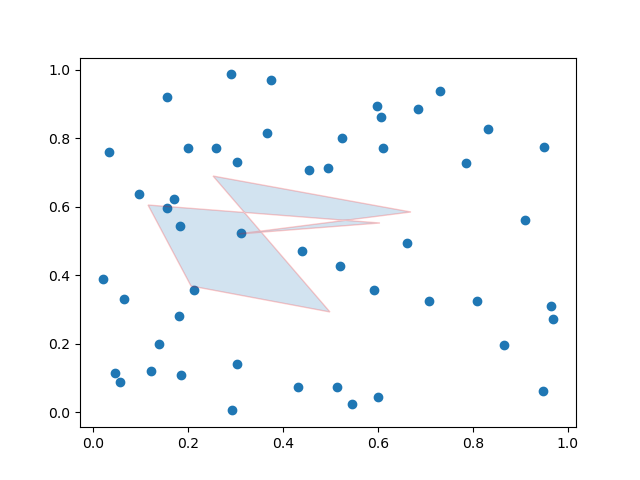
Example
Here this is another example of creating the polygon selector on a matpltlib plot.
import matplotlib.pyplot as plt
from matplotlib.patches import Polygon
from matplotlib.backend_bases import PickEvent
import numpy as np
class PolygonSelector:
   def __init__(self, ax):
      self.ax = ax
      self.points = []
      self.polygon = None
      self.highlighted_points = None
      self.cid_click = ax.figure.canvas.mpl_connect('button_press_event', self.on_click)
      self.cid_key = ax.figure.canvas.mpl_connect('key_press_event', self.on_key_press)
   def on_click(self, event):
      if event.inaxes == self.ax:
         if event.button == 1:  # Left mouse button
            self.points.append((event.xdata, event.ydata))
            self.update_polygon()
   def on_key_press(self, event):
      if event.key == 'enter':
         self.highlight_points_inside_polygon()
         self.reset_polygon()
   def update_polygon(self):
      if self.polygon:
         self.polygon.remove()
         if len(self.points) > 2:
            self.polygon = Polygon(self.points, edgecolor='red', alpha=0.2, closed=True)
            self.ax.add_patch(self.polygon)
            self.ax.figure.canvas.draw()
   def reset_polygon(self):
      self.points = []
      if self.polygon:
         self.polygon.remove()
         self.ax.figure.canvas.draw()
   def highlight_points_inside_polygon(self):
      if self.highlighted_points:
         for point in self.highlighted_points:
            point.set_markersize(5)
         self.highlighted_points = []
      if self.polygon:
         path = self.polygon.get_path()
         points_inside_polygon = self.ax.plot([], [], 'o', markersize=8, markerfacecolor='yellow')[0]
         for i in range(len(self.ax.collections)):
            if isinstance(self.ax.collections[i], PickEvent):
               xs, ys = self.ax.collections[i].get_offsets().T
               points_inside = path.contains_points(np.column_stack((xs, ys)))
               self.highlighted_points.extend(
                  self.ax.plot(
                     xs[points_inside], ys[points_inside], 'o', markersize=8, markerfacecolor='yellow'))
               self.ax.figure.canvas.draw()

# Create a scatter plot with random data
np.random.seed(42)
x_data = np.random.rand(50)
y_data = np.random.rand(50)
fig, ax = plt.subplots()
ax.scatter(x_data, y_data)
# Initialize the PolygonSelector
polygon_selector = PolygonSelector(ax)
plt.show()
Output
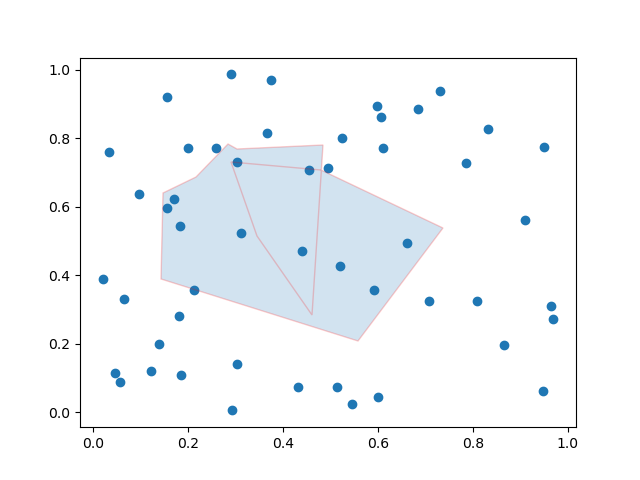
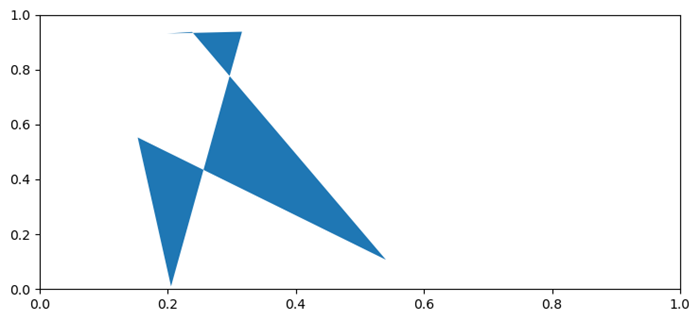
Fill an area within a polygon
In this example we are filling the area within a polygon using the matplotlib library.
Example
import matplotlib.pyplot as plt
from matplotlib.collections import PatchCollection
from matplotlib.patches import Polygon
import numpy as np
plt.rcParams["figure.figsize"] = [7.50, 3.50]
plt.rcParams["figure.autolayout"] = True
fig, ax = plt.subplots(1)
polygon = Polygon(np.random.rand(6, 2), closed=True, alpha=1)
collection = PatchCollection([polygon])
ax.add_collection(collection)
plt.show()
Output
Note − To Draw the Polygon on the plot drag the cursor and the values of the coordinates will be varied as per the user selection.
To Continue Learning Please Login