- Matplotlib Basics
- Matplotlib - Home
- Matplotlib - Introduction
- Matplotlib - Vs Seaborn
- Matplotlib - Environment Setup
- Matplotlib - Anaconda distribution
- Matplotlib - Jupyter Notebook
- Matplotlib - Pyplot API
- Matplotlib - Simple Plot
- Matplotlib - Saving Figures
- Matplotlib - Markers
- Matplotlib - Figures
- Matplotlib - Styles
- Matplotlib - Legends
- Matplotlib - Colors
- Matplotlib - Colormaps
- Matplotlib - Colormap Normalization
- Matplotlib - Choosing Colormaps
- Matplotlib - Colorbars
- Matplotlib - Text
- Matplotlib - Text properties
- Matplotlib - Subplot Titles
- Matplotlib - Images
- Matplotlib - Image Masking
- Matplotlib - Annotations
- Matplotlib - Arrows
- Matplotlib - Fonts
- Matplotlib - What are Fonts?
- Setting Font Properties Globally
- Matplotlib - Font Indexing
- Matplotlib - Mathematical Expressions
- Matplotlib - Transforms
- Matplotlib - Ticks and Tick Labels
- Matplotlib - Axis Ranges
- Matplotlib - Axis Scales
- Matplotlib - Axis Ticks
- Matplotlib - Formatting Axes
- Matplotlib - Axes Class
- Matplotlib - Twin Axes
- Matplotlib - Figure Class
- Matplotlib - Multiplots
- Matplotlib - Grids
- Matplotlib - Object-oriented Interface
- Matplotlib - PyLab module
- Matplotlib - Subplots() Function
- Matplotlib - Subplot2grid() Function
- Matplotlib - Anchored Artists
- Matplotlib - Manual Contour
- Matplotlib - Coords Report
- Matplotlib - AGG filter
- Matplotlib - Ribbon Box
- Matplotlib - Fill Spiral
- Matplotlib - Findobj Demo
- Matplotlib - Hyperlinks
- Matplotlib - Image Thumbnail
- Matplotlib - Plotting with Keywords
- Matplotlib - Create Logo
- Matplotlib - Multipage PDF
- Matplotlib - Multiprocessing
- Matplotlib - Print Stdout
- Matplotlib - Compound Path
- Matplotlib - Sankey Class
- Matplotlib - MRI with EEG
- Matplotlib - Stylesheets
- Matplotlib - Background Colors
- Matplotlib - Basemap
- Matplotlib Event Handling
- Matplotlib - Event Handling
- Matplotlib - Close Event
- Matplotlib - Mouse Move
- Matplotlib - Click Events
- Matplotlib - Scroll Event
- Matplotlib - Keypress Event
- Matplotlib - Pick Event
- Matplotlib - Looking Glass
- Matplotlib - Path Editor
- Matplotlib - Poly Editor
- Matplotlib - Timers
- Matplotlib - Viewlims
- Matplotlib - Zoom Window
- Matplotlib Plotting
- Matplotlib - Bar Graphs
- Matplotlib - Histogram
- Matplotlib - Pie Chart
- Matplotlib - Scatter Plot
- Matplotlib - Box Plot
- Matplotlib - Violin Plot
- Matplotlib - Contour Plot
- Matplotlib - 3D Plotting
- Matplotlib - 3D Contours
- Matplotlib - 3D Wireframe Plot
- Matplotlib - 3D Surface Plot
- Matplotlib - Quiver Plot
- Matplotlib Useful Resources
- Matplotlib - Quick Guide
- Matplotlib - Useful Resources
- Matplotlib - Discussion
Matplotlib - Lasso Selector
What is Lasso Selector?
The Lasso Selector in Matplotlib is a powerful tool that enables users to interactively select data points or regions of interest within a plot by drawing free-form, irregular shapes (lassos). It provides a visual and intuitive way to subset or manipulates data dynamically by making it particularly useful in exploratory data analysis and interactive visualization applications.
The Lasso Selector in Matplotlib provides a versatile tool for interactive data exploration and analysis. By combining it with callback functions and customization options users can create dynamic and engaging visualizations tailored to their specific needs.
Use Cases and Applications
The below are the use cases and applications of the lasso selector.
Data Subsetting − The Lasso Selector is valuable for selecting and isolating specific data points within a plot by enabling users to focus on subsets of interest in large datasets.
Outlier Detection − It can be used for identifying outliers or unusual patterns in the data by interactively highlighting and examining regions of interest.
Data Analysis − The Lasso Selector facilitates exploratory data analysis by allowing users to dynamically explore relationships and patterns in the data.
Interactive Visualizations − In interactive visualization applications, the Lasso Selector enhances user engagement by providing a direct and intuitive means of interacting with plotted data.
Integration with Other Widgets − The Lasso Selector can be combined with other Matplotlib widgets such as buttons or sliders to create more complex and interactive visualizations.
Key Features and Components of the Lasso selector
The below are the key features and components of the Lasso selector. Let’s see each and every one in detail.
Activation
To use the Lasso Selector we need to activate it within a Matplotlib plot. This is typically done through the use of the LassoSelector class provided by the matplotlib.widgets module. And also we need to import the matplotlib library pyplot module.
from matplotlib import pyplot as plt
from matplotlib.widgets import LassoSelector
Initialization
Create an instance of the LassoSelector class and associate it with the specific axes where we want the lasso selection to occur. We also need to define a callback function that will be executed when the lasso is completed.
Example
In the below example ax is the axes object where the lasso selection will take place and onlasso is the callback function that will be called with the selected vertices.
from matplotlib import pyplot as plt
from matplotlib.widgets import LassoSelector
def onlasso(vertices):
   # Process selected data based on vertices
   pass
lasso = LassoSelector(ax, onlasso)
Interactive Selection
Once the Lasso Selector is active the users can interact with the plot by clicking and dragging the mouse to draw a lasso around the desired data points. The vertices of the lasso are continuously updated during the dragging process.
Callback Function
The callback function onlasso in this example is executed when the lasso selection is completed. It receives the list of vertices defining the shape of the lasso. Within the callback function we can implement logic to process or manipulate the data points that fall within the selected region.
def onlasso(vertices):
   # Process selected data based on vertices
   selected_data = process_data_within_lasso(vertices)
   # Perform further actions with the selected data
Customization
The Lasso Selector can be customized to suit specific requirements. Parameters such as the appearance of the lasso line, the tolerance for lasso detection or the cursor style can be adjusted to enhance the user experience.
Here in the below line of code lineprops allows customization of the appearance of the lasso line and other parameters define properties such as the button used for selection, span coordinates and interactivity.
lasso = LassoSelector(ax, onlasso, lineprops=dict(color='red', linewidth=2), button=1, spancoords='data', interactive=True)
Example
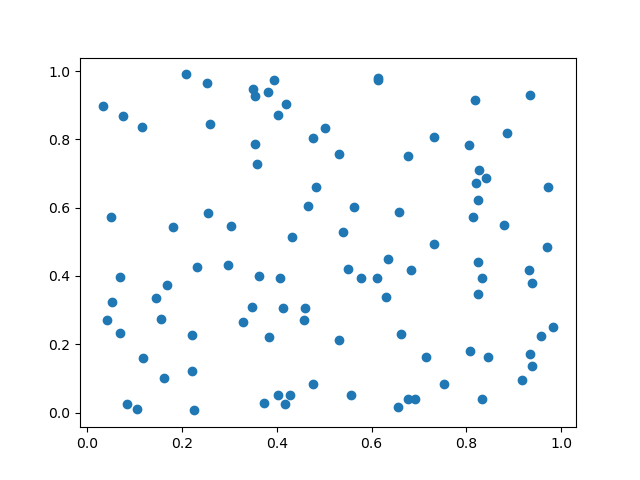
Now let’s create the code by combining all the above defined steps together. In this example the PointInPolygon function checks whether each data point is inside the lasso polygon. The selected points are then highlighted in the plot.
import matplotlib.pyplot as plt
from matplotlib.widgets import LassoSelector
import numpy as np
# Generate sample data
x = np.random.rand(100)
y = np.random.rand(100)
# Create a scatter plot
fig, ax = plt.subplots()
scatter = ax.scatter(x, y)
# Callback function for lasso selection
def onlasso(selected):
   indices = np.nonzero(selected)[0]
   selected_points = [(x, y)]
   print("Selected points:", selected_points)
# Create a Lasso Selector
lasso_selector = LassoSelector(ax, onlasso)
plt.show()
Output
Selected points: [(array([0.29635761, 0.93831573, 0.81874023, 0.98356721, 0.25967084,
   0.96972363, 0.43123387, 0.3475188 , 0.05034953, 0.05276526,
   0.69201126, 0.45792899, 0.22652163, 0.61397031, 0.25285812,
   0.57763175, 0.35920875, 0.82355223, 0.82069616, 0.4773504 ,
---------------------------------------------------------------------------------------
   0.82447152, 0.14643626, 0.83292972, 0.54029653, 0.84466591]),
   array([0.43130171, 0.37904049, 0.91506073, 0.25116927, 0.84421233,
   0.48402057, 0.51409544, 0.30846828, 0.5730422 , 0.3252112 ,
   0.03926941, 0.27199861, 0.00637904, 0.97835479, 0.96574721,
   0.3951553 , 0.72837085, 0.3458061 , 0.67109316, 0.80543004,
   0.94675624, 0.40021228, 0.78329798, 0.26592845, 0.9903323 ,
   0.0257696 , 0.60352881, 0.65950598, 0.68804556, 0.12038758,
   0.93852978, 0.18118328, 0.6227534 , 0.22267608, 0.30721642,
   0.54645854, 0.41719342, 0.1602256 , 0.1709364 , 0.41814479,
   .------------------------------------------------------------
---------------------------------------------------------------
]))]
Example
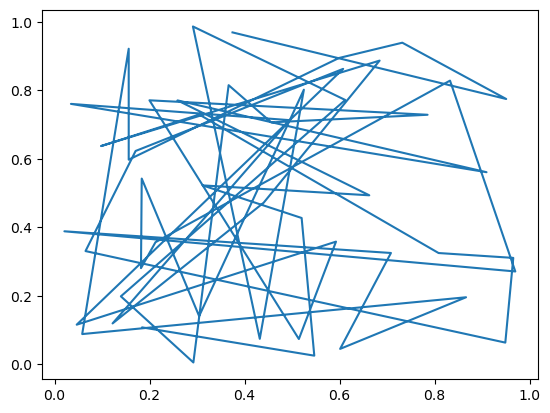
Below is an example of how to use the Lasso Selector in Matplotlib. In this example we'll create a scatter plot and users can interactively select data points using the Lasso Selector. The selected data points will be printed to the console.
import matplotlib.pyplot as plt
from matplotlib.widgets import LassoSelector
import numpy as np
# Generate random data for the scatter plot
np.random.seed(42)
x_data = np.random.rand(50)
y_data = np.random.rand(50)
# Function to be called on lasso selection
def onlasso(vertices):
   selected_indices = lasso_selector.ind_verts
   selected_data = [(x_data, y_data)]
   print("Selected Data:", selected_data)
# Create a scatter plot
fig, ax = plt.subplots()
scatter = ax.plot(x_data, y_data, picker=True)  # Enable picker for each data point
# Add Lasso Selector to the plot
lasso_selector = LassoSelector(ax, onlasso)
# Function to handle pick events (enable data point picking)
def onpick(event):
   if event.artist == scatter:
      lasso_selector.set_active(True)
# Connect the pick event to the onpick function
fig.canvas.mpl_connect('pick_event', onpick)
plt.show()
Output
To Continue Learning Please Login