- Matplotlib Basics
- Matplotlib - Home
- Matplotlib - Introduction
- Matplotlib - Environment Setup
- Matplotlib - Anaconda distribution
- Matplotlib - Jupyter Notebook
- Matplotlib - Pyplot API
- Matplotlib - Simple Plot
- Matplotlib - Text
- Matplotlib - Images
- Matplotlib - Mathematical Expressions
- Matplotlib - Transforms
- Matplotlib - Ticks and Tick Labels
- Matplotlib - Axis Ranges
- Matplotlib - Axis Scales
- Matplotlib - Axis Ticks
- Matplotlib - Formatting Axes
- Matplotlib - Axes Class
- Matplotlib - Twin Axes
- Matplotlib - Figure Class
- Matplotlib - Multiplots
- Matplotlib - Grids
- Matplotlib - Object-oriented Interface
- Matplotlib - PyLab module
- Matplotlib - Subplots() Function
- Matplotlib - Subplot2grid() Function
- Matplotlib - Anchored Artists
- Matplotlib - Manual Contour
- Matplotlib - Coords Report
- Matplotlib - AGG filter
- Matplotlib - Ribbon Box
- Matplotlib - Fill Spiral
- Matplotlib - Findobj Demo
- Matplotlib - Hyperlinks
- Matplotlib - Image Thumbnail
- Matplotlib - Plotting with Keywords
- Matplotlib - Create Logo
- Matplotlib - Multipage PDF
- Matplotlib - Multiprocessing
- Matplotlib - Print Stdout
- Matplotlib - Compound Path
- Matplotlib - Sankey Class
- Matplotlib - MRI with EEG
- Matplotlib - Stylesheets
- Matplotlib - Background Colors
- Matplotlib - Basemap -->
- Matplotlib Widgets
- Matplotlib - Cursor Widget
- Matplotlib - Annotated Cursor
- Matplotlib - Buttons Widget
- Matplotlib - Check Buttons
- Matplotlib - Lasso Selector
- Matplotlib - Menu Widget
- Matplotlib - Mouse Cursor
- Matplotlib - Multicursor
- Matplotlib - Polygon Selector
- Matplotlib - Radio Buttons
- Matplotlib - RangeSlider
- Matplotlib - Rectangle Selector
- Matplotlib - Ellipse Selector
- Matplotlib - Slider Widget
- Matplotlib - Span Selector
- Matplotlib - Textbox
- Matplotlib Plotting
- Matplotlib - Bar Graphs
- Matplotlib - Histogram
- Matplotlib - Pie Chart
- Matplotlib - Scatter Plot
- Matplotlib - Box Plot
- Matplotlib - Violin Plot
- Matplotlib - Contour Plot
- Matplotlib - 3D Plotting
- Matplotlib - 3D Contours
- Matplotlib - 3D Wireframe Plot
- Matplotlib - 3D Surface Plot
- Matplotlib - Quiver Plot
- Matplotlib Useful Resources
- Matplotlib - Quick Guide
- Matplotlib - Useful Resources
- Matplotlib - Discussion
Matplotlib - RangeSlider
Introduction
Matplotlib library itself does not provide a RangeSlider widget as part of its standard set of widgets. However it's worth noting that external libraries or interactive tools built on top of Matplotlib such as matplotlib-widgets or other custom implementations which may offer range slider functionality.
A range slider is a graphical user interface (GUI) element commonly used to specify a range of values by dragging two sliders. Each slider represents an endpoint of the range and the area between the sliders represents the selected range.
Given that a RangeSlider is not a native part of Matplotlib here we will provide a conceptual explanation of how a RangeSlider might work and some potential use cases.
Key Features of a RangeSlider
The following are the key features of a range slider of the matplotlib.widgets library.
Dual Slider Interaction − A RangeSlider typically consists of two sliders that can be independently moved along a linear track. The position of each slider represents the selected range's lower and upper bounds.
Real-time Feedback − As the sliders are moved there is real-time feedback visually indicating the selected range. This interactive aspect allows users to precisely choose the desired range.
Integration with Plots − Range sliders are often integrated into plots or charts to dynamically filter or highlight data within a specific range. For example users might want to zoom in on a specific time period in a time-series plot.
Callback Functions − The RangeSlider is associated with callback functions that are triggered when the sliders are moved. These callbacks enable developers to respond to user interactions and update the plot or perform other actions accordingly.
Conceptual Implementation
Here's a conceptual explanation of how a RangeSlider might be implemented using Matplotlib's event handling and interactive features.
In this conceptual example we have used some important modules and functions let’s see them in detail
generate_data − This function generates some sample data (x, y) to be used for plotting.
update − This function is called whenever the sliders are moved. It updates the plot based on the selected range.
Slider − Two sliders i.e. slider_lower and slider_upper are created to represent the lower and upper bounds of the selected range.
The initial plot is created and displayed and users can interactively adjust the range using the sliders.
Example
import matplotlib.pyplot as plt
from matplotlib.widgets import Slider
# Function to generate sample data
def generate_data():
   x = range(100)
   y = [val for val in x]
   return x, y
# Function to update the plot based on the selected range
def update(val):
   lower_val = slider_lower.val
   upper_val = slider_upper.val
   selected_x = x[lower_val:upper_val]
   selected_y = y[lower_val:upper_val]
   ax.clear()
   ax.plot(x, y, label='Original Data')
   ax.plot(selected_x, selected_y, label='Selected Range', color='orange')
   ax.legend()
   ax.set_title(f'Selected Range: {lower_val} to {upper_val}')
# Generate sample data
x, y = generate_data()
# Create a figure and axes
fig, ax = plt.subplots()
plt.subplots_adjust(bottom=0.25)
# Define initial range
initial_lower = 0
initial_upper = 20
# Create sliders
ax_lower = plt.axes([0.1, 0.1, 0.65, 0.03])
ax_upper = plt.axes([0.1, 0.05, 0.65, 0.03])
slider_lower = Slider(ax_lower, 'Lower', 0, len(x) - 1, valinit=initial_lower, valstep=1)
slider_upper = Slider(ax_upper, 'Upper', 0, len(x) - 1, valinit=initial_upper, valstep=1)
# Connect sliders to the update function
slider_lower.on_changed(update)
plt.show()
Output
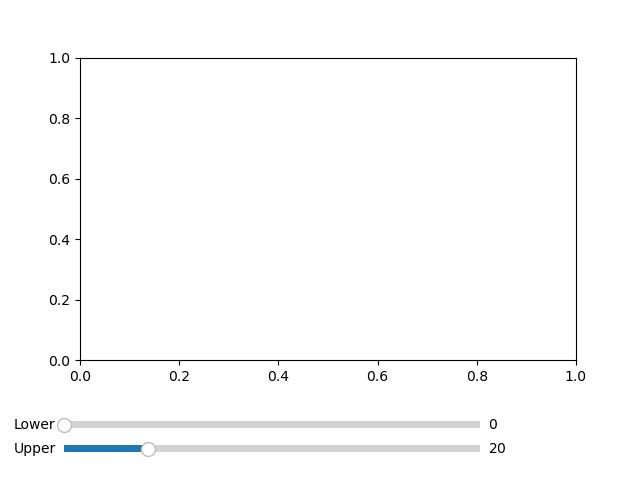
Initial plot

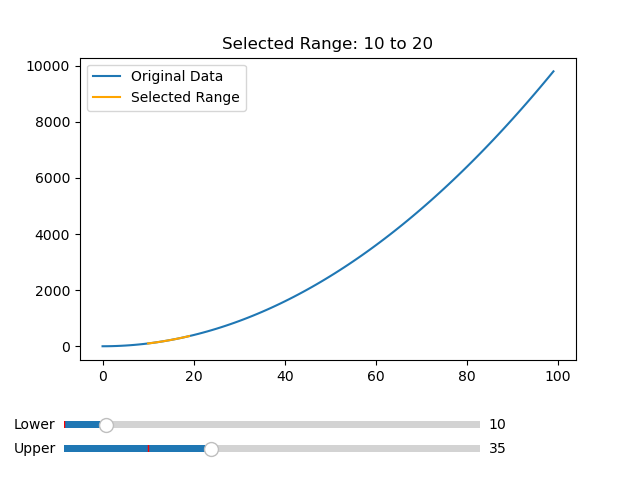
Selected range plot

Dynamic selection
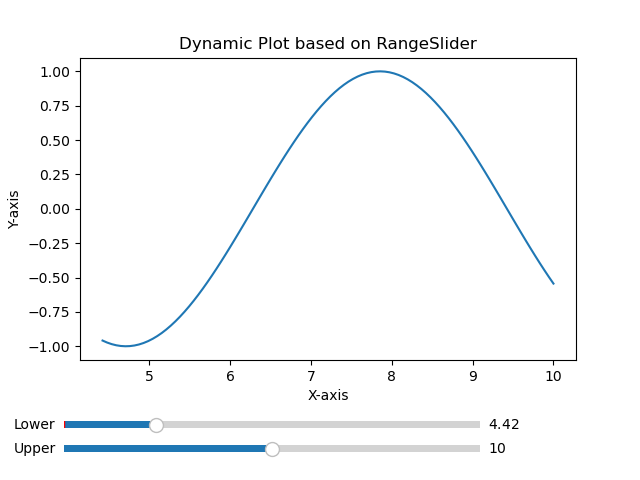
In this example we are selecting the data values using the slider dynamically.
Example
import matplotlib.pyplot as plt
from matplotlib.widgets import Slider
import numpy as np
# Function to generate data for the plot
def generate_data(start, end):
   x = np.linspace(start, end, 100)
   y = np.sin(x)
   return x, y
# Function to update the plot based on the selected range
def update_plot(val):
   lower_val = slider_lower.val
   upper_val = slider_upper.val
   x, y = generate_data(lower_val, upper_val)
   line.set_data(x, y)
   ax.relim()
   ax.autoscale_view()
   plt.draw()
# Create a figure and axes
fig, ax = plt.subplots()
plt.subplots_adjust(bottom=0.25)
# Initial range
initial_lower = 0
initial_upper = 10
# Create sliders
ax_lower = plt.axes([0.1, 0.1, 0.65, 0.03])
ax_upper = plt.axes([0.1, 0.05, 0.65, 0.03])
slider_lower = Slider(ax_lower, 'Lower', 0, 20, valinit=initial_lower)
slider_upper = Slider(ax_upper, 'Upper', 0, 20, valinit=initial_upper)
# Connect sliders to the update function
slider_lower.on_changed(update_plot)
slider_upper.on_changed(update_plot)
# Generate initial data and plot
x_initial, y_initial = generate_data(initial_lower, initial_upper)
line, = ax.plot(x_initial, y_initial)
ax.set_xlabel('X-axis')
ax.set_ylabel('Y-axis')
ax.set_title('Dynamic Plot based on RangeSlider')
plt.show()
Output
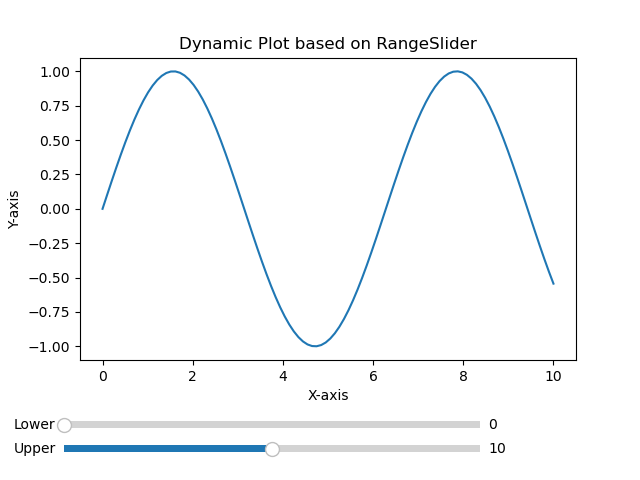
Intital plot

Dynamic selection plot

Use Cases
The below are the use cases of the Range slider of the matplotlib library.
Zooming and Selection − Range sliders are commonly used in scenarios where users need to zoom in on specific regions of a plot or select a range of values within a dataset.
Time-Series Filtering − In time-series data range sliders allow users to filter data based on a specific time range by enabling a closer examination of trends or anomalies.
Data Exploration − Range sliders facilitate interactive data exploration by allowing users to dynamically adjust the visible range and focus on specific portions of the data.
Parameter Adjustment − For plots representing parameterized functions or simulations, range sliders can control the range of parameter values providing a dynamic way to observe changes in the output.
To Continue Learning Please Login