- Matplotlib Basics
- Matplotlib - Home
- Matplotlib - Introduction
- Matplotlib - Environment Setup
- Matplotlib - Anaconda distribution
- Matplotlib - Jupyter Notebook
- Matplotlib - Pyplot API
- Matplotlib - Simple Plot
- Matplotlib - Text
- Matplotlib - Images
- Matplotlib - Mathematical Expressions
- Matplotlib - Transforms
- Matplotlib - Ticks and Tick Labels
- Matplotlib - Axis Ranges
- Matplotlib - Axis Scales
- Matplotlib - Axis Ticks
- Matplotlib - Formatting Axes
- Matplotlib - Axes Class
- Matplotlib - Twin Axes
- Matplotlib - Figure Class
- Matplotlib - Multiplots
- Matplotlib - Grids
- Matplotlib - Object-oriented Interface
- Matplotlib - PyLab module
- Matplotlib - Subplots() Function
- Matplotlib - Subplot2grid() Function
- Matplotlib - Anchored Artists
- Matplotlib - Manual Contour
- Matplotlib - Coords Report
- Matplotlib - AGG filter
- Matplotlib - Ribbon Box
- Matplotlib - Fill Spiral
- Matplotlib - Findobj Demo
- Matplotlib - Hyperlinks
- Matplotlib - Image Thumbnail
- Matplotlib - Plotting with Keywords
- Matplotlib - Create Logo
- Matplotlib - Multipage PDF
- Matplotlib - Multiprocessing
- Matplotlib - Print Stdout
- Matplotlib - Compound Path
- Matplotlib - Sankey Class
- Matplotlib - MRI with EEG
- Matplotlib - Stylesheets
- Matplotlib - Background Colors
- Matplotlib - Basemap -->
- Matplotlib Widgets
- Matplotlib - Cursor Widget
- Matplotlib - Annotated Cursor
- Matplotlib - Buttons Widget
- Matplotlib - Check Buttons
- Matplotlib - Lasso Selector
- Matplotlib - Menu Widget
- Matplotlib - Mouse Cursor
- Matplotlib - Multicursor
- Matplotlib - Polygon Selector
- Matplotlib - Radio Buttons
- Matplotlib - RangeSlider
- Matplotlib - Rectangle Selector
- Matplotlib - Ellipse Selector
- Matplotlib - Slider Widget
- Matplotlib - Span Selector
- Matplotlib - Textbox
- Matplotlib Plotting
- Matplotlib - Bar Graphs
- Matplotlib - Histogram
- Matplotlib - Pie Chart
- Matplotlib - Scatter Plot
- Matplotlib - Box Plot
- Matplotlib - Violin Plot
- Matplotlib - Contour Plot
- Matplotlib - 3D Plotting
- Matplotlib - 3D Contours
- Matplotlib - 3D Wireframe Plot
- Matplotlib - 3D Surface Plot
- Matplotlib - Quiver Plot
- Matplotlib Useful Resources
- Matplotlib - Quick Guide
- Matplotlib - Useful Resources
- Matplotlib - Discussion
Matplotlib - Ellipse Selector
Introduction
Matplotlib does not have a direct built-in Ellipse Selector widget but we can achieve the similar functionality by implementing a custom Ellipse Selector using Matplotlib's event handling capabilities.
Concept of Ellipse Selector
An ellipse selector is an interactive tool that allows users to draw and select data points within an elliptical region. This tool is particularly useful when exploring datasets or images and wanting to focus on a specific area of interest defined by an ellipse.
Key Features of an Ellipse Selector
The below are the key features of an Ellipse Selector.
Interactive Selection − An Ellipse Selector allows users to interactively define and modify an elliptical region within a plot. This is valuable for selecting specific areas of interest in data visualizations.
Dynamic Updates − As users drag or resize the ellipse the selected region dynamically updates. Real-time feedback enhances the user experience and allows for precise selection.
Integration with Plots − The Ellipse Selector is typically integrated into Matplotlib plots by enabling users to visually inspect and interact with data points within the selected ellipse.
Implementation Approaches
Creating an Ellipse Selector involves capturing mouse events to define and update the elliptical region. Below are two potential approaches for implementing an Ellipse Selector in Matplotlib.
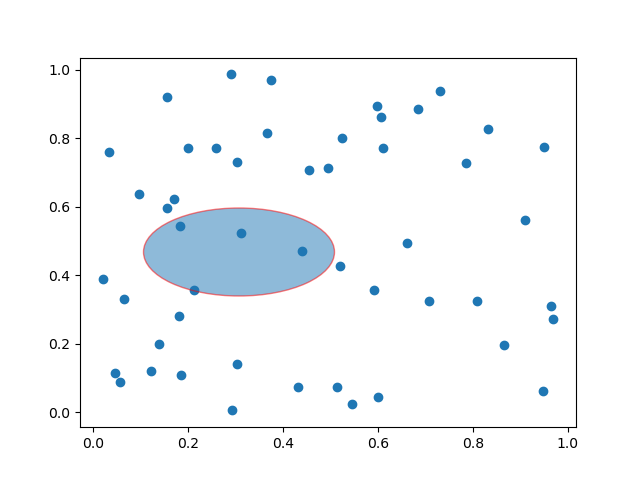
Using matplotlib.patches.Ellipse
We can leverage the Ellipse patch in Matplotlib to visually represent the Ellipse Selector. The idea is to handle mouse events to define the ellipse's center, width, height and rotation.
Example
import matplotlib.pyplot as plt
from matplotlib.patches import Ellipse

class EllipseSelector:
   def __init__(self, ax):
      self.ax = ax
      self.ellipse = None
      self.cid_press = ax.figure.canvas.mpl_connect('button_press_event', self.on_press)
      self.cid_release = ax.figure.canvas.mpl_connect('button_release_event', self.on_release)
      self.cid_motion = ax.figure.canvas.mpl_connect('motion_notify_event', self.on_motion)

   def on_press(self, event):
      if event.inaxes == self.ax:
         center = (event.xdata, event.ydata)
         self.ellipse = Ellipse(center, 1, 1, edgecolor='red', alpha=0.5)
         self.ax.add_patch(self.ellipse)

   def on_release(self, event):
      self.ellipse = None

   def on_motion(self, event):
      if self.ellipse:
         width = event.xdata - self.ellipse.center[0]
         height = event.ydata - self.ellipse.center[1]
         self.ellipse.width = width
         self.ellipse.height = height
         self.ax.figure.canvas.draw()

# Create a scatter plot with random data
np.random.seed(42)
x_data = np.random.rand(50)
y_data = np.random.rand(50)

fig, ax = plt.subplots()
ax.scatter(x_data, y_data)

# Initialize the EllipseSelector
ellipse_selector = EllipseSelector(ax)

plt.show()
Output
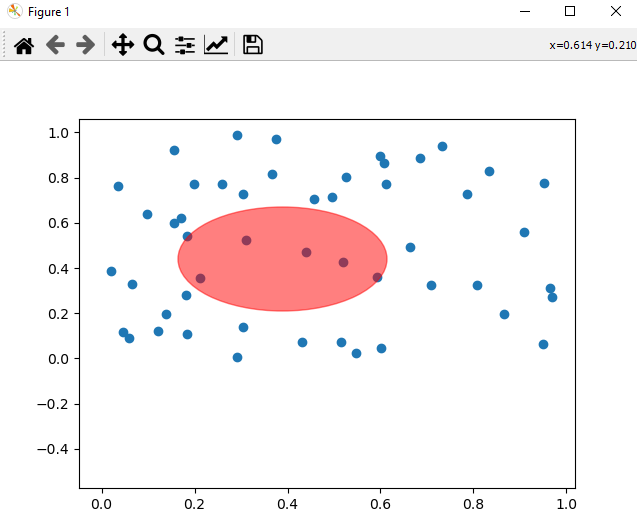
Using matplotlib.widgets (Custom Widget)
Another approach involves creating a custom widget using matplotlib.widgets to encapsulate the Ellipse Selector's logic. This approach might offer a more modular solution.
Example
import matplotlib.pyplot as plt
from matplotlib.widgets import EllipseSelector
import numpy as np

# Function to be triggered when the ellipse is selected
def on_select(eclick, erelease):
   print(f"Selected Ellipse: Center={eclick.xdata, eclick.ydata}, Width={abs(erelease.xdata - eclick.xdata)}, Height={abs(erelease.ydata - eclick.ydata)}")

# Create a scatter plot with random data
np.random.seed(42)
x_data = np.random.rand(50)
y_data = np.random.rand(50)

fig, ax = plt.subplots()
ax.scatter(x_data, y_data)

# Create Ellipse Selector
ellipse_selector = EllipseSelector(ax, on_select, props=dict(facecolor='red', edgecolor='red', alpha=0.5))

plt.show()
Output
Selected Ellipse: Center=(0.17951154118643367, 0.2584893480158592), Width=0.3678226677251435, Height=0.5797088949246063
Use Cases and Considerations
The following are the use cases and considerations of the Ellipse Selector widget.
Data Region Selection − Ellipse Selectors are useful for selecting specific regions of interest within scatter plots or other types of data visualizations.
Data Analysis − Users can utilize Ellipse Selectors to visually analyze and interpret patterns or clusters of data points within the selected elliptical region.
Integration with Callbacks − To enhance functionality Ellipse Selectors can be associated with callback functions that respond to the selection. For example if we perform actions based on the data points within the ellipse.
Visual Exploration − The interactive nature of Ellipse Selectors allows users to dynamically explore and refine their selection by aiding in the understanding of complex datasets.
Finally we can say as Matplotlib does not have a dedicated Ellipse Selector widget in creating a custom Ellipse Selector is feasible using existing Matplotlib components. The examples provided demonstrate two potential approaches for implementing an Ellipse Selector. By capturing mouse events and updating the ellipse's properties accordingly we can create an interactive tool for selecting and exploring data within a Matplotlib plot.
To Continue Learning Please Login