- Matplotlib Basics
- Matplotlib - Home
- Matplotlib - Introduction
- Matplotlib - Environment Setup
- Matplotlib - Anaconda distribution
- Matplotlib - Jupyter Notebook
- Matplotlib - Pyplot API
- Matplotlib - Simple Plot
- Matplotlib - Text
- Matplotlib - Images
- Matplotlib - Mathematical Expressions
- Matplotlib - Transforms
- Matplotlib - Ticks and Tick Labels
- Matplotlib - Axis Ranges
- Matplotlib - Axis Scales
- Matplotlib - Axis Ticks
- Matplotlib - Formatting Axes
- Matplotlib - Axes Class
- Matplotlib - Twin Axes
- Matplotlib - Figure Class
- Matplotlib - Multiplots
- Matplotlib - Grids
- Matplotlib - Object-oriented Interface
- Matplotlib - PyLab module
- Matplotlib - Subplots() Function
- Matplotlib - Subplot2grid() Function
- Matplotlib - Anchored Artists
- Matplotlib - Manual Contour
- Matplotlib - Coords Report
- Matplotlib - AGG filter
- Matplotlib - Ribbon Box
- Matplotlib - Fill Spiral
- Matplotlib - Findobj Demo
- Matplotlib - Hyperlinks
- Matplotlib - Image Thumbnail
- Matplotlib - Plotting with Keywords
- Matplotlib - Create Logo
- Matplotlib - Multipage PDF
- Matplotlib - Multiprocessing
- Matplotlib - Print Stdout
- Matplotlib - Compound Path
- Matplotlib - Sankey Class
- Matplotlib - MRI with EEG
- Matplotlib - Stylesheets
- Matplotlib - Background Colors
- Matplotlib - Basemap -->
- Matplotlib Widgets
- Matplotlib - Cursor Widget
- Matplotlib - Annotated Cursor
- Matplotlib - Buttons Widget
- Matplotlib - Check Buttons
- Matplotlib - Lasso Selector
- Matplotlib - Menu Widget
- Matplotlib - Mouse Cursor
- Matplotlib - Multicursor
- Matplotlib - Polygon Selector
- Matplotlib - Radio Buttons
- Matplotlib - RangeSlider
- Matplotlib - Rectangle Selector
- Matplotlib - Ellipse Selector
- Matplotlib - Slider Widget
- Matplotlib - Span Selector
- Matplotlib - Textbox
- Matplotlib Plotting
- Matplotlib - Bar Graphs
- Matplotlib - Histogram
- Matplotlib - Pie Chart
- Matplotlib - Scatter Plot
- Matplotlib - Box Plot
- Matplotlib - Violin Plot
- Matplotlib - Contour Plot
- Matplotlib - 3D Plotting
- Matplotlib - 3D Contours
- Matplotlib - 3D Wireframe Plot
- Matplotlib - 3D Surface Plot
- Matplotlib - Quiver Plot
- Matplotlib Useful Resources
- Matplotlib - Quick Guide
- Matplotlib - Useful Resources
- Matplotlib - Discussion
Matplotlib - Buttons Widget
What is Buttons Widget?
In Matplotlib library the Buttons widget allows the creation of interactive buttons within a plot or figure. These buttons can trigger specific actions or functions when clicked providing users with an intuitive way to control plot elements or perform operations without writing additional code.
Key Aspects of the Buttons Widget
Interactive Interface − Buttons provide a user-friendly interface within a plot by enhancing interactivity for users exploring data.
Function Triggering − Each button is associated with a specific function or action that gets executed when the button is clicked.
Customization − Buttons can be customized in terms of appearance, position, label and functionality to suit specific application needs.
The Button widget in Matplotlib library is found in the matplotlib.widgets module. This allows users to incorporate interactive buttons directly into their plots. These buttons can trigger specific actions or functions when clicked by providing a way to add interactivity and control to visualizations.
Basic Usage of Button Widget
Here's a breakdown of how to use the Button widget in Matplotlib library, let’s see them one by one.
Importing Necessary Libraries
To use the Button widget in Matplotlib we need to import necessary modules from Matplotlib. Here's is the way how to import the required libraries for working with button widgets.
import matplotlib.pyplot as plt
from matplotlib.widgets import Button
Where,
matplotlib.pyplot − This module provides a MATLAB-like plotting framework in Matplotlib. It's typically imported as plt and offers functions to create figures, axes, plots and widgets within the plot.
matplotlib.widgets.Button − The Button class is part of the matplotlib.widgets module which contains various interactive widgets such as buttons. Importing Button from this module allows us to create and customize buttons within our plots.
Once these libraries are imported we can create buttons and define their functionalities within our Matplotlib plots as needed. The Button widget when integrated into plots provides interactive elements for triggering specific actions or functions upon user interaction.
Creating a Figure and Axes
Creating a figure and axes in Matplotlib involves setting up the canvas (figure) and the plotting area (axes) where your visualizations will be displayed. Here's an example of how to create a figure and axes.
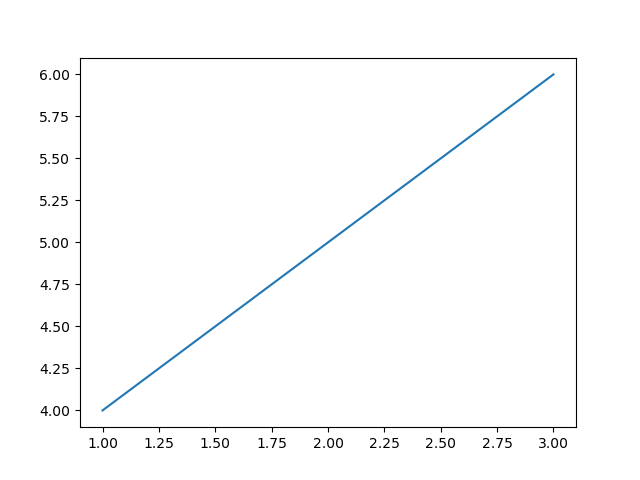
Example
import matplotlib.pyplot as plt
# Create a figure and axes
fig, ax = plt.subplots()
# Plotting on the axes
ax.plot([1, 2, 3], [4, 5, 6])
# Show the plot
plt.show()
Output
Defining Functionality on Button Click
Defining functionality for a button in Matplotlib involves creating a function that specifies the actions to be performed when the button is clicked. Here's an example of defining functionality for a button click.
Example
import matplotlib.pyplot as plt
from matplotlib.widgets import Button
# Function to be triggered by the button click
def button_click(event):
print("Button Clicked!") # Perform actions or call functions here
# Creating a plot
fig, ax = plt.subplots()
ax.plot([1, 2, 3], [4, 5, 6])
# Define the position and dimensions of the button
button_ax = plt.axes([0.7, 0.05, 0.2, 0.075]) # [left, bottom, width, height]
button = Button(button_ax, 'Click me') # Create a button object
# Connect the button's click event to the function
button.on_clicked(button_click)
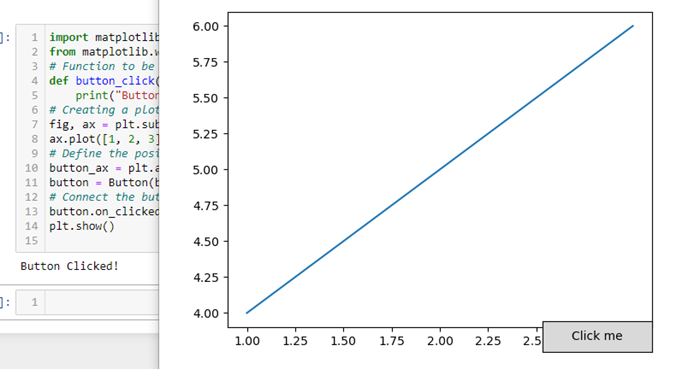
plt.show()
Output
Creating the Button
Create a button object and define its position and dimensions within the plot by using the Button class from the matplotlib.widgets module. Here's an example demonstrating how to create a button.
Example
import matplotlib.pyplot as plt
from matplotlib.widgets import Button
# Function to be triggered by the button click
def button_click(event):
   print("Button Clicked!")  # Perform actions or call functions here
# Creating a figure and axes
fig, ax = plt.subplots()
# Define the position and dimensions of the button
button_ax = plt.axes([0.5, 0.5, 0.12, 0.15])  # [left, bottom, width, height]
# Create a button object
button = Button(button_ax, 'Click me')  # 'Click me' is the text displayed on the button
# Connect the button's click event to the function
button.on_clicked(button_click)
# Show the plot
plt.show()
Output
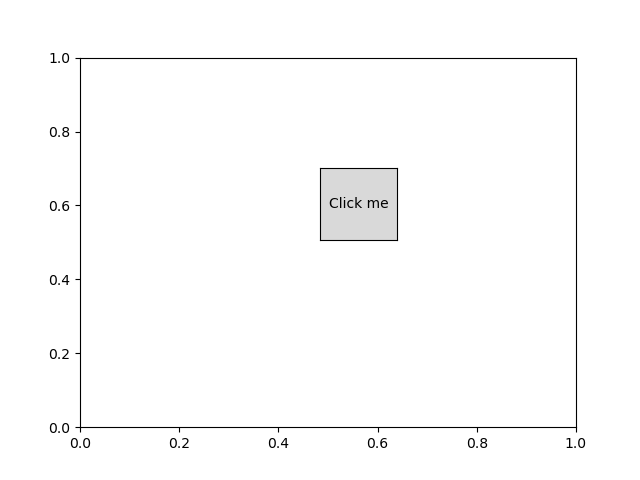
Now when we run this code and display the plot we will see a button labeled 'Click me'. Clicking on this button will trigger the button_click function and prints "Button Clicked!" to the console. We can customize the `button_click` function to perform different actions based on our specific needs.
Connecting Button Click Event
Connecting a button's click event to a function involves using the on_clicked method provided by the Button widget in Matplotlib. Here's an example demonstrating how to connect a button's click event to a function.
Example
import matplotlib.pyplot as plt
from matplotlib.widgets import Button
# Function to be triggered by the button click
def button_click(event):
print("Button Clicked!") # Perform actions or call functions here
# Creating a figure and axes
fig, ax = plt.subplots()
ax.plot([1, 2, 3], [4, 5, 6])
# Define the position and dimensions of the button
button_ax = plt.axes([0.7, 0.05, 0.2, 0.075]) # [left, bottom, width, height]
# Create a button object
button = Button(button_ax, 'Click me') # 'Click me' is the text displayed on the button
# Connect the button's click event to the function
button.on_clicked(button_click)
# Show the plot
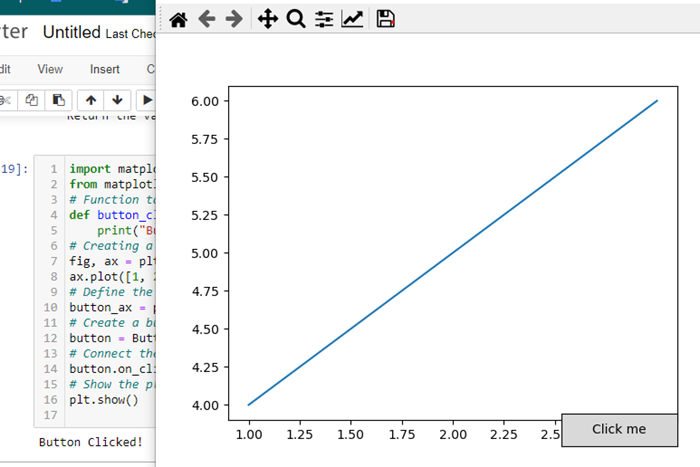
plt.show()
Output
Customization and Functionality
Position and Size − Adjust the position and size of the button using [left, bottom, width, height] coordinates.
Button Text − Specify the text displayed on the button.
Button Action − Define the function that executes when the button is clicked. This can include actions such as updating the plot, calculating new data or triggering other events.
The Button widget provides an interactive element within Matplotlib plots by allowing users to trigger actions or functions directly from the plot interface. It's useful for controlling various functionalities or executing specific tasks associated with the visualization.
To Continue Learning Please Login