- Matplotlib Basics
- Matplotlib - Home
- Matplotlib - Introduction
- Matplotlib - Environment Setup
- Matplotlib - Anaconda distribution
- Matplotlib - Jupyter Notebook
- Matplotlib - Pyplot API
- Matplotlib - Simple Plot
- Matplotlib - Text
- Matplotlib - Images
- Matplotlib - Mathematical Expressions
- Matplotlib - Transforms
- Matplotlib - Ticks and Tick Labels
- Matplotlib - Axis Ranges
- Matplotlib - Axis Scales
- Matplotlib - Axis Ticks
- Matplotlib - Formatting Axes
- Matplotlib - Axes Class
- Matplotlib - Twin Axes
- Matplotlib - Figure Class
- Matplotlib - Multiplots
- Matplotlib - Grids
- Matplotlib - Object-oriented Interface
- Matplotlib - PyLab module
- Matplotlib - Subplots() Function
- Matplotlib - Subplot2grid() Function
- Matplotlib - Anchored Artists
- Matplotlib - Manual Contour
- Matplotlib - Coords Report
- Matplotlib - AGG filter
- Matplotlib - Ribbon Box
- Matplotlib - Fill Spiral
- Matplotlib - Findobj Demo
- Matplotlib - Hyperlinks
- Matplotlib - Image Thumbnail
- Matplotlib - Plotting with Keywords
- Matplotlib - Create Logo
- Matplotlib - Multipage PDF
- Matplotlib - Multiprocessing
- Matplotlib - Print Stdout
- Matplotlib - Compound Path
- Matplotlib - Sankey Class
- Matplotlib - MRI with EEG
- Matplotlib - Stylesheets
- Matplotlib - Background Colors
- Matplotlib - Basemap -->
- Matplotlib Widgets
- Matplotlib - Cursor Widget
- Matplotlib - Annotated Cursor
- Matplotlib - Buttons Widget
- Matplotlib - Check Buttons
- Matplotlib - Lasso Selector
- Matplotlib - Menu Widget
- Matplotlib - Mouse Cursor
- Matplotlib - Multicursor
- Matplotlib - Polygon Selector
- Matplotlib - Radio Buttons
- Matplotlib - RangeSlider
- Matplotlib - Rectangle Selector
- Matplotlib - Ellipse Selector
- Matplotlib - Slider Widget
- Matplotlib - Span Selector
- Matplotlib - Textbox
- Matplotlib Plotting
- Matplotlib - Bar Graphs
- Matplotlib - Histogram
- Matplotlib - Pie Chart
- Matplotlib - Scatter Plot
- Matplotlib - Box Plot
- Matplotlib - Violin Plot
- Matplotlib - Contour Plot
- Matplotlib - 3D Plotting
- Matplotlib - 3D Contours
- Matplotlib - 3D Wireframe Plot
- Matplotlib - 3D Surface Plot
- Matplotlib - Quiver Plot
- Matplotlib Useful Resources
- Matplotlib - Quick Guide
- Matplotlib - Useful Resources
- Matplotlib - Discussion
Matplotlib - Sankey Class
Sankey Class in matplotlib is used to create Sankey diagrams, Before diving into the Sankey Class, it's essential to understand the basics of Sankey diagrams.
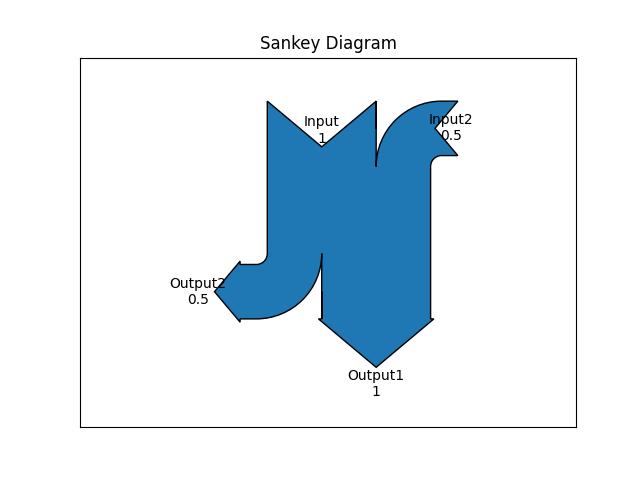
A Sankey diagram is a powerful visualization tool that represents the flow of resources, energy, or information between different entities or processes. It uses arrows of varying widths to depict the quantity of flow, with the width being proportional to the quantity being represented. See the below image for the reference of a simple Sankey Diagram
Key Components of a Sankey Diagram
Nodes − Entities or processes between which the flow occurs.
Flows − Arrows connecting nodes, representing the quantity of the flow.
Labels − Descriptions associated with nodes or flows.
Sankey Class in Matplotlib
In Matplotlib, the Sankey() class provides a convenient way to create these diagrams. Below is the syntax of the class −
Syntax
class matplotlib.sankey.Sankey(ax=None, scale=1.0, unit='', format='%G', gap=0.25, radius=0.1, shoulder=0.03, offset=0.15, head_angle=100, margin=0.4, tolerance=1e-06, **kwargs)
Following are the steps to create a Sankey diagram using matplotlib Sankey Class −
Creating a Sankey Object − This can be done by using the Sankey() class which initializes an instance of the Sankey class, which will be used to build the diagram.
Adding the Flows and Labels − The Sankey.add() method is used to specify the flows and labels.
Finish and Display − The Sankey.finish() method finalizes the diagram, and plt.show() displays it.
Drawing a Basic Sankey Diagram
Now, let's build a simple Sankey diagram with The default settings. The below example creates a diagram of one input and output flow. The flows are specified with the flows argument, while labels are provided using labels argument.
Example 1
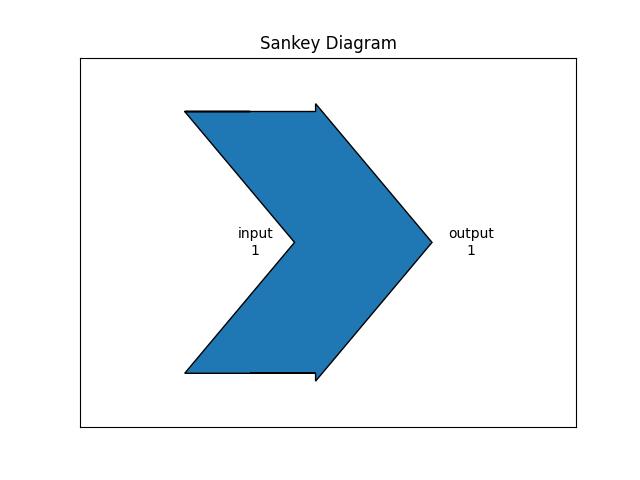
Here is the example that crates the Sankey diagram with one input and output flows.
import matplotlib.pyplot as plt
from matplotlib.sankey import Sankey
sankey = Sankey()
sankey.add(flows=[1, -1],
   labels=['input', 'output'])
plt.title("Sankey Diagram")
sankey.finish()
plt.show()
Output
On executing the above program, will generate the following Sankey diagram −
Example 2
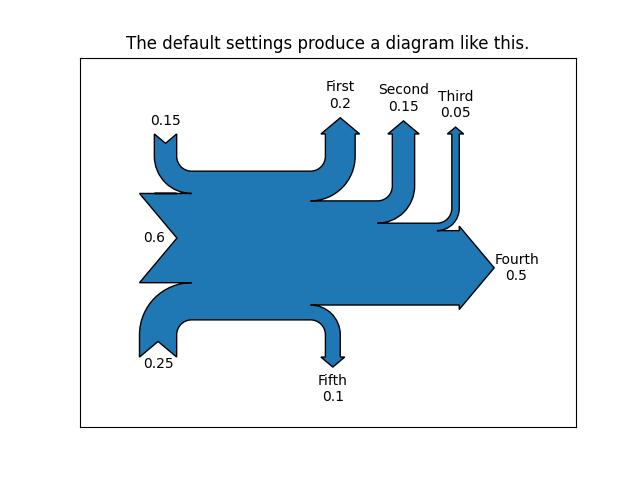
Another example demonstrates how to create a simple diagram by implicitly calling the Sankey.add() method and by appending finish() to the call to the class.
import matplotlib.pyplot as plt

from matplotlib.sankey import Sankey
Sankey(flows=[0.25, 0.15, 0.60, -0.20, -0.15, -0.05, -0.50, -0.10],
   labels=['', '', '', 'First', 'Second', 'Third', 'Fourth', 'Fifth'],
   orientations=[-1, 1, 0, 1, 1, 1, 0, -1]).finish()
plt.title("The default settings produce a diagram like this.")
plt.show()
Output
On executing the above program, will generate the following Sankey diagram −
Customized Sankey Diagram
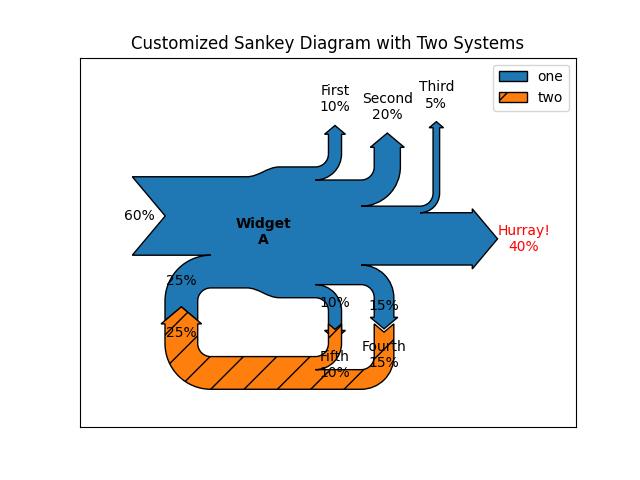
The Matplotlib Sankey class provides more customization options, including connecting multiple Sankey diagrams together, placing a label in the middle of the diagram, implicitly passing keyword arguments to PathPatch(), changing the angle of the arrowheads, changing the appearance of the patch and the labels after the figure is created, and more.
Example
Here is an example that creates a complex customized Sankey Diagram using matplotlib sankey() class.
import matplotlib.pyplot as plt
from matplotlib.sankey import Sankey

# Create a subplot
fig = plt.figure()
ax = fig.add_subplot(1, 1, 1, xticks=[], yticks=[], title="Customized Sankey Diagram with Two Systems")

# Create a Sankey diagram
sankey = Sankey(ax=ax, scale=0.01, offset=0.2, format='%.0f', unit='%')

# Add flows and labels for the first system
sankey.add(flows=[25, 0, 60, -10, -20, -5, -15, -10, -40], label='one',
   labels=['', '', '', 'First', 'Second', 'Third', 'Fourth','Fifth', 'Hurray!'],
   orientations=[-1, 1, 0, 1, 1, 1, -1, -1, 0],
   pathlengths=[0.25, 0.25, 0.25, 0.25, 0.25, 0.6, 0.25, 0.25, 0.25],
   patchlabel="Widget\nA")

# Add flows and labels for the second system, connected to the first
sankey.add(flows=[-25, 15, 10], label='two',
   orientations=[-1, -1, -1], prior=0, connect=(0, 0))

# Finish the Sankey diagram and apply customizations
diagrams = sankey.finish()
diagrams[-1].patch.set_hatch('/')
diagrams[0].texts[-1].set_color('r')
diagrams[0].text.set_fontweight('bold')

# Display the diagram
plt.legend()
plt.show()
Output
On executing the above program, will generate the following Sankey diagram −
To Continue Learning Please Login