- Matplotlib Basics
- Matplotlib - Home
- Matplotlib - Introduction
- Matplotlib - Environment Setup
- Matplotlib - Anaconda distribution
- Matplotlib - Jupyter Notebook
- Matplotlib - Pyplot API
- Matplotlib - Simple Plot
- Matplotlib - Text
- Matplotlib - Images
- Matplotlib - Mathematical Expressions
- Matplotlib - Transforms
- Matplotlib - Ticks and Tick Labels
- Matplotlib - Axis Ranges
- Matplotlib - Axis Scales
- Matplotlib - Axis Ticks
- Matplotlib - Formatting Axes
- Matplotlib - Axes Class
- Matplotlib - Twin Axes
- Matplotlib - Figure Class
- Matplotlib - Multiplots
- Matplotlib - Grids
- Matplotlib - Object-oriented Interface
- Matplotlib - PyLab module
- Matplotlib - Subplots() Function
- Matplotlib - Subplot2grid() Function
- Matplotlib - Anchored Artists
- Matplotlib - Manual Contour
- Matplotlib - Coords Report
- Matplotlib - AGG filter
- Matplotlib - Ribbon Box
- Matplotlib - Fill Spiral
- Matplotlib - Findobj Demo
- Matplotlib - Hyperlinks
- Matplotlib - Image Thumbnail
- Matplotlib - Plotting with Keywords
- Matplotlib - Create Logo
- Matplotlib - Multipage PDF
- Matplotlib - Multiprocessing
- Matplotlib - Print Stdout
- Matplotlib - Compound Path
- Matplotlib - Sankey Class
- Matplotlib - MRI with EEG
- Matplotlib - Stylesheets
- Matplotlib - Background Colors
- Matplotlib - Basemap -->
- Matplotlib Widgets
- Matplotlib - Cursor Widget
- Matplotlib - Annotated Cursor
- Matplotlib - Buttons Widget
- Matplotlib - Check Buttons
- Matplotlib - Lasso Selector
- Matplotlib - Menu Widget
- Matplotlib - Mouse Cursor
- Matplotlib - Multicursor
- Matplotlib - Polygon Selector
- Matplotlib - Radio Buttons
- Matplotlib - RangeSlider
- Matplotlib - Rectangle Selector
- Matplotlib - Ellipse Selector
- Matplotlib - Slider Widget
- Matplotlib - Span Selector
- Matplotlib - Textbox
- Matplotlib Plotting
- Matplotlib - Bar Graphs
- Matplotlib - Histogram
- Matplotlib - Pie Chart
- Matplotlib - Scatter Plot
- Matplotlib - Box Plot
- Matplotlib - Violin Plot
- Matplotlib - Contour Plot
- Matplotlib - 3D Plotting
- Matplotlib - 3D Contours
- Matplotlib - 3D Wireframe Plot
- Matplotlib - 3D Surface Plot
- Matplotlib - Quiver Plot
- Matplotlib Useful Resources
- Matplotlib - Quick Guide
- Matplotlib - Useful Resources
- Matplotlib - Discussion
Matplotlib - Fill Spiral
In general definition, a spiral is a geometric curve that emanates from a central point and moves farther away as it revolves around that point. Spirals exhibit a whorled pattern and come in various forms, including Archimedean spirals, and logarithmic spirals. See the below image for reference −
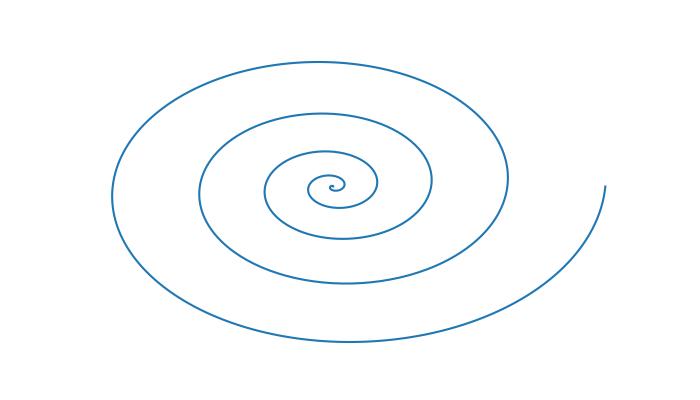
On the other hand, a Fill Spiral refers to the visual representation of a spiral curve in which the space enclosed by the spiral is filled with a color or pattern.
In this tutorial, we'll see two different ways of creating and filling spirals using Matplotlib. the process involves defining the mathematical equations that represent the spiral and then using a function like pyplot.fill() to color the region enclosed by the spiral.
Creating a Basic Fill Spiral
A basic fill spiral can be defined using parametric equations in polar coordinates. The pyplot.fill() function is tthen used to fill the region enclosed by the spiral with a color.
Example
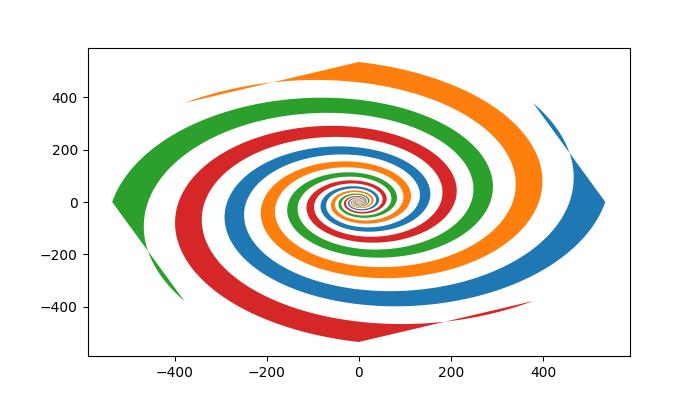
Here is an example that creates the basic fill spiral using the pyplot.fill() and np.concatenate() functions.
import matplotlib.pyplot as plt
import numpy as np

# Define parameters
theta = np.radians(np.linspace(0,360*5,1000))
a = 1
b = 0.2

fig, axes = plt.subplots(figsize=(7, 4))

# Create a spiral
for dt in np.arange(0, 2 * np.pi, np.pi / 2.0):
   x = a * np.cos(theta + dt) * np.exp(b * theta)
   y = a * np.sin(theta + dt) * np.exp(b * theta)

   dt = dt + np.pi / 4.0

   x2 = a * np.cos(theta + dt) * np.exp(b * theta)
   y2 = a * np.sin(theta + dt) * np.exp(b * theta)

   # Concatenate points for filling
   xf = np.concatenate((x, x2[::-1]))
   yf = np.concatenate((y, y2[::-1]))

   # Fill the spiral
   plt.fill(xf, yf)

# Display the plot
plt.show()
Output
On executing the above code we will get the following output −
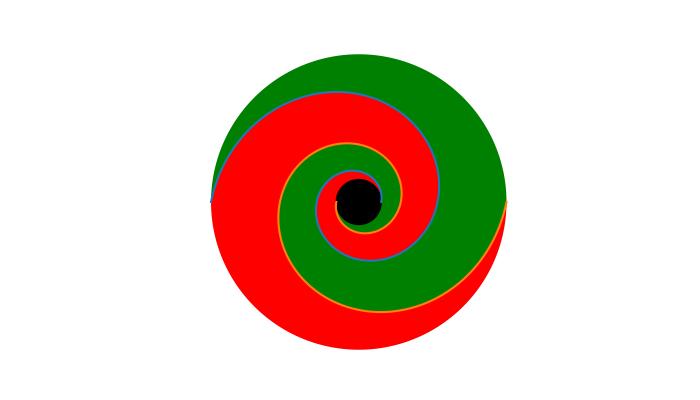
Creating the Logarithmic Fill Spiral
A logarithmic spiral is a specific type of spiral where the radius grows exponentially with the angle.
Example
The example constructs the logarithmic spiral in pieces, combining segments with different parameters.
import matplotlib.pyplot as plt
import numpy as np

# Define parameters for the logarithmic spiral
a = 2
b = 0.2

# Generate theta and radius values for different pieces
theta1 = np.linspace(0, np.pi * 3.0, 1000, endpoint=True)
r1 = np.exp(b * theta1) * a

theta2 = np.linspace(np.pi, np.pi * 4.0, 1000, endpoint=True)
r2 = np.exp(b * theta1) * a

theta3 = np.linspace(np.pi, 0, 1000)
r3 = r1[-1] * np.ones_like(theta3)

theta4 = np.linspace(np.pi, 2 * np.pi, 1000)
r4 = a * np.ones_like(theta4)

theta5 = np.linspace(np.pi, 2 * np.pi, 1000)
r5 = r1[-1] * np.ones_like(theta5)

theta6 = np.linspace(0, np.pi, 1000)
r6 = a * np.ones_like(theta6)

# Concatenate pieces for filling
theta_final_red = np.concatenate([theta1, theta3, np.flip(theta2), theta4])
radius_red = np.concatenate([r1, r3, np.flip(r2), r4])

theta_final_blue = np.concatenate([theta1, theta5, np.flip(theta2), theta6])
radius_blue = np.concatenate([r1, r5, np.flip(r2), r6])

# Plot the filled spirals
fig = plt.figure(figsize=(7,4))
ax = fig.add_subplot(111, projection='polar')
ax.set_rmax(r1[-1])
ax.fill(theta_final_red, radius_red, "g")
ax.fill(theta_final_blue, radius_blue, "r")

# Plot the individual pieces
ax.plot(theta1, r1)
ax.plot(theta2, r2)

# Black inner circle
theta_inner = np.linspace(0, np.pi * 2.0, 1000, endpoint=True)
r_inner = [a] * len(theta_inner)
ax.fill(theta_inner, r_inner, c='black')

ax.axis(False)
ax.grid(False)

# Display the plot
plt.show()
Output
On executing the above code we will get the following output −
To Continue Learning Please Login