
Article Categories
- All Categories
-
 Data Structure
-
 Networking
-
 RDBMS
RDBMS
-
 Operating System
-
 Java
Java
-
 MS Excel
-
 iOS
iOS
-
 HTML
HTML
-
 CSS
CSS
-
 Android
-
 Python
-
 C Programming
-
 C++
C++
-
 C#
C#
-
 MongoDB
-
 MySQL
MySQL
-
 Javascript
-
 PHP
PHP
-
 Economics & Finance
Selected Reading
How to remove border of bars from histogram in base R?
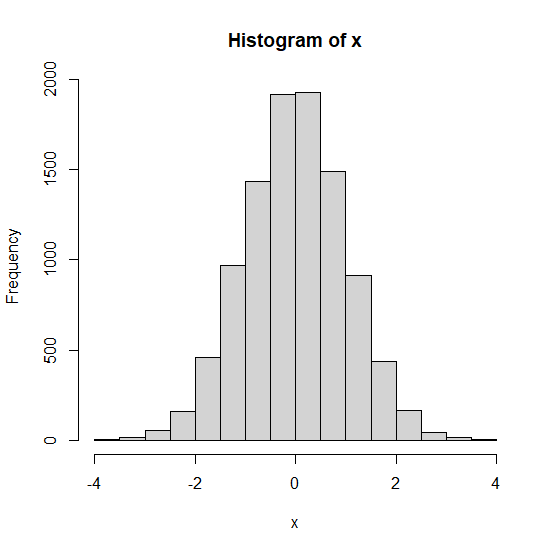
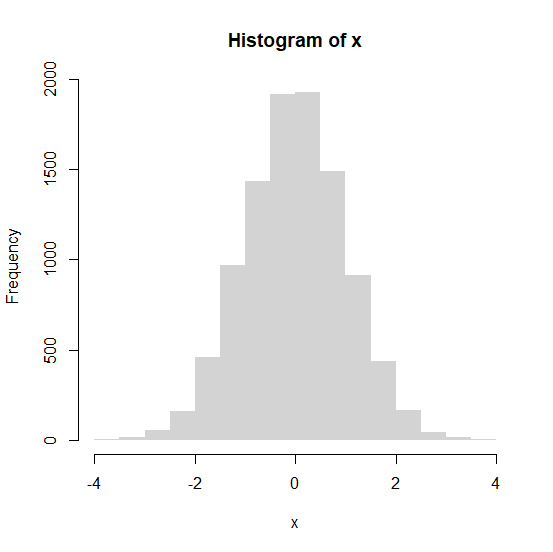
By default, a histogram drawn in base R has black color borders around bars. We might want to remove these black borders to make the histogram visually smooth. This can be done by using lty argument with the hist function. For example, if we have a vector x and we want to create a histogram of x without border of bars then we can use the argument as hist(x,lty="blank").
Example
> x<-rnorm(10000)
> hist(x)
Output:
Creating histogram of x without border of bars:
Example
> hist(x,lty="blank")
Output:

Updated on: 2020-11-21T05:58:53+05:30
950 Views

Advertisements