
Article Categories
- All Categories
-
 Data Structure
-
 Networking
-
 RDBMS
RDBMS
-
 Operating System
-
 Java
Java
-
 MS Excel
-
 iOS
iOS
-
 HTML
HTML
-
 CSS
CSS
-
 Android
-
 Python
-
 C Programming
-
 C++
C++
-
 C#
C#
-
 MongoDB
-
 MySQL
MySQL
-
 Javascript
-
 PHP
PHP
-
 Economics & Finance
Selected Reading
How to create a histogram with dots instead of bars in base R?
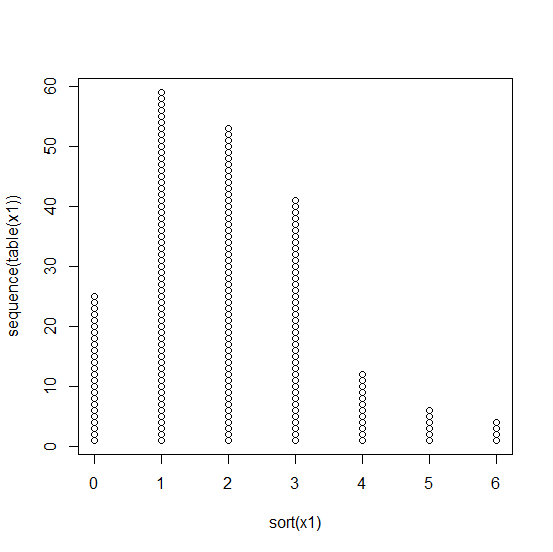
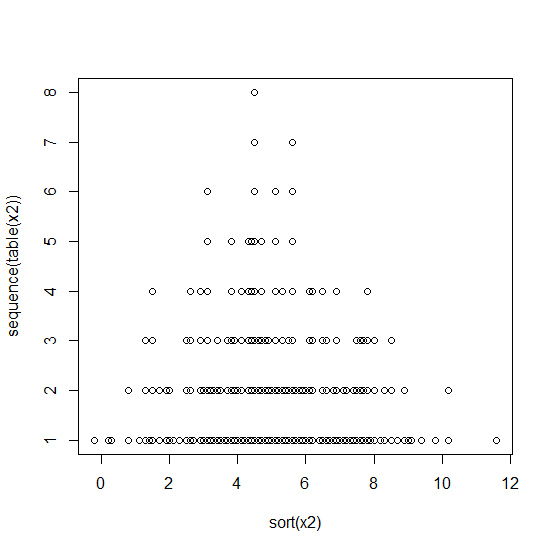
To create a histogram with dots instead of bars, we can use the plot function in base R. The x values will be based on the sorting of the vector values and the y values will be based on the sequence of the table for the vector values. Therefore, we would be needing sorting and table with sequence. Check out the below examples to understand how it can be done.
Example1
> x1<-rpois(200,2)
> plot(sort(x1),sequence(table(x1)))
Output
Example2
> x2<-round(rnorm(200,5,2),1)
> plot(sort(x2),sequence(table(x2)))
Output

Updated on: 2021-03-04T08:56:51+05:30
795 Views

Advertisements