
Article Categories
- All Categories
-
 Data Structure
-
 Networking
-
 RDBMS
RDBMS
-
 Operating System
-
 Java
Java
-
 MS Excel
-
 iOS
iOS
-
 HTML
HTML
-
 CSS
CSS
-
 Android
-
 Python
-
 C Programming
-
 C++
C++
-
 C#
C#
-
 MongoDB
-
 MySQL
MySQL
-
 Javascript
-
 PHP
PHP
-
 Economics & Finance
Selected Reading
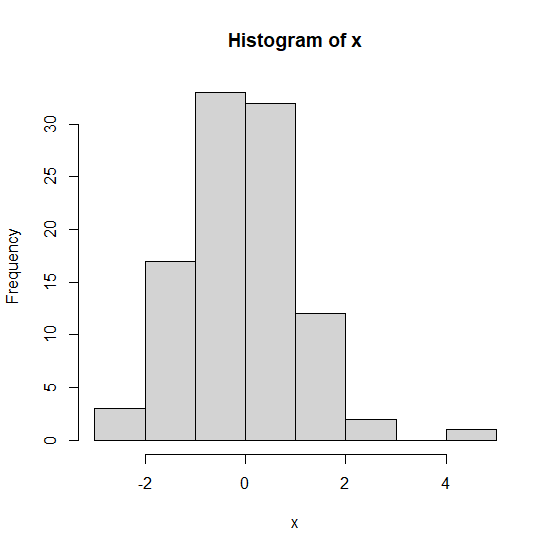
How to create a histogram without bins in base R?
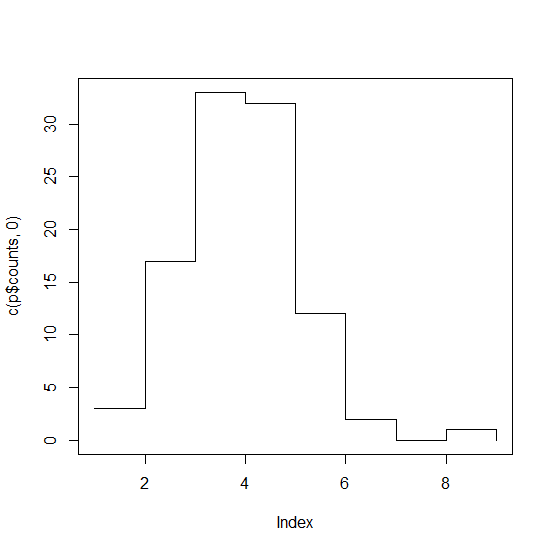
We can set type argument to s in plot function to create a histogram without bins but first we need to create the histogram and store it in an object. For example, if we have a vector say x then the histogram of x can be stored in an object called p then we can use the command plot(c(p$counts,0),type="s") to create the histogram without bins as shown in the below example.
Example
> x<-rnorm(100)
> p<-hist(x)
Output
Example
> plot(c(p$counts,0),type="s")
Output

Updated on: 2021-03-06T05:08:49+05:30
428 Views

Advertisements