
Article Categories
- All Categories
-
 Data Structure
-
 Networking
-
 RDBMS
RDBMS
-
 Operating System
-
 Java
Java
-
 MS Excel
-
 iOS
iOS
-
 HTML
HTML
-
 CSS
CSS
-
 Android
-
 Python
-
 C Programming
-
 C++
C++
-
 C#
C#
-
 MongoDB
-
 MySQL
MySQL
-
 Javascript
-
 PHP
PHP
-
 Economics & Finance
Selected Reading
How to define the number of breaks in base R histogram?
To define the number of breaks in base R histogram, we can use breaks argument along with hist function.
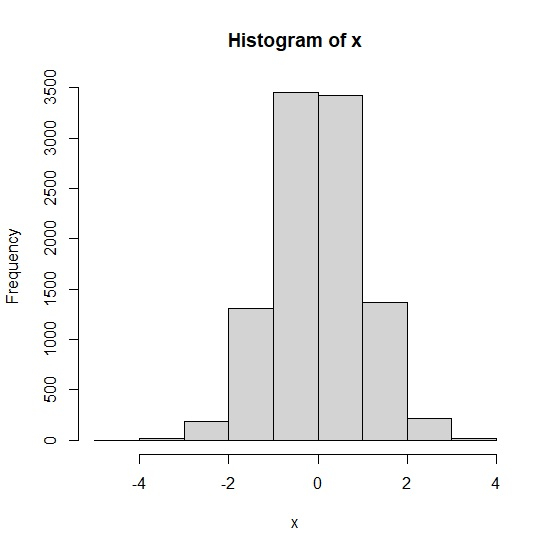
Create the histogram with small number of breaks
Use a vector with normal distribution and the histogram of the same vector with ten breaks −
x<-rnorm(10000)
hist(x,breaks=10)
Output
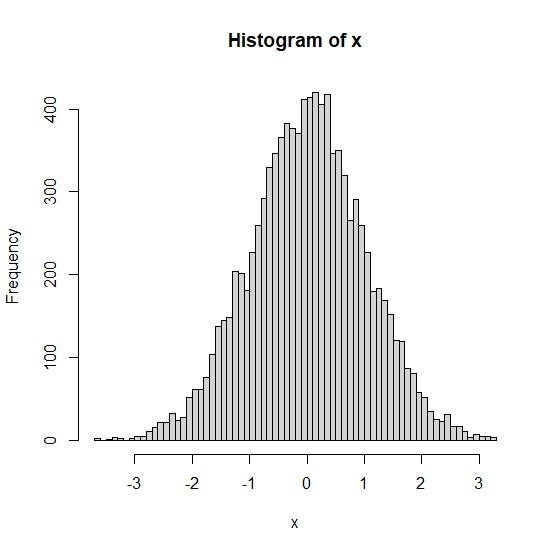
Create the histogram with medium number of breaks
Use a vector with normal distribution and the histogram of the same vector with fifty breaks −
x<-rnorm(10000)
hist(x,breaks=50)
Output
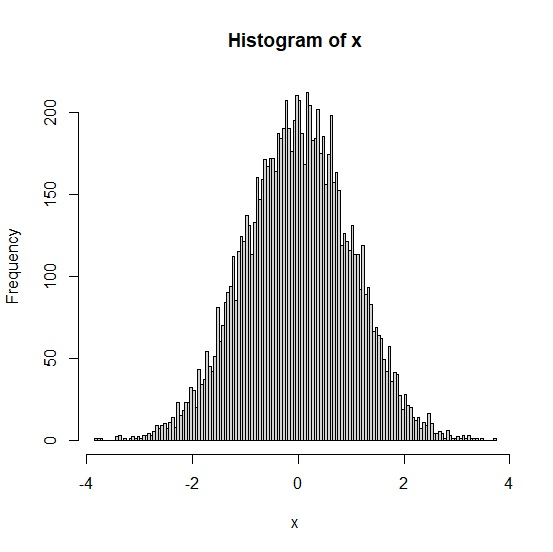
Create the histogram with large number of breaks
Use a vector with normal distribution and the histogram of the same vector with twohundred breaks −
x<-rnorm(10000)
hist(x,breaks=200)
Output
Create the histogram with medium number of breaks
Use a vector with normal distribution and the histogram of the same vector with fifty breaks −
x<-rnorm(10000)
hist(x,breaks=50)
Output

Updated on: 2026-03-11T22:50:58+05:30
4K+ Views

Advertisements